Races in Ponte Vedra, Florida (FL) Detailed Stats
Ancestries, Foreign-born residents, place of birth
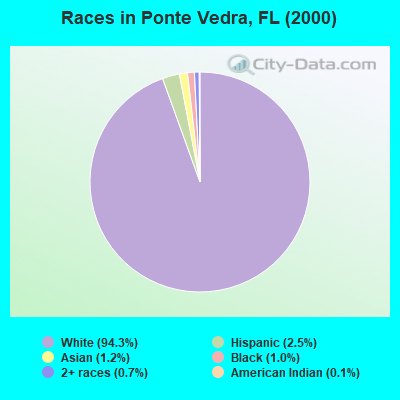
Race distribution in Ponte Vedra

- 25,32294.3%White alone
- 6832.5%Hispanic
- 3181.2%Asian alone
- 2791.0%Black alone
- 1860.7%Two or more races
- 360.1%American Indian alone
- 210.08%Other race alone
- 50.02%Native Hawaiian and Other
Pacific Islander alone
2000
2022
-
- 10,458,50965.4%White alone
- 2,682,71516.8%Hispanic
- 2,264,26814.2%Black alone
- 261,6931.6%Asian alone
- 236,9541.5%Two or more races
- 42,3580.3%American Indian alone
- 28,9940.2%Other race alone
- 6,8870.04%Native Hawaiian and Other
Pacific Islander alone

-
- 11,309,40350.8%White alone
- 6,025,03927.1%Hispanic
- 3,241,01514.6%Black alone
- 861,6303.9%Two or more races
- 623,6922.8%Asian alone
- 152,0540.7%Other race alone
- 22,5040.1%American Indian alone
- 9,4860.04%Native Hawaiian and Other
Pacific Islander alone

Income and house value in Ponte Vedra
- Median household income in 2022
- $143,583White non-Hispanic householders
- over $200,000Black householders
- over $200,000Asian householders
- $62,088Some other race householders
- $83,295Two or more races householders
- $188,539Hispanic or Latino race householders
- Median 2022 house value
- $921,574White Non-Hispanic householders
- $551,968Black or African American householders
- over $1,000,000Asian householders
- $776,521Two or more races householders
- over $1,000,000Hispanic or Latino householders
Household income for White non-Hispanic householders

Household income for Black householders

Household income for Asian householders

Household income for Two or more races householders

Household income for Hispanic or Latino race householders

Zip code: 32082