Races in Plant City, Florida (FL) Detailed Stats
Data:
Races - White alone (%)
Races - White alone (% change since 2000)
Races - Black alone (%)
Races - Black alone (% change since 2000)
Races - American Indian alone (%)
Races - American Indian alone (% change since 2000)
Races - Asian alone (%)
Races - Asian alone (% change since 2000)
Races - Hispanic (%)
Races - Hispanic (% change since 2000)
Races - Native Hawaiian and Other Pacific Islander alone (%)
Races - Native Hawaiian and Other Pacific Islander alone (% change since 2000)
Races - Two or more races(%)
Races - Two or more races(% change since 2000)
Races - Other race alone (%)
Races - Other race alone (% change since 2000)
Racial diversity
Place of birth - Born in state of residence (%)
Place of birth - Born in state of residence (%) - White
Place of birth - Born in state of residence (%) - Black or African American
Place of birth - Born in state of residence (%) - Asian
Place of birth - Born in state of residence (%) - Hispanic or Latino
Place of birth - Born in state of residence (%) - American Indian and Alaska Native
Place of birth - Born in state of residence (%) - Multirace
Place of birth - Born in state of residence (%) - Other Race
Place of birth - Born in other state (%)
Place of birth - Born in other state (%) - White
Place of birth - Born in other state (%) - Black or African American
Place of birth - Born in other state (%) - Asian
Place of birth - Born in other state (%) - Hispanic or Latino
Place of birth - Born in other state (%) - American Indian and Alaska Native
Place of birth - Born in other state (%) - Multirace
Place of birth - Born in other state (%) - Other Race
Place of birth - Native, outside of US (%)
Place of birth - Native, outside of US (%) - White
Place of birth - Native, outside of US (%) - Black or African American
Place of birth - Native, outside of US (%) - Asian
Place of birth - Native, outside of US (%) - Hispanic or Latino
Place of birth - Native, outside of US (%) - American Indian and Alaska Native
Place of birth - Native, outside of US (%) - Multirace
Place of birth - Native, outside of US (%) - Other Race
Place of birth - Foreign born (%)
Place of birth - Foreign born (%) - White
Place of birth - Foreign born (%) - Black or African American
Place of birth - Foreign born (%) - Asian
Place of birth - Foreign born (%) - Hispanic or Latino
Place of birth - Foreign born (%) - American Indian and Alaska Native
Place of birth - Foreign born (%) - Multirace
Place of birth - Foreign born (%) - Other Race
Residents speaking English at home (%)
Residents speaking English at home - Born in the United States (%)
Residents speaking English at home - Native, born elsewhere (%)
Residents speaking English at home - Foreign born (%)
Residents speaking Spanish at home (%)
Residents speaking Spanish at home - Born in the United States (%)
Residents speaking Spanish at home - Native, born elsewhere (%)
Residents speaking Spanish at home - Foreign born (%)
Residents speaking other language at home (%)
Residents speaking other language at home - Born in the United States (%)
Residents speaking other language at home - Native, born elsewhere (%)
Residents speaking other language at home - Foreign born (%)
Marital status - Never married (%)
Marital status - Now married (%)
Marital status - Separated (%)
Marital status - Widowed (%)
Marital status - Divorced (%)
Ancestries Reported - Arab (%)
Ancestries Reported - Czech (%)
Ancestries Reported - Danish (%)
Ancestries Reported - Dutch (%)
Ancestries Reported - English (%)
Ancestries Reported - French (%)
Ancestries Reported - French Canadian (%)
Ancestries Reported - German (%)
Ancestries Reported - Greek (%)
Ancestries Reported - Hungarian (%)
Ancestries Reported - Irish (%)
Ancestries Reported - Italian (%)
Ancestries Reported - Lithuanian (%)
Ancestries Reported - Norwegian (%)
Ancestries Reported - Polish (%)
Ancestries Reported - Portuguese (%)
Ancestries Reported - Russian (%)
Ancestries Reported - Scotch-Irish (%)
Ancestries Reported - Scottish (%)
Ancestries Reported - Slovak (%)
Ancestries Reported - Subsaharan African (%)
Ancestries Reported - Swedish (%)
Ancestries Reported - Swiss (%)
Ancestries Reported - Ukrainian (%)
Ancestries Reported - United States (%)
Ancestries Reported - Welsh (%)
Ancestries Reported - West Indian (%)
Ancestries Reported - Other (%)
Geographical mobility - Same house 1 year ago (%)
Geographical mobility - Same house 1 year ago (%) - White
Geographical mobility - Same house 1 year ago (%) - Black or African American
Geographical mobility - Same house 1 year ago (%) - Asian
Geographical mobility - Same house 1 year ago (%) - Hispanic or Latino
Geographical mobility - Same house 1 year ago (%) - American Indian and Alaska Native
Geographical mobility - Same house 1 year ago (%) - Multirace
Geographical mobility - Same house 1 year ago (%) - Other Race
Geographical mobility - Moved within same county (%)
Geographical mobility - Moved within same county (%) - White
Geographical mobility - Moved within same county (%) - Black or African American
Geographical mobility - Moved within same county (%) - Asian
Geographical mobility - Moved within same county (%) - Hispanic or Latino
Geographical mobility - Moved within same county (%) - American Indian and Alaska Native
Geographical mobility - Moved within same county (%) - Multirace
Geographical mobility - Moved within same county (%) - Other Race
Geographical mobility - Moved from different county within same state (%)
Geographical mobility - Moved from different county within same state (%) - White
Geographical mobility - Moved from different county within same state (%) - Black or African American
Geographical mobility - Moved from different county within same state (%) - Asian
Geographical mobility - Moved from different county within same state (%) - Hispanic or Latino
Geographical mobility - Moved from different county within same state (%) - American Indian and Alaska Native
Geographical mobility - Moved from different county within same state (%) - Multirace
Geographical mobility - Moved from different county within same state (%) - Other Race
Geographical mobility - Moved from different state (%)
Geographical mobility - Moved from different state (%) - White
Geographical mobility - Moved from different state (%) - Black or African American
Geographical mobility - Moved from different state (%) - Asian
Geographical mobility - Moved from different state (%) - Hispanic or Latino
Geographical mobility - Moved from different state (%) - American Indian and Alaska Native
Geographical mobility - Moved from different state (%) - Multirace
Geographical mobility - Moved from different state (%) - Other Race
Geographical mobility - Moved from abroad (%)
Geographical mobility - Moved from abroad (%) - White
Geographical mobility - Moved from abroad (%) - Black or African American
Geographical mobility - Moved from abroad (%) - Asian
Geographical mobility - Moved from abroad (%) - Hispanic or Latino
Geographical mobility - Moved from abroad (%) - American Indian and Alaska Native
Geographical mobility - Moved from abroad (%) - Multirace
Geographical mobility - Moved from abroad (%) - Other Race
Place of birth for the foreign-born population - Ireland (%)
Place of birth for the foreign-born population - Denmark (%)
Place of birth for the foreign-born population - Norway (%)
Place of birth for the foreign-born population - Sweden (%)
Place of birth for the foreign-born population - United Kingdom (%)
Place of birth for the foreign-born population - England (%)
Place of birth for the foreign-born population - Scotland (%)
Place of birth for the foreign-born population - Other Northern Europe (%)
Place of birth for the foreign-born population - Austria (%)
Place of birth for the foreign-born population - Belgium (%)
Place of birth for the foreign-born population - France (%)
Place of birth for the foreign-born population - Germany (%)
Place of birth for the foreign-born population - Netherlands (%)
Place of birth for the foreign-born population - Switzerland (%)
Place of birth for the foreign-born population - Other Western Europe (%)
Place of birth for the foreign-born population - Greece (%)
Place of birth for the foreign-born population - Italy (%)
Place of birth for the foreign-born population - Portugal (%)
Place of birth for the foreign-born population - Spain (%)
Place of birth for the foreign-born population - Other Southern Europe (%)
Place of birth for the foreign-born population - Albania (%)
Place of birth for the foreign-born population - Belarus (%)
Place of birth for the foreign-born population - Bosnia and Herzegovina (%)
Place of birth for the foreign-born population - Bulgaria (%)
Place of birth for the foreign-born population - Croatia (%)
Place of birth for the foreign-born population - Czechoslovakia (%)
Place of birth for the foreign-born population - Hungary (%)
Place of birth for the foreign-born population - Latvia (%)
Place of birth for the foreign-born population - Lithuania (%)
Place of birth for the foreign-born population - North Macedonia (Macedonia) (%)
Place of birth for the foreign-born population - Moldova (%)
Place of birth for the foreign-born population - Poland (%)
Place of birth for the foreign-born population - Romania (%)
Place of birth for the foreign-born population - Russia (%)
Place of birth for the foreign-born population - Serbia (%)
Place of birth for the foreign-born population - Ukraine (%)
Place of birth for the foreign-born population - Other Eastern Europe (%)
Place of birth for the foreign-born population - China (%)
Place of birth for the foreign-born population - Hong Kong (%)
Place of birth for the foreign-born population - Taiwan (%)
Place of birth for the foreign-born population - Japan (%)
Place of birth for the foreign-born population - Korea (%)
Place of birth for the foreign-born population - Other Eastern Asia (%)
Place of birth for the foreign-born population - Afghanistan (%)
Place of birth for the foreign-born population - Bangladesh (%)
Place of birth for the foreign-born population - India (%)
Place of birth for the foreign-born population - Iran (%)
Place of birth for the foreign-born population - Kazakhstan (%)
Place of birth for the foreign-born population - Nepal (%)
Place of birth for the foreign-born population - Pakistan (%)
Place of birth for the foreign-born population - Sri Lanka (%)
Place of birth for the foreign-born population - Uzbekistan (%)
Place of birth for the foreign-born population - Other South Central Asia (%)
Place of birth for the foreign-born population - Burma (%)
Place of birth for the foreign-born population - Cambodia (%)
Place of birth for the foreign-born population - Indonesia (%)
Place of birth for the foreign-born population - Laos (%)
Place of birth for the foreign-born population - Malaysia (%)
Place of birth for the foreign-born population - Philippines (%)
Place of birth for the foreign-born population - Singapore (%)
Place of birth for the foreign-born population - Thailand (%)
Place of birth for the foreign-born population - Vietnam (%)
Place of birth for the foreign-born population - Other South Eastern Asia (%)
Place of birth for the foreign-born population - Armenia (%)
Place of birth for the foreign-born population - Iraq (%)
Place of birth for the foreign-born population - Israel (%)
Place of birth for the foreign-born population - Jordan (%)
Place of birth for the foreign-born population - Kuwait (%)
Place of birth for the foreign-born population - Lebanon (%)
Place of birth for the foreign-born population - Saudi Arabia (%)
Place of birth for the foreign-born population - Syria (%)
Place of birth for the foreign-born population - Turkey (%)
Place of birth for the foreign-born population - Yemen (%)
Place of birth for the foreign-born population - Other Western Asia (%)
Place of birth for the foreign-born population - Eritrea (%)
Place of birth for the foreign-born population - Ethiopia (%)
Place of birth for the foreign-born population - Kenya (%)
Place of birth for the foreign-born population - Somalia (%)
Place of birth for the foreign-born population - Uganda (%)
Place of birth for the foreign-born population - Zimbabwe (%)
Place of birth for the foreign-born population - Other Eastern Africa (%)
Place of birth for the foreign-born population - Cameroon (%)
Place of birth for the foreign-born population - Congo (%)
Place of birth for the foreign-born population - Democratic Republic of Congo (Zaire) (%)
Place of birth for the foreign-born population - Other Middle Africa (%)
Place of birth for the foreign-born population - Egypt (%)
Place of birth for the foreign-born population - Morocco (%)
Place of birth for the foreign-born population - Sudan (%)
Place of birth for the foreign-born population - Other Northern Africa (%)
Place of birth for the foreign-born population - South Africa (%)
Place of birth for the foreign-born population - Other Southern Africa (%)
Place of birth for the foreign-born population - Cabo Verde (%)
Place of birth for the foreign-born population - Ghana (%)
Place of birth for the foreign-born population - Liberia (%)
Place of birth for the foreign-born population - Nigeria (%)
Place of birth for the foreign-born population - Senegal (%)
Place of birth for the foreign-born population - Sierra Leone (%)
Place of birth for the foreign-born population - Other Western Africa (%)
Place of birth for the foreign-born population - Australia (%)
Place of birth for the foreign-born population - New Zealand (%)
Place of birth for the foreign-born population - Fiji (%)
Place of birth for the foreign-born population - Micronesia (%)
Place of birth for the foreign-born population - Bahamas (%)
Place of birth for the foreign-born population - Barbados (%)
Place of birth for the foreign-born population - Cuba (%)
Place of birth for the foreign-born population - Dominica (%)
Place of birth for the foreign-born population - Dominican Republic (%)
Place of birth for the foreign-born population - Grenada (%)
Place of birth for the foreign-born population - Haiti (%)
Place of birth for the foreign-born population - Jamaica (%)
Place of birth for the foreign-born population - St. Vincent and the Grenadines (%)
Place of birth for the foreign-born population - Trinidad and Tobago (%)
Place of birth for the foreign-born population - West Indies (%)
Place of birth for the foreign-born population - Other Caribbean (%)
Place of birth for the foreign-born population - Belize (%)
Place of birth for the foreign-born population - Costa Rica (%)
Place of birth for the foreign-born population - El Salvador (%)
Place of birth for the foreign-born population - Guatemala (%)
Place of birth for the foreign-born population - Honduras (%)
Place of birth for the foreign-born population - Mexico (%)
Place of birth for the foreign-born population - Nicaragua (%)
Place of birth for the foreign-born population - Panama (%)
Place of birth for the foreign-born population - Other Central America (%)
Place of birth for the foreign-born population - Argentina (%)
Place of birth for the foreign-born population - Bolivia (%)
Place of birth for the foreign-born population - Brazil (%)
Place of birth for the foreign-born population - Chile (%)
Place of birth for the foreign-born population - Colombia (%)
Place of birth for the foreign-born population - Ecuador (%)
Place of birth for the foreign-born population - Guyana (%)
Place of birth for the foreign-born population - Peru (%)
Place of birth for the foreign-born population - Uruguay (%)
Place of birth for the foreign-born population - Venezuela (%)
Place of birth for the foreign-born population - Other South America (%)
Place of birth for the foreign-born population - Canada (%)
Place of birth for the foreign-born population - Other Northern America (%)
Place of birth for the foreign-born population - Other (%)
Beertopia, Parrish Heritage Days, Art in the Park, Gamble Plantation Open House & more, all this weekend! (2 replies)Irish Celtic Festival, Palmetto Heritage Festival, Festival of the Arts, Paul Anka & Baseball, all this weekend! (0 replies)Downtown SRQ Blues Festival, Quilts on Parade, Gamble Plantation Open House, NHRA Pro Mods & more, all this weekend! (2 replies)Sarasota & Manatee Counties news thread (5290 replies)Chillounge, Art Slam, Moonlight Movie, Beertopia, Heritage Days, Jazz & Fairy House Festival all this weekend! (2 replies)Irish Celtic Festival, Berry Fest, AMI Heritage Day, Baseball & more, all this weekend! (2 replies)
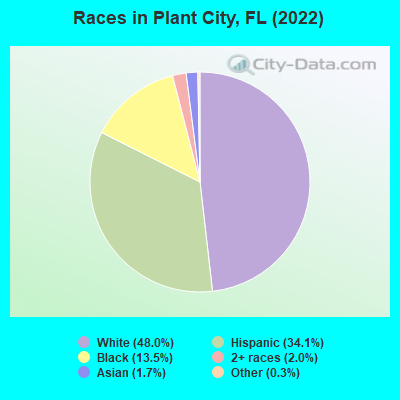
According to 2022 data, the most numerous races in Plant City, FL are White alone (19,595 residents), Hispanic (13,942 residents), and Black alone (5,511 residents). 70.4% of Plant City residents speak English at home. 15.2% of Plant City, FL residents are foreign-born (13.0% born in Latin America), which is 37.9% less than the foreign-born rate of 21.0% across the entire state of Florida.
Race distribution in Plant City
2000 2022
10,458,509 65.4% White alone 2,682,715 16.8% Hispanic 2,264,268 14.2% Black alone 261,693 1.6% Asian alone 236,954 1.5% Two or more races 42,358 0.3% American Indian alone 28,994 0.2% Other race alone 6,887 0.04% Native Hawaiian and Other
11,309,403 50.8% White alone 6,025,039 27.1% Hispanic 3,241,015 14.6% Black alone 861,630 3.9% Two or more races 623,692 2.8% Asian alone 152,054 0.7% Other race alone 22,504 0.1% American Indian alone 9,486 0.04% Native Hawaiian and Other
Income and house value in Plant City Median household income in 2022 $66,846 White non-Hispanic householders$46,607 Black householders$3,738 American Indian and Alaska Native householders$95,318 Asian householders$66,133 Some other race householders$62,767 Two or more races householders$64,402 Hispanic or Latino race householdersMedian 2022 house value $315,905 White Non-Hispanic householders$199,016 Black or African American householders$766,760 American Indian or Alaska Native householders $540,481 Asian householders$247,748 Some other race householders$530,257 Two or more races householders$253,882 Hispanic or Latino householders
Median age by race in Plant City
41.0 Median age for White residents40.0 41.3 41.3 Median age for Black or African American residents40.2 42.3 21.1 Median age for American Indian / Alaska Native residents17.0 42.4 48.6 Median age for Asian residents43.0 50.1 -848,484,847.6 Median age for Native Hawaiian / Pacific Islander residents-776,729,559.0 -490,118,576.6 32.9 Median age for Other race residents34.9 26.6 30.2 Median age for Two or more races residents25.4 33.6 42.4 Median age for White alone residents40.9 44.4 29.8 Median age for Hispanic or Latino residents31.2 28.9
Owner/renter occupied households by race in Plant City
House owners and renters - White residents 6,489 69.8% Owner occupied2,810 30.2% Renter occupiedHouse owners and renters - Black or African American residents 1,001 47.8% Owner occupied1,095 52.2% Renter occupiedHouse owners and renters - American Indian / Alaska Native residents 62 28.4% Owner occupied155 71.6% Renter occupiedHouse owners and renters - Asian residents 176 100.0% Owner occupiedHouse owners and renters - Other race residents 512 50.1% Owner occupied510 49.9% Renter occupiedHouse owners and renters - Two or more races residents 1,091 54.7% Owner occupied902 45.3% Renter occupiedHouse owners and renters - White alone residents 5,959 71.3% Owner occupied2,395 28.7% Renter occupiedHouse owners and renters - Hispanic or Latino residents 2,201 53.5% Owner occupied1,915 46.5% Renter occupied
Language usage in Plant City
English speakers - Total 70.4% of residents of Plant City speak English at home.
27.4% of residents speak Spanish at home 6,147 58.1% Speak English very well4,428 41.9% Speak English less than very well1.4% of residents speak other language at home 423 81.2% Speak English very well98 18.8% Speak English less than very well
English speakers - Born in the United States 91.1% of residents of Plant City speak English at home.
8.7% of residents speak Spanish at home 820 83.3% Speak English very well164 16.7% Speak English less than very well0.3% of residents speak other language at home 37 100.0% Speak English very well
English speakers - Native, born elsewhere 17.9% of residents of Plant City speak English at home.
78.5% of residents speak Spanish at home 817 58.2% Speak English very well586 41.8% Speak English less than very well1.4% of residents speak other language at home 25 100.0% Speak English very well
English speakers - Foreign-born 19.6% of residents of Plant City speak English at home.
74.1% of residents speak Spanish at home 1,687 35.3% Speak English very well3,089 64.7% Speak English less than very well5.9% of residents speak other language at home 296 77.3% Speak English very well87 22.7% Speak English less than very well
White (Caucasian) - Speak only English Native:
93.0% (18,965)Foreign-born:
19.5% (240)
White (Caucasian) - Speak another language Native:
6.5% (1,323)Foreign-born:
75.5% (927)
Black or African American - Speak only English Native:
97.1% (4,156)Foreign-born:
82.4% (814)
Black or African American - Speak another language Native:
3.1% (131)Foreign-born:
17.0% (168)
American Indian / Alaska Native - Speak only English Native:
9.2% (41)Foreign-born:
8.1% (35)
American Indian / Alaska Native - Speak another language Native:
100.0% (445)Foreign-born:
87.0% (378)
Asian - Speak only English Native:
52.6% (135)Foreign-born:
27.4% (125)
Asian - Speak another language Native:
46.8% (120)Foreign-born:
72.9% (333)
Other race - Speak only English Native:
29.4% (539)Foreign-born:
4.9% (74)
Other race - Speak another language Native:
70.5% (1,294)Foreign-born:
95.4% (1,453)
Two or more races - Speak only English Native:
38.9% (1,813)Foreign-born:
2.4% (32)
Two or more races - Speak another language Native:
62.5% (2,910)Foreign-born:
99.5% (1,362)
White alone - Speak only English Native:
99.0% (18,360)Foreign-born:
83.2% (218)
White alone - Speak another language Native:
1.2% (223)Foreign-born:
21.0% (55)
Hispanic or Latino - Speak only English Native:
29.7% (2,389)Foreign-born:
3.7% (182)
Hispanic or Latino - Speak another language Native:
67.7% (5,452)Foreign-born:
96.4% (4,719)
Foreign-born residents in Plant City 6,223 residents are foreign born (13.0% Latin America ).
This city:
15.2%Florida:
21.1%
Marital status for residents in Plant City Marital status - White (Caucasian) population 15 years and over
Males 31.9% Never married51.4% Now married2.1% Separated2.7% Widowed11.9% DivorcedFemales 28.2% Never married45.7% Now married1.7% Separated9.1% Widowed15.4% DivorcedWomen who gave birth in the past 12 months Now married:
51.1% (231)Unmarried:
48.9% (221)
Women who did not give birth in the past 12 months Now married:
42.1% (2,058)Unmarried:
57.9% (2,831)
Marital status - Black or African American population 15 years and over
Males 38.6% Never married39.9% Now married5.7% Separated6.8% Widowed9.0% DivorcedFemales 41.4% Never married31.6% Now married4.1% Separated7.4% Widowed15.5% DivorcedWomen who gave birth in the past 12 months Now married:
0.0% (0)Unmarried:
100.0% (96)
Women who did not give birth in the past 12 months Now married:
26.8% (335)Unmarried:
73.2% (916)
Marital status - American Indian / Alaska Native population 15 years and over
Males 45.4% Never married41.4% Now married0.0% Separated0.0% Widowed13.1% DivorcedFemales 40.6% Never married59.4% Now married0.0% Separated0.0% Widowed0.0% DivorcedWomen who gave birth in the past 12 months Now married:
0.0% (0)Unmarried:
100.0% (22)
Women who did not give birth in the past 12 months Now married:
61.5% (241)Unmarried:
38.5% (151)
Marital status - Asian population 15 years and over
Males 49.8% Never married50.2% Now married0.0% Separated0.0% Widowed0.0% DivorcedFemales 57.7% Never married33.4% Now married0.0% Separated3.4% Widowed5.5% DivorcedWomen who gave birth in the past 12 months Now married:
0.0% (0)Unmarried:
100.0% (18)
Women who did not give birth in the past 12 months Now married:
43.4% (67)Unmarried:
56.6% (88)
Marital status - Other race population 15 years and over
Males 45.0% Never married41.8% Now married2.8% Separated0.0% Widowed10.3% DivorcedFemales 45.7% Never married46.2% Now married1.9% Separated1.2% Widowed5.0% DivorcedWomen who gave birth in the past 12 months Now married:
90.2% (114)Unmarried:
9.8% (12)
Women who did not give birth in the past 12 months Now married:
39.7% (397)Unmarried:
60.3% (603)
Marital status - Two or more races population 15 years and over
Males 50.0% Never married40.9% Now married3.8% Separated0.8% Widowed4.5% DivorcedFemales 42.9% Never married38.4% Now married2.6% Separated6.7% Widowed9.4% DivorcedWomen who gave birth in the past 12 months Now married:
37.5% (23)Unmarried:
62.5% (38)
Women who did not give birth in the past 12 months Now married:
36.8% (617)Unmarried:
63.2% (1,058)
Marital status - White alone, not Hispanic / Latino population 15 years and over
Males 33.3% Never married50.4% Now married2.2% Separated2.6% Widowed11.5% DivorcedFemales 24.1% Never married46.9% Now married1.2% Separated11.2% Widowed16.6% DivorcedWomen who gave birth in the past 12 months Now married:
59.9% (227)Unmarried:
40.1% (152)
Women who did not give birth in the past 12 months Now married:
45.1% (1,867)Unmarried:
54.9% (2,275)
Marital status - Hispanic or Latino population 15 years and over
Males 38.1% Never married48.6% Now married3.4% Separated1.2% Widowed8.6% DivorcedFemales 43.8% Never married42.7% Now married2.4% Separated2.8% Widowed8.3% DivorcedWomen who gave birth in the past 12 months Now married:
48.9% (133)Unmarried:
51.1% (139)
Women who did not give birth in the past 12 months Now married:
37.9% (1,353)Unmarried:
62.1% (2,215)
Ancestries in Plant City
2,141 10.5% American1,528 7.5% English1,129 5.5% Irish803 3.9% German575 2.8% Italian470 2.3% Trinidadian and Tobagonian463 2.3% European204 1.0% Polish150 0.7% British West Indian127 0.6% African102 0.5% French80 0.4% British76 0.4% Scotch-Irish75 0.4% Scottish64 0.3% Greek55 0.3% French Canadian40 0.2% Jamaican36 0.2% Canadian36 0.2% Welsh34 0.2% Turkish31 0.2% Portuguese25 0.1% Palestinian25 0.1% Austrian25 0.1% Norwegian25 0.1% Haitian24 0.1% Scandinavian15 0.07% Cape Verdean14 0.07% Ukrainian13 0.06% Russian12 0.06% Australian12 0.06% Swiss12 0.06% Bahamian12 0.06% Czech11 0.05% Israeli11 0.05% Hungarian11 0.05% West Indian10 0.05% Eastern European10 0.05% Romanian9 0.04% Slovak8 0.04% Lithuanian6 0.03% Lebanese6 0.03% Danish
Geographical mobility in Plant City Same house 1 year ago 19,963 89.2% White (Caucasian)5,066 91.4% Black or African American884 100.0% American Indian / Alaska Native689 94.6% Asian2,840 82.0% Other race5,225 78.7% Two or more races16,945 87.3% White alone, not Hispanic / Latino11,960 86.7% Hispanic or LatinoMoved within same county 1,531 6.8% White / Caucasian404 7.3% Black or African American22 3.0% Asian322 9.3% Other race1,129 17.0% Two or more races1,501 7.7% White alone, not Hispanic / Latino1,161 8.4% Hispanic or LatinoMoved within same state 349 1.6% White / Caucasian63 1.1% Black or African American96 2.8% Other race92 1.4% Two or more races384 2.0% White alone, not Hispanic / Latino139 1.0% Hispanic or LatinoMoved from different state 365 1.6% White / Caucasian12 0.2% Black or African American27 0.8% Other race30 0.4% Two or more races374 1.9% White alone, not Hispanic / Latino102 0.7% Hispanic or LatinoMoved from abroad 73 0.3% White48 0.9% Black or African American43 5.9% Asian195 5.6% Other race41 0.2% White alone, not Hispanic / Latino370 2.7% Hispanic or Latino
Children Nativity (place of birth) in Plant City
Children under 6 years - Living with two parents Both parents native 1,093 100.0% NativeBoth parents foreign-born 348 84.2% Native65 15.8% Foreign-bornOne native, one foreign-born parent 67 100.0% NativeChildren under 6 years - Living with one parent Native parent 689 100.0% NativeForeign-born parent 284 100.0% NativeChildren 6 to 17 years - Living with two parents Both parents native 2,065 100.0% NativeBoth parents foreign-born 895 80.5% Native217 19.5% Foreign-bornOne native, one foreign-born parent 424 100.0% NativeChildren 6 to 17 years - Living with one parent Native parent 1,654 100.0% NativeForeign-born parent 636 57.0% Native480 43.0% Foreign-born
Grandparents responsible for own grandchildren in Plant City
Grandparents (30 to 59 years) White / Caucasian 53 42.5% Responsible for grandchildren72 57.5% Not responsible for grandchildrenBlack or African American 44 100.0% Responsible for grandchildrenOther race 26 100.0% Not responsible for grandchildrenTwo or more races 101 91.4% Responsible for grandchildren9 8.6% Not responsible for grandchildrenWhite alone, not Hispanic / Latino 24 38.2% Responsible for grandchildren39 61.8% Not responsible for grandchildrenHispanic or Latino 137 75.4% Responsible for grandchildren45 24.6% Not responsible for grandchildrenGrandparents (60 years and over) White / Caucasian 61 22.9% Responsible for grandchildren207 77.1% Not responsible for grandchildrenBlack or African American 21 32.2% Responsible for grandchildren45 67.8% Not responsible for grandchildrenTwo or more races 25 32.6% Responsible for grandchildren51 67.4% Not responsible for grandchildrenWhite alone, not Hispanic / Latino 75 29.3% Responsible for grandchildren182 70.7% Not responsible for grandchildrenHispanic or Latino 17 7.9% Responsible for grandchildren197 92.1% Not responsible for grandchildren