Races in Pittsfield, Massachusetts (MA) Detailed Stats
Data:
Races - White alone (%)
Races - White alone (% change since 2000)
Races - Black alone (%)
Races - Black alone (% change since 2000)
Races - American Indian alone (%)
Races - American Indian alone (% change since 2000)
Races - Asian alone (%)
Races - Asian alone (% change since 2000)
Races - Hispanic (%)
Races - Hispanic (% change since 2000)
Races - Native Hawaiian and Other Pacific Islander alone (%)
Races - Native Hawaiian and Other Pacific Islander alone (% change since 2000)
Races - Two or more races(%)
Races - Two or more races(% change since 2000)
Races - Other race alone (%)
Races - Other race alone (% change since 2000)
Racial diversity
Place of birth - Born in state of residence (%)
Place of birth - Born in state of residence (%) - White
Place of birth - Born in state of residence (%) - Black or African American
Place of birth - Born in state of residence (%) - Asian
Place of birth - Born in state of residence (%) - Hispanic or Latino
Place of birth - Born in state of residence (%) - American Indian and Alaska Native
Place of birth - Born in state of residence (%) - Multirace
Place of birth - Born in state of residence (%) - Other Race
Place of birth - Born in other state (%)
Place of birth - Born in other state (%) - White
Place of birth - Born in other state (%) - Black or African American
Place of birth - Born in other state (%) - Asian
Place of birth - Born in other state (%) - Hispanic or Latino
Place of birth - Born in other state (%) - American Indian and Alaska Native
Place of birth - Born in other state (%) - Multirace
Place of birth - Born in other state (%) - Other Race
Place of birth - Native, outside of US (%)
Place of birth - Native, outside of US (%) - White
Place of birth - Native, outside of US (%) - Black or African American
Place of birth - Native, outside of US (%) - Asian
Place of birth - Native, outside of US (%) - Hispanic or Latino
Place of birth - Native, outside of US (%) - American Indian and Alaska Native
Place of birth - Native, outside of US (%) - Multirace
Place of birth - Native, outside of US (%) - Other Race
Place of birth - Foreign born (%)
Place of birth - Foreign born (%) - White
Place of birth - Foreign born (%) - Black or African American
Place of birth - Foreign born (%) - Asian
Place of birth - Foreign born (%) - Hispanic or Latino
Place of birth - Foreign born (%) - American Indian and Alaska Native
Place of birth - Foreign born (%) - Multirace
Place of birth - Foreign born (%) - Other Race
Residents speaking English at home (%)
Residents speaking English at home - Born in the United States (%)
Residents speaking English at home - Native, born elsewhere (%)
Residents speaking English at home - Foreign born (%)
Residents speaking Spanish at home (%)
Residents speaking Spanish at home - Born in the United States (%)
Residents speaking Spanish at home - Native, born elsewhere (%)
Residents speaking Spanish at home - Foreign born (%)
Residents speaking other language at home (%)
Residents speaking other language at home - Born in the United States (%)
Residents speaking other language at home - Native, born elsewhere (%)
Residents speaking other language at home - Foreign born (%)
Marital status - Never married (%)
Marital status - Now married (%)
Marital status - Separated (%)
Marital status - Widowed (%)
Marital status - Divorced (%)
Ancestries Reported - Arab (%)
Ancestries Reported - Czech (%)
Ancestries Reported - Danish (%)
Ancestries Reported - Dutch (%)
Ancestries Reported - English (%)
Ancestries Reported - French (%)
Ancestries Reported - French Canadian (%)
Ancestries Reported - German (%)
Ancestries Reported - Greek (%)
Ancestries Reported - Hungarian (%)
Ancestries Reported - Irish (%)
Ancestries Reported - Italian (%)
Ancestries Reported - Lithuanian (%)
Ancestries Reported - Norwegian (%)
Ancestries Reported - Polish (%)
Ancestries Reported - Portuguese (%)
Ancestries Reported - Russian (%)
Ancestries Reported - Scotch-Irish (%)
Ancestries Reported - Scottish (%)
Ancestries Reported - Slovak (%)
Ancestries Reported - Subsaharan African (%)
Ancestries Reported - Swedish (%)
Ancestries Reported - Swiss (%)
Ancestries Reported - Ukrainian (%)
Ancestries Reported - United States (%)
Ancestries Reported - Welsh (%)
Ancestries Reported - West Indian (%)
Ancestries Reported - Other (%)
Geographical mobility - Same house 1 year ago (%)
Geographical mobility - Same house 1 year ago (%) - White
Geographical mobility - Same house 1 year ago (%) - Black or African American
Geographical mobility - Same house 1 year ago (%) - Asian
Geographical mobility - Same house 1 year ago (%) - Hispanic or Latino
Geographical mobility - Same house 1 year ago (%) - American Indian and Alaska Native
Geographical mobility - Same house 1 year ago (%) - Multirace
Geographical mobility - Same house 1 year ago (%) - Other Race
Geographical mobility - Moved within same county (%)
Geographical mobility - Moved within same county (%) - White
Geographical mobility - Moved within same county (%) - Black or African American
Geographical mobility - Moved within same county (%) - Asian
Geographical mobility - Moved within same county (%) - Hispanic or Latino
Geographical mobility - Moved within same county (%) - American Indian and Alaska Native
Geographical mobility - Moved within same county (%) - Multirace
Geographical mobility - Moved within same county (%) - Other Race
Geographical mobility - Moved from different county within same state (%)
Geographical mobility - Moved from different county within same state (%) - White
Geographical mobility - Moved from different county within same state (%) - Black or African American
Geographical mobility - Moved from different county within same state (%) - Asian
Geographical mobility - Moved from different county within same state (%) - Hispanic or Latino
Geographical mobility - Moved from different county within same state (%) - American Indian and Alaska Native
Geographical mobility - Moved from different county within same state (%) - Multirace
Geographical mobility - Moved from different county within same state (%) - Other Race
Geographical mobility - Moved from different state (%)
Geographical mobility - Moved from different state (%) - White
Geographical mobility - Moved from different state (%) - Black or African American
Geographical mobility - Moved from different state (%) - Asian
Geographical mobility - Moved from different state (%) - Hispanic or Latino
Geographical mobility - Moved from different state (%) - American Indian and Alaska Native
Geographical mobility - Moved from different state (%) - Multirace
Geographical mobility - Moved from different state (%) - Other Race
Geographical mobility - Moved from abroad (%)
Geographical mobility - Moved from abroad (%) - White
Geographical mobility - Moved from abroad (%) - Black or African American
Geographical mobility - Moved from abroad (%) - Asian
Geographical mobility - Moved from abroad (%) - Hispanic or Latino
Geographical mobility - Moved from abroad (%) - American Indian and Alaska Native
Geographical mobility - Moved from abroad (%) - Multirace
Geographical mobility - Moved from abroad (%) - Other Race
Place of birth for the foreign-born population - Ireland (%)
Place of birth for the foreign-born population - Denmark (%)
Place of birth for the foreign-born population - Norway (%)
Place of birth for the foreign-born population - Sweden (%)
Place of birth for the foreign-born population - United Kingdom (%)
Place of birth for the foreign-born population - England (%)
Place of birth for the foreign-born population - Scotland (%)
Place of birth for the foreign-born population - Other Northern Europe (%)
Place of birth for the foreign-born population - Austria (%)
Place of birth for the foreign-born population - Belgium (%)
Place of birth for the foreign-born population - France (%)
Place of birth for the foreign-born population - Germany (%)
Place of birth for the foreign-born population - Netherlands (%)
Place of birth for the foreign-born population - Switzerland (%)
Place of birth for the foreign-born population - Other Western Europe (%)
Place of birth for the foreign-born population - Greece (%)
Place of birth for the foreign-born population - Italy (%)
Place of birth for the foreign-born population - Portugal (%)
Place of birth for the foreign-born population - Spain (%)
Place of birth for the foreign-born population - Other Southern Europe (%)
Place of birth for the foreign-born population - Albania (%)
Place of birth for the foreign-born population - Belarus (%)
Place of birth for the foreign-born population - Bosnia and Herzegovina (%)
Place of birth for the foreign-born population - Bulgaria (%)
Place of birth for the foreign-born population - Croatia (%)
Place of birth for the foreign-born population - Czechoslovakia (%)
Place of birth for the foreign-born population - Hungary (%)
Place of birth for the foreign-born population - Latvia (%)
Place of birth for the foreign-born population - Lithuania (%)
Place of birth for the foreign-born population - North Macedonia (Macedonia) (%)
Place of birth for the foreign-born population - Moldova (%)
Place of birth for the foreign-born population - Poland (%)
Place of birth for the foreign-born population - Romania (%)
Place of birth for the foreign-born population - Russia (%)
Place of birth for the foreign-born population - Serbia (%)
Place of birth for the foreign-born population - Ukraine (%)
Place of birth for the foreign-born population - Other Eastern Europe (%)
Place of birth for the foreign-born population - China (%)
Place of birth for the foreign-born population - Hong Kong (%)
Place of birth for the foreign-born population - Taiwan (%)
Place of birth for the foreign-born population - Japan (%)
Place of birth for the foreign-born population - Korea (%)
Place of birth for the foreign-born population - Other Eastern Asia (%)
Place of birth for the foreign-born population - Afghanistan (%)
Place of birth for the foreign-born population - Bangladesh (%)
Place of birth for the foreign-born population - India (%)
Place of birth for the foreign-born population - Iran (%)
Place of birth for the foreign-born population - Kazakhstan (%)
Place of birth for the foreign-born population - Nepal (%)
Place of birth for the foreign-born population - Pakistan (%)
Place of birth for the foreign-born population - Sri Lanka (%)
Place of birth for the foreign-born population - Uzbekistan (%)
Place of birth for the foreign-born population - Other South Central Asia (%)
Place of birth for the foreign-born population - Burma (%)
Place of birth for the foreign-born population - Cambodia (%)
Place of birth for the foreign-born population - Indonesia (%)
Place of birth for the foreign-born population - Laos (%)
Place of birth for the foreign-born population - Malaysia (%)
Place of birth for the foreign-born population - Philippines (%)
Place of birth for the foreign-born population - Singapore (%)
Place of birth for the foreign-born population - Thailand (%)
Place of birth for the foreign-born population - Vietnam (%)
Place of birth for the foreign-born population - Other South Eastern Asia (%)
Place of birth for the foreign-born population - Armenia (%)
Place of birth for the foreign-born population - Iraq (%)
Place of birth for the foreign-born population - Israel (%)
Place of birth for the foreign-born population - Jordan (%)
Place of birth for the foreign-born population - Kuwait (%)
Place of birth for the foreign-born population - Lebanon (%)
Place of birth for the foreign-born population - Saudi Arabia (%)
Place of birth for the foreign-born population - Syria (%)
Place of birth for the foreign-born population - Turkey (%)
Place of birth for the foreign-born population - Yemen (%)
Place of birth for the foreign-born population - Other Western Asia (%)
Place of birth for the foreign-born population - Eritrea (%)
Place of birth for the foreign-born population - Ethiopia (%)
Place of birth for the foreign-born population - Kenya (%)
Place of birth for the foreign-born population - Somalia (%)
Place of birth for the foreign-born population - Uganda (%)
Place of birth for the foreign-born population - Zimbabwe (%)
Place of birth for the foreign-born population - Other Eastern Africa (%)
Place of birth for the foreign-born population - Cameroon (%)
Place of birth for the foreign-born population - Congo (%)
Place of birth for the foreign-born population - Democratic Republic of Congo (Zaire) (%)
Place of birth for the foreign-born population - Other Middle Africa (%)
Place of birth for the foreign-born population - Egypt (%)
Place of birth for the foreign-born population - Morocco (%)
Place of birth for the foreign-born population - Sudan (%)
Place of birth for the foreign-born population - Other Northern Africa (%)
Place of birth for the foreign-born population - South Africa (%)
Place of birth for the foreign-born population - Other Southern Africa (%)
Place of birth for the foreign-born population - Cabo Verde (%)
Place of birth for the foreign-born population - Ghana (%)
Place of birth for the foreign-born population - Liberia (%)
Place of birth for the foreign-born population - Nigeria (%)
Place of birth for the foreign-born population - Senegal (%)
Place of birth for the foreign-born population - Sierra Leone (%)
Place of birth for the foreign-born population - Other Western Africa (%)
Place of birth for the foreign-born population - Australia (%)
Place of birth for the foreign-born population - New Zealand (%)
Place of birth for the foreign-born population - Fiji (%)
Place of birth for the foreign-born population - Micronesia (%)
Place of birth for the foreign-born population - Bahamas (%)
Place of birth for the foreign-born population - Barbados (%)
Place of birth for the foreign-born population - Cuba (%)
Place of birth for the foreign-born population - Dominica (%)
Place of birth for the foreign-born population - Dominican Republic (%)
Place of birth for the foreign-born population - Grenada (%)
Place of birth for the foreign-born population - Haiti (%)
Place of birth for the foreign-born population - Jamaica (%)
Place of birth for the foreign-born population - St. Vincent and the Grenadines (%)
Place of birth for the foreign-born population - Trinidad and Tobago (%)
Place of birth for the foreign-born population - West Indies (%)
Place of birth for the foreign-born population - Other Caribbean (%)
Place of birth for the foreign-born population - Belize (%)
Place of birth for the foreign-born population - Costa Rica (%)
Place of birth for the foreign-born population - El Salvador (%)
Place of birth for the foreign-born population - Guatemala (%)
Place of birth for the foreign-born population - Honduras (%)
Place of birth for the foreign-born population - Mexico (%)
Place of birth for the foreign-born population - Nicaragua (%)
Place of birth for the foreign-born population - Panama (%)
Place of birth for the foreign-born population - Other Central America (%)
Place of birth for the foreign-born population - Argentina (%)
Place of birth for the foreign-born population - Bolivia (%)
Place of birth for the foreign-born population - Brazil (%)
Place of birth for the foreign-born population - Chile (%)
Place of birth for the foreign-born population - Colombia (%)
Place of birth for the foreign-born population - Ecuador (%)
Place of birth for the foreign-born population - Guyana (%)
Place of birth for the foreign-born population - Peru (%)
Place of birth for the foreign-born population - Uruguay (%)
Place of birth for the foreign-born population - Venezuela (%)
Place of birth for the foreign-born population - Other South America (%)
Place of birth for the foreign-born population - Canada (%)
Place of birth for the foreign-born population - Other Northern America (%)
Place of birth for the foreign-born population - Other (%)
Latest news about races in Pittsfield, MA collected exclusively by city-data.com from local newspapers, TV, and radio stations
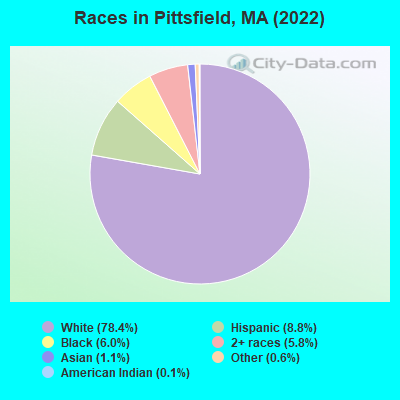
According to 2022 data, the most numerous races in Pittsfield, MA are White alone (34,054 residents), Hispanic (3,834 residents), and Asian alone (458 residents). 90.8% of Pittsfield residents speak English at home. 7.1% of Pittsfield, MA residents are foreign-born (2.0% born in Europe, 1.9% born in Latin America, 1.7% born in Africa, 0.8% born in Asia), which is 155.3% less than the foreign-born rate of 18.0% across the entire state of Massachusetts.
Race distribution in Pittsfield
2000 2022
5,198,359 81.9% White alone 428,729 6.8% Hispanic 318,329 5.0% Black alone 236,786 3.7% Asian alone 110,338 1.7% Two or more races 43,586 0.7% Other race alone 11,264 0.2% American Indian alone 1,706 0.03% Native Hawaiian and Other
4,676,627 67.0% White alone 911,038 13.0% Hispanic 501,463 7.2% Asian alone 459,740 6.6% Black alone 341,889 4.9% Two or more races 84,403 1.2% Other race alone 5,838 0.08% American Indian alone 976 0.01% Native Hawaiian and Other
Income and house value in Pittsfield Median household income in 2022 $75,237 White non-Hispanic householders$37,824 Black householders$121,335 American Indian and Alaska Native householders$124,709 Asian householders$40,852 Some other race householders$92,482 Two or more races householders$41,640 Hispanic or Latino race householdersMedian 2022 house value $261,736 White Non-Hispanic householders$173,629 Black or African American householders$290,675 American Indian or Alaska Native householders $403,844 Asian householders$203,601 Some other race householders$253,468 Two or more races householders$228,147 Hispanic or Latino householders
Median age by race in Pittsfield
48.7 Median age for White residents46.3 50.5 43.0 Median age for Black or African American residents52.6 33.8 61.3 Median age for American Indian / Alaska Native residents59.8 -657,223,795.4 62.6 Median age for Asian residents69.7 56.9 -514,227,641.8 Median age for Native Hawaiian / Pacific Islander residents-666,666,666.0 -666,666,666.0 29.1 Median age for Other race residents34.4 18.1 29.2 Median age for Two or more races residents23.5 32.2 49.5 Median age for White alone residents47.6 51.7 29.1 Median age for Hispanic or Latino residents29.0 29.4
Owner/renter occupied households by race in Pittsfield
House owners and renters - White residents 11,265 64.9% Owner occupied6,085 35.1% Renter occupiedHouse owners and renters - Black or African American residents 130 9.7% Owner occupied1,206 90.3% Renter occupiedHouse owners and renters - American Indian / Alaska Native residents 71 77.3% Owner occupied21 22.7% Renter occupiedHouse owners and renters - Asian residents 202 64.7% Owner occupied110 35.3% Renter occupiedHouse owners and renters - Other race residents 235 63.5% Owner occupied136 36.5% Renter occupiedHouse owners and renters - Two or more races residents 405 50.7% Owner occupied394 49.3% Renter occupiedHouse owners and renters - White alone residents 11,155 65.7% Owner occupied5,834 34.3% Renter occupiedHouse owners and renters - Hispanic or Latino residents 493 45.5% Owner occupied592 54.5% Renter occupied
Language usage in Pittsfield
English speakers - Total 90.8% of residents of Pittsfield speak English at home.
5.7% of residents speak Spanish at home 1,106 47.4% Speak English very well1,228 52.6% Speak English less than very well3.8% of residents speak other language at home 1,227 78.0% Speak English very well346 22.0% Speak English less than very well
English speakers - Born in the United States 94.9% of residents of Pittsfield speak English at home.
3.4% of residents speak Spanish at home 311 87.4% Speak English very well45 12.6% Speak English less than very well1.1% of residents speak other language at home 120 100.0% Speak English very well
English speakers - Native, born elsewhere 20.7% of residents of Pittsfield speak English at home.
83.2% of residents speak Spanish at home 243 42.2% Speak English very well333 57.8% Speak English less than very well3.0% of residents speak other language at home 21 100.0% Speak English very well
English speakers - Foreign-born 35.3% of residents of Pittsfield speak English at home.
27.2% of residents speak Spanish at home 245 27.5% Speak English very well646 72.5% Speak English less than very well40.1% of residents speak other language at home 956 72.8% Speak English very well358 27.2% Speak English less than very well
White (Caucasian) - Speak only English Native:
97.7% (31,741)Foreign-born:
42.1% (512)
White (Caucasian) - Speak another language Native:
2.3% (735)Foreign-born:
58.5% (711)
Black or African American - Speak only English Native:
93.0% (1,572)Foreign-born:
38.4% (263)
Black or African American - Speak another language Native:
7.8% (131)Foreign-born:
62.2% (425)
American Indian / Alaska Native - Speak another language Native:
38.6% (11)Foreign-born:
100.0% (78)
Asian - Speak only English Native:
76.1% (114)Foreign-born:
14.5% (45)
Asian - Speak another language Native:
26.0% (39)Foreign-born:
87.3% (270)
Other race - Speak only English Native:
44.8% (406)Foreign-born:
25.1% (128)
Other race - Speak another language Native:
56.3% (510)Foreign-born:
77.1% (393)
Two or more races - Speak only English Native:
84.5% (2,916)Foreign-born:
17.0% (65)
Two or more races - Speak another language Native:
12.6% (434)Foreign-born:
83.1% (316)
White alone - Speak only English Native:
99.1% (31,311)Foreign-born:
47.3% (526)
White alone - Speak another language Native:
1.0% (317)Foreign-born:
53.3% (592)
Hispanic or Latino - Speak only English Native:
43.4% (1,087)Foreign-born:
15.1% (135)
Hispanic or Latino - Speak another language Native:
58.8% (1,473)Foreign-born:
84.0% (755)
Foreign-born residents in Pittsfield 3,062 residents are foreign born (2.0% Europe , 1.9% Latin America , 1.7% Africa , 0.8% Asia ).
This city:
7.1%Massachusetts:
17.6%
Marital status for residents in Pittsfield Marital status - White (Caucasian) population 15 years and over
Males 38.6% Never married46.0% Now married1.4% Separated3.4% Widowed10.5% DivorcedFemales 32.0% Never married42.9% Now married1.9% Separated9.6% Widowed13.6% DivorcedWomen who gave birth in the past 12 months Now married:
81.3% (278)Unmarried:
18.7% (64)
Women who did not give birth in the past 12 months Now married:
32.9% (2,249)Unmarried:
67.1% (4,587)
Marital status - Black or African American population 15 years and over
Males 60.0% Never married31.3% Now married1.6% Separated1.9% Widowed5.3% DivorcedFemales 42.8% Never married31.0% Now married9.5% Separated7.0% Widowed9.8% DivorcedWomen who did not give birth in the past 12 months Now married:
38.4% (172)Unmarried:
61.6% (277)
Marital status - Asian population 15 years and over
Males 12.2% Never married82.7% Now married0.0% Separated0.0% Widowed5.1% DivorcedFemales 31.6% Never married35.2% Now married0.0% Separated9.4% Widowed23.8% DivorcedWomen who did not give birth in the past 12 months Now married:
26.9% (48)Unmarried:
73.1% (132)
Marital status - Other race population 15 years and over
Males 51.7% Never married37.4% Now married0.0% Separated0.0% Widowed10.9% DivorcedFemales 43.2% Never married21.1% Now married0.0% Separated0.0% Widowed35.7% DivorcedWomen who gave birth in the past 12 months Now married:
85.2% (63)Unmarried:
14.8% (11)
Women who did not give birth in the past 12 months Now married:
13.9% (39)Unmarried:
86.1% (241)
Marital status - Two or more races population 15 years and over
Males 59.2% Never married39.6% Now married0.0% Separated0.0% Widowed1.3% DivorcedFemales 54.9% Never married32.7% Now married0.9% Separated0.7% Widowed10.8% DivorcedWomen who gave birth in the past 12 months Now married:
0.0% (0)Unmarried:
100.0% (9)
Women who did not give birth in the past 12 months Now married:
24.4% (342)Unmarried:
75.6% (1,062)
Marital status - White alone, not Hispanic / Latino population 15 years and over
Males 37.9% Never married46.3% Now married1.5% Separated3.4% Widowed10.9% DivorcedFemales 31.7% Never married43.2% Now married1.9% Separated9.8% Widowed13.4% DivorcedWomen who gave birth in the past 12 months Now married:
78.6% (237)Unmarried:
21.4% (65)
Women who did not give birth in the past 12 months Now married:
33.5% (2,216)Unmarried:
66.5% (4,401)
Marital status - Hispanic or Latino population 15 years and over
Males 54.4% Never married37.7% Now married0.0% Separated0.6% Widowed7.4% DivorcedFemales 49.1% Never married35.4% Now married0.0% Separated0.0% Widowed15.5% DivorcedWomen who gave birth in the past 12 months Now married:
91.5% (100)Unmarried:
8.5% (9)
Women who did not give birth in the past 12 months Now married:
23.3% (221)Unmarried:
76.7% (724)
Ancestries in Pittsfield
2,686 14.6% Italian2,340 12.8% Irish1,875 10.2% American1,366 7.4% English822 4.5% German659 3.6% Polish511 2.8% French Canadian381 2.1% French229 1.2% African198 1.1% European195 1.1% Greek169 0.9% Scottish150 0.8% Eastern European140 0.8% Ghanaian106 0.6% Russian75 0.4% Scotch-Irish59 0.3% British51 0.3% Northern European47 0.3% Portuguese42 0.2% Slovak40 0.2% Canadian37 0.2% Czech35 0.2% Serbian32 0.2% South African31 0.2% Danish31 0.2% Welsh30 0.2% Swedish29 0.2% Trinidadian and Tobagonian28 0.2% Czechoslovakian26 0.1% Ukrainian25 0.1% Romanian22 0.1% Finnish19 0.1% Moroccan17 0.09% Austrian16 0.09% Cape Verdean15 0.08% Dutch13 0.07% Swiss12 0.07% Lebanese12 0.07% Turkish6 0.03% Cajun4 0.02% Scandinavian2 0.01% Armenian
Geographical mobility in Pittsfield Same house 1 year ago 31,854 90.8% White (Caucasian)2,147 84.4% Black or African American94 100.0% American Indian / Alaska Native545 94.9% Asian13 100.0% Native Hawaiian / Pacific Islander1,697 95.8% Other race4,098 92.6% Two or more races31,253 92.3% White alone, not Hispanic / Latino2,919 76.9% Hispanic or LatinoMoved within same county 1,512 4.3% White / Caucasian316 12.4% Black or African American16 2.8% Asian46 2.6% Other race280 6.3% Two or more races1,441 4.3% White alone, not Hispanic / Latino345 9.1% Hispanic or LatinoMoved within same state 398 1.1% White / Caucasian48 1.9% Black or African American77 4.4% Other race11 0.3% Two or more races287 0.8% White alone, not Hispanic / Latino155 4.1% Hispanic or LatinoMoved from different state 1,244 3.5% White / Caucasian10 1.7% Asian3 0.2% Other race7 0.2% Two or more races861 2.5% White alone, not Hispanic / Latino243 6.4% Hispanic or LatinoMoved from abroad 82 0.2% White12 0.7% Other race82 0.2% White alone, not Hispanic / Latino12 0.3% Hispanic or Latino
Children Nativity (place of birth) in Pittsfield
Children under 6 years - Living with two parents Both parents native 1,348 100.0% NativeBoth parents foreign-born 120 100.0% NativeOne native, one foreign-born parent 126 100.0% NativeChildren under 6 years - Living with one parent Native parent 908 100.0% NativeForeign-born parent 23 100.0% NativeChildren 6 to 17 years - Living with two parents Both parents native 1,618 99.7% Native5 0.3% Foreign-bornBoth parents foreign-born 92 66.0% Native47 34.0% Foreign-bornOne native, one foreign-born parent 207 100.0% NativeChildren 6 to 17 years - Living with one parent Native parent 2,404 100.0% NativeForeign-born parent 367 51.9% Native340 48.1% Foreign-born
Grandparents responsible for own grandchildren in Pittsfield
Grandparents (30 to 59 years) White / Caucasian 99 69.5% Responsible for grandchildren43 30.5% Not responsible for grandchildrenBlack or African American 18 100.0% Responsible for grandchildrenOther race 18 100.0% Responsible for grandchildrenTwo or more races 23 100.0% Responsible for grandchildrenWhite alone, not Hispanic / Latino 86 64.1% Responsible for grandchildren48 35.9% Not responsible for grandchildrenHispanic or Latino 41 100.0% Responsible for grandchildrenGrandparents (60 years and over) White / Caucasian 117 43.6% Responsible for grandchildren151 56.4% Not responsible for grandchildrenBlack or African American 51 100.0% Not responsible for grandchildrenTwo or more races 22 100.0% Not responsible for grandchildrenWhite alone, not Hispanic / Latino 120 43.7% Responsible for grandchildren155 56.3% Not responsible for grandchildren