Races in Pine Hills, Florida (FL) Detailed Stats
Data:
Races - White alone (%)
Races - White alone (% change since 2000)
Races - Black alone (%)
Races - Black alone (% change since 2000)
Races - American Indian alone (%)
Races - American Indian alone (% change since 2000)
Races - Asian alone (%)
Races - Asian alone (% change since 2000)
Races - Hispanic (%)
Races - Hispanic (% change since 2000)
Races - Native Hawaiian and Other Pacific Islander alone (%)
Races - Native Hawaiian and Other Pacific Islander alone (% change since 2000)
Races - Two or more races(%)
Races - Two or more races(% change since 2000)
Races - Other race alone (%)
Races - Other race alone (% change since 2000)
Racial diversity
Place of birth - Born in state of residence (%)
Place of birth - Born in state of residence (%) - White
Place of birth - Born in state of residence (%) - Black or African American
Place of birth - Born in state of residence (%) - Asian
Place of birth - Born in state of residence (%) - Hispanic or Latino
Place of birth - Born in state of residence (%) - American Indian and Alaska Native
Place of birth - Born in state of residence (%) - Multirace
Place of birth - Born in state of residence (%) - Other Race
Place of birth - Born in other state (%)
Place of birth - Born in other state (%) - White
Place of birth - Born in other state (%) - Black or African American
Place of birth - Born in other state (%) - Asian
Place of birth - Born in other state (%) - Hispanic or Latino
Place of birth - Born in other state (%) - American Indian and Alaska Native
Place of birth - Born in other state (%) - Multirace
Place of birth - Born in other state (%) - Other Race
Place of birth - Native, outside of US (%)
Place of birth - Native, outside of US (%) - White
Place of birth - Native, outside of US (%) - Black or African American
Place of birth - Native, outside of US (%) - Asian
Place of birth - Native, outside of US (%) - Hispanic or Latino
Place of birth - Native, outside of US (%) - American Indian and Alaska Native
Place of birth - Native, outside of US (%) - Multirace
Place of birth - Native, outside of US (%) - Other Race
Place of birth - Foreign born (%)
Place of birth - Foreign born (%) - White
Place of birth - Foreign born (%) - Black or African American
Place of birth - Foreign born (%) - Asian
Place of birth - Foreign born (%) - Hispanic or Latino
Place of birth - Foreign born (%) - American Indian and Alaska Native
Place of birth - Foreign born (%) - Multirace
Place of birth - Foreign born (%) - Other Race
Residents speaking English at home (%)
Residents speaking English at home - Born in the United States (%)
Residents speaking English at home - Native, born elsewhere (%)
Residents speaking English at home - Foreign born (%)
Residents speaking Spanish at home (%)
Residents speaking Spanish at home - Born in the United States (%)
Residents speaking Spanish at home - Native, born elsewhere (%)
Residents speaking Spanish at home - Foreign born (%)
Residents speaking other language at home (%)
Residents speaking other language at home - Born in the United States (%)
Residents speaking other language at home - Native, born elsewhere (%)
Residents speaking other language at home - Foreign born (%)
Marital status - Never married (%)
Marital status - Now married (%)
Marital status - Separated (%)
Marital status - Widowed (%)
Marital status - Divorced (%)
Ancestries Reported - Arab (%)
Ancestries Reported - Czech (%)
Ancestries Reported - Danish (%)
Ancestries Reported - Dutch (%)
Ancestries Reported - English (%)
Ancestries Reported - French (%)
Ancestries Reported - French Canadian (%)
Ancestries Reported - German (%)
Ancestries Reported - Greek (%)
Ancestries Reported - Hungarian (%)
Ancestries Reported - Irish (%)
Ancestries Reported - Italian (%)
Ancestries Reported - Lithuanian (%)
Ancestries Reported - Norwegian (%)
Ancestries Reported - Polish (%)
Ancestries Reported - Portuguese (%)
Ancestries Reported - Russian (%)
Ancestries Reported - Scotch-Irish (%)
Ancestries Reported - Scottish (%)
Ancestries Reported - Slovak (%)
Ancestries Reported - Subsaharan African (%)
Ancestries Reported - Swedish (%)
Ancestries Reported - Swiss (%)
Ancestries Reported - Ukrainian (%)
Ancestries Reported - United States (%)
Ancestries Reported - Welsh (%)
Ancestries Reported - West Indian (%)
Ancestries Reported - Other (%)
Geographical mobility - Same house 1 year ago (%)
Geographical mobility - Same house 1 year ago (%) - White
Geographical mobility - Same house 1 year ago (%) - Black or African American
Geographical mobility - Same house 1 year ago (%) - Asian
Geographical mobility - Same house 1 year ago (%) - Hispanic or Latino
Geographical mobility - Same house 1 year ago (%) - American Indian and Alaska Native
Geographical mobility - Same house 1 year ago (%) - Multirace
Geographical mobility - Same house 1 year ago (%) - Other Race
Geographical mobility - Moved within same county (%)
Geographical mobility - Moved within same county (%) - White
Geographical mobility - Moved within same county (%) - Black or African American
Geographical mobility - Moved within same county (%) - Asian
Geographical mobility - Moved within same county (%) - Hispanic or Latino
Geographical mobility - Moved within same county (%) - American Indian and Alaska Native
Geographical mobility - Moved within same county (%) - Multirace
Geographical mobility - Moved within same county (%) - Other Race
Geographical mobility - Moved from different county within same state (%)
Geographical mobility - Moved from different county within same state (%) - White
Geographical mobility - Moved from different county within same state (%) - Black or African American
Geographical mobility - Moved from different county within same state (%) - Asian
Geographical mobility - Moved from different county within same state (%) - Hispanic or Latino
Geographical mobility - Moved from different county within same state (%) - American Indian and Alaska Native
Geographical mobility - Moved from different county within same state (%) - Multirace
Geographical mobility - Moved from different county within same state (%) - Other Race
Geographical mobility - Moved from different state (%)
Geographical mobility - Moved from different state (%) - White
Geographical mobility - Moved from different state (%) - Black or African American
Geographical mobility - Moved from different state (%) - Asian
Geographical mobility - Moved from different state (%) - Hispanic or Latino
Geographical mobility - Moved from different state (%) - American Indian and Alaska Native
Geographical mobility - Moved from different state (%) - Multirace
Geographical mobility - Moved from different state (%) - Other Race
Geographical mobility - Moved from abroad (%)
Geographical mobility - Moved from abroad (%) - White
Geographical mobility - Moved from abroad (%) - Black or African American
Geographical mobility - Moved from abroad (%) - Asian
Geographical mobility - Moved from abroad (%) - Hispanic or Latino
Geographical mobility - Moved from abroad (%) - American Indian and Alaska Native
Geographical mobility - Moved from abroad (%) - Multirace
Geographical mobility - Moved from abroad (%) - Other Race
Place of birth for the foreign-born population - Ireland (%)
Place of birth for the foreign-born population - Denmark (%)
Place of birth for the foreign-born population - Norway (%)
Place of birth for the foreign-born population - Sweden (%)
Place of birth for the foreign-born population - United Kingdom (%)
Place of birth for the foreign-born population - England (%)
Place of birth for the foreign-born population - Scotland (%)
Place of birth for the foreign-born population - Other Northern Europe (%)
Place of birth for the foreign-born population - Austria (%)
Place of birth for the foreign-born population - Belgium (%)
Place of birth for the foreign-born population - France (%)
Place of birth for the foreign-born population - Germany (%)
Place of birth for the foreign-born population - Netherlands (%)
Place of birth for the foreign-born population - Switzerland (%)
Place of birth for the foreign-born population - Other Western Europe (%)
Place of birth for the foreign-born population - Greece (%)
Place of birth for the foreign-born population - Italy (%)
Place of birth for the foreign-born population - Portugal (%)
Place of birth for the foreign-born population - Spain (%)
Place of birth for the foreign-born population - Other Southern Europe (%)
Place of birth for the foreign-born population - Albania (%)
Place of birth for the foreign-born population - Belarus (%)
Place of birth for the foreign-born population - Bosnia and Herzegovina (%)
Place of birth for the foreign-born population - Bulgaria (%)
Place of birth for the foreign-born population - Croatia (%)
Place of birth for the foreign-born population - Czechoslovakia (%)
Place of birth for the foreign-born population - Hungary (%)
Place of birth for the foreign-born population - Latvia (%)
Place of birth for the foreign-born population - Lithuania (%)
Place of birth for the foreign-born population - North Macedonia (Macedonia) (%)
Place of birth for the foreign-born population - Moldova (%)
Place of birth for the foreign-born population - Poland (%)
Place of birth for the foreign-born population - Romania (%)
Place of birth for the foreign-born population - Russia (%)
Place of birth for the foreign-born population - Serbia (%)
Place of birth for the foreign-born population - Ukraine (%)
Place of birth for the foreign-born population - Other Eastern Europe (%)
Place of birth for the foreign-born population - China (%)
Place of birth for the foreign-born population - Hong Kong (%)
Place of birth for the foreign-born population - Taiwan (%)
Place of birth for the foreign-born population - Japan (%)
Place of birth for the foreign-born population - Korea (%)
Place of birth for the foreign-born population - Other Eastern Asia (%)
Place of birth for the foreign-born population - Afghanistan (%)
Place of birth for the foreign-born population - Bangladesh (%)
Place of birth for the foreign-born population - India (%)
Place of birth for the foreign-born population - Iran (%)
Place of birth for the foreign-born population - Kazakhstan (%)
Place of birth for the foreign-born population - Nepal (%)
Place of birth for the foreign-born population - Pakistan (%)
Place of birth for the foreign-born population - Sri Lanka (%)
Place of birth for the foreign-born population - Uzbekistan (%)
Place of birth for the foreign-born population - Other South Central Asia (%)
Place of birth for the foreign-born population - Burma (%)
Place of birth for the foreign-born population - Cambodia (%)
Place of birth for the foreign-born population - Indonesia (%)
Place of birth for the foreign-born population - Laos (%)
Place of birth for the foreign-born population - Malaysia (%)
Place of birth for the foreign-born population - Philippines (%)
Place of birth for the foreign-born population - Singapore (%)
Place of birth for the foreign-born population - Thailand (%)
Place of birth for the foreign-born population - Vietnam (%)
Place of birth for the foreign-born population - Other South Eastern Asia (%)
Place of birth for the foreign-born population - Armenia (%)
Place of birth for the foreign-born population - Iraq (%)
Place of birth for the foreign-born population - Israel (%)
Place of birth for the foreign-born population - Jordan (%)
Place of birth for the foreign-born population - Kuwait (%)
Place of birth for the foreign-born population - Lebanon (%)
Place of birth for the foreign-born population - Saudi Arabia (%)
Place of birth for the foreign-born population - Syria (%)
Place of birth for the foreign-born population - Turkey (%)
Place of birth for the foreign-born population - Yemen (%)
Place of birth for the foreign-born population - Other Western Asia (%)
Place of birth for the foreign-born population - Eritrea (%)
Place of birth for the foreign-born population - Ethiopia (%)
Place of birth for the foreign-born population - Kenya (%)
Place of birth for the foreign-born population - Somalia (%)
Place of birth for the foreign-born population - Uganda (%)
Place of birth for the foreign-born population - Zimbabwe (%)
Place of birth for the foreign-born population - Other Eastern Africa (%)
Place of birth for the foreign-born population - Cameroon (%)
Place of birth for the foreign-born population - Congo (%)
Place of birth for the foreign-born population - Democratic Republic of Congo (Zaire) (%)
Place of birth for the foreign-born population - Other Middle Africa (%)
Place of birth for the foreign-born population - Egypt (%)
Place of birth for the foreign-born population - Morocco (%)
Place of birth for the foreign-born population - Sudan (%)
Place of birth for the foreign-born population - Other Northern Africa (%)
Place of birth for the foreign-born population - South Africa (%)
Place of birth for the foreign-born population - Other Southern Africa (%)
Place of birth for the foreign-born population - Cabo Verde (%)
Place of birth for the foreign-born population - Ghana (%)
Place of birth for the foreign-born population - Liberia (%)
Place of birth for the foreign-born population - Nigeria (%)
Place of birth for the foreign-born population - Senegal (%)
Place of birth for the foreign-born population - Sierra Leone (%)
Place of birth for the foreign-born population - Other Western Africa (%)
Place of birth for the foreign-born population - Australia (%)
Place of birth for the foreign-born population - New Zealand (%)
Place of birth for the foreign-born population - Fiji (%)
Place of birth for the foreign-born population - Micronesia (%)
Place of birth for the foreign-born population - Bahamas (%)
Place of birth for the foreign-born population - Barbados (%)
Place of birth for the foreign-born population - Cuba (%)
Place of birth for the foreign-born population - Dominica (%)
Place of birth for the foreign-born population - Dominican Republic (%)
Place of birth for the foreign-born population - Grenada (%)
Place of birth for the foreign-born population - Haiti (%)
Place of birth for the foreign-born population - Jamaica (%)
Place of birth for the foreign-born population - St. Vincent and the Grenadines (%)
Place of birth for the foreign-born population - Trinidad and Tobago (%)
Place of birth for the foreign-born population - West Indies (%)
Place of birth for the foreign-born population - Other Caribbean (%)
Place of birth for the foreign-born population - Belize (%)
Place of birth for the foreign-born population - Costa Rica (%)
Place of birth for the foreign-born population - El Salvador (%)
Place of birth for the foreign-born population - Guatemala (%)
Place of birth for the foreign-born population - Honduras (%)
Place of birth for the foreign-born population - Mexico (%)
Place of birth for the foreign-born population - Nicaragua (%)
Place of birth for the foreign-born population - Panama (%)
Place of birth for the foreign-born population - Other Central America (%)
Place of birth for the foreign-born population - Argentina (%)
Place of birth for the foreign-born population - Bolivia (%)
Place of birth for the foreign-born population - Brazil (%)
Place of birth for the foreign-born population - Chile (%)
Place of birth for the foreign-born population - Colombia (%)
Place of birth for the foreign-born population - Ecuador (%)
Place of birth for the foreign-born population - Guyana (%)
Place of birth for the foreign-born population - Peru (%)
Place of birth for the foreign-born population - Uruguay (%)
Place of birth for the foreign-born population - Venezuela (%)
Place of birth for the foreign-born population - Other South America (%)
Place of birth for the foreign-born population - Canada (%)
Place of birth for the foreign-born population - Other Northern America (%)
Place of birth for the foreign-born population - Other (%)
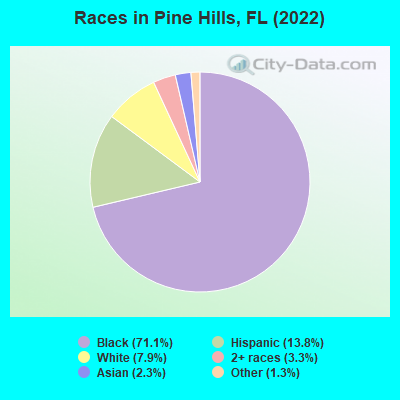
According to 2022 data, the most numerous races in Pine Hills, FL are White alone (6,680 residents), Hispanic (11,708 residents), and Black alone (60,188 residents). 63.2% of Pine Hills residents speak English at home. 34.8% of Pine Hills, FL residents are foreign-born (31.6% born in Latin America), which is 39.6% greater than the foreign-born rate of 21.0% across the entire state of Florida.
Race distribution in Pine Hills
2000 2022
21,004 50.3% Black alone 11,591 27.8% White alone 5,875 14.1% Hispanic 1,791 4.3% Two or more races 1,196 2.9% Asian alone 202 0.5% Other race alone 86 0.2% American Indian alone 19 0.05% Native Hawaiian and Other
60,188 71.1% Black alone 11,708 13.8% Hispanic 6,680 7.9% White alone 2,800 3.3% Two or more races 1,951 2.3% Asian alone 1,088 1.3% Other race alone
2000 2022
10,458,509 65.4% White alone 2,682,715 16.8% Hispanic 2,264,268 14.2% Black alone 261,693 1.6% Asian alone 236,954 1.5% Two or more races 42,358 0.3% American Indian alone 28,994 0.2% Other race alone 6,887 0.04% Native Hawaiian and Other
11,309,403 50.8% White alone 6,025,039 27.1% Hispanic 3,241,015 14.6% Black alone 861,630 3.9% Two or more races 623,692 2.8% Asian alone 152,054 0.7% Other race alone 22,504 0.1% American Indian alone 9,486 0.04% Native Hawaiian and Other
Income and house value in Pine Hills Median household income in 2022 $57,639 White non-Hispanic householders$41,880 Black householders$61,131 Asian householders$43,757 Some other race householders$39,139 Two or more races householders$43,255 Hispanic or Latino race householdersMedian 2022 house value $241,162 White Non-Hispanic householders$254,629 Black or African American householders$264,025 American Indian or Alaska Native householders $267,157 Asian householders$285,323 Native Hawaiian and other Pacific Islander householders$242,728 Some other race householders$259,641 Two or more races householders$243,041 Hispanic or Latino householders
Median age by race in Pine Hills
37.4 Median age for White residents33.3 40.9 33.7 Median age for Black or African American residents27.9 36.0 -666,666,666.0 Median age for American Indian / Alaska Native residents-666,666,666.0 -666,666,666.0 39.1 Median age for Asian residents29.7 39.6 -666,666,666.0 Median age for Native Hawaiian / Pacific Islander residents-666,666,666.0 -666,666,666.0 28.0 Median age for Other race residents29.7 27.1 50.3 Median age for Two or more races residents59.7 43.0 51.0 Median age for White alone residents52.0 50.9 34.7 Median age for Hispanic or Latino residents39.5 34.4
Owner/renter occupied households by race in Pine Hills
House owners and renters - White residents 2,324 71.5% Owner occupied927 28.5% Renter occupiedHouse owners and renters - Black or African American residents 9,625 52.0% Owner occupied8,896 48.0% Renter occupiedHouse owners and renters - American Indian / Alaska Native residents 16 7.8% Owner occupied189 92.2% Renter occupiedHouse owners and renters - Asian residents 532 93.3% Owner occupied38 6.7% Renter occupiedHouse owners and renters - Other race residents 724 48.0% Owner occupied785 52.0% Renter occupiedHouse owners and renters - Two or more races residents 427 73.4% Owner occupied155 26.6% Renter occupiedHouse owners and renters - White alone residents 1,806 69.1% Owner occupied806 30.9% Renter occupiedHouse owners and renters - Hispanic or Latino residents 1,946 56.0% Owner occupied1,532 44.0% Renter occupied
Language usage in Pine Hills
English speakers - Total 63.2% of residents of Pine Hills speak English at home.
10.9% of residents speak Spanish at home 4,181 48.9% Speak English very well4,369 51.1% Speak English less than very well27.2% of residents speak other language at home 13,346 62.7% Speak English very well7,931 37.3% Speak English less than very well
English speakers - Born in the United States 86.4% of residents of Pine Hills speak English at home.
7.5% of residents speak Spanish at home 902 76.9% Speak English very well271 23.1% Speak English less than very well5.8% of residents speak other language at home 889 97.8% Speak English very well20 2.2% Speak English less than very well
English speakers - Native, born elsewhere 58.6% of residents of Pine Hills speak English at home.
33.4% of residents speak Spanish at home 961 55.8% Speak English very well760 44.2% Speak English less than very well8.2% of residents speak other language at home 295 69.9% Speak English very well127 30.1% Speak English less than very well
English speakers - Foreign-born 34.9% of residents of Pine Hills speak English at home.
13.9% of residents speak Spanish at home 1,113 27.1% Speak English very well2,995 72.9% Speak English less than very well51.7% of residents speak other language at home 7,632 49.9% Speak English very well7,661 50.1% Speak English less than very well
White (Caucasian) - Speak only English Native:
87.3% (6,222)Foreign-born:
13.6% (118)
White (Caucasian) - Speak another language Native:
11.3% (809)Foreign-born:
85.2% (740)
Black or African American - Speak only English Native:
86.0% (26,324)Foreign-born:
58.2% (12,087)
Black or African American - Speak another language Native:
14.0% (4,270)Foreign-born:
41.8% (8,692)
American Indian / Alaska Native - Speak another language Native:
100.0% (261)Foreign-born:
93.5% (274)
Asian - Speak only English Native:
77.4% (284)Foreign-born:
33.0% (524)
Asian - Speak another language Native:
25.1% (92)Foreign-born:
67.9% (1,080)
Other race - Speak only English Native:
37.9% (1,137)Foreign-born:
7.5% (195)
Other race - Speak another language Native:
62.9% (1,888)Foreign-born:
92.5% (2,399)
Two or more races - Speak only English Native:
54.8% (2,095)Foreign-born:
54.0% (875)
Two or more races - Speak another language Native:
44.7% (1,709)Foreign-born:
44.9% (727)
White alone - Speak only English Native:
97.0% (6,001)Foreign-born:
40.1% (110)
White alone - Speak another language Native:
3.1% (193)Foreign-born:
55.2% (152)
Hispanic or Latino - Speak another language Native:
63.6% (2,229)Foreign-born:
100.0% (3,845)
Foreign-born residents in Pine Hills 29,459 residents are foreign born (31.6% Latin America ).
This city:
34.8%Florida:
21.1%
Marital status for residents in Pine Hills Marital status - White (Caucasian) population 15 years and over
Males 38.1% Never married40.8% Now married0.0% Separated2.9% Widowed18.2% DivorcedFemales 34.6% Never married38.4% Now married2.2% Separated14.8% Widowed9.9% DivorcedWomen who gave birth in the past 12 months Now married:
45.7% (56)Unmarried:
54.3% (66)
Women who did not give birth in the past 12 months Now married:
35.9% (723)Unmarried:
64.1% (1,292)
Marital status - Black or African American population 15 years and over
Males 48.0% Never married34.2% Now married3.7% Separated1.3% Widowed12.8% DivorcedFemales 46.9% Never married29.9% Now married5.1% Separated3.4% Widowed14.8% DivorcedWomen who gave birth in the past 12 months Now married:
54.4% (859)Unmarried:
45.6% (719)
Women who did not give birth in the past 12 months Now married:
23.2% (3,121)Unmarried:
76.8% (10,332)
Marital status - American Indian / Alaska Native population 15 years and over
Males 0.0% Never married100.0% Now married0.0% Separated0.0% Widowed0.0% DivorcedFemales 0.0% Never married92.1% Now married0.0% Separated0.0% Widowed7.9% DivorcedWomen who gave birth in the past 12 months Now married:
100.0% (211)Unmarried:
0.0% (0)
Women who did not give birth in the past 12 months Now married:
0.0% (0)Unmarried:
100.0% (18)
Marital status - Asian population 15 years and over
Males 24.1% Never married68.9% Now married0.0% Separated0.0% Widowed7.1% DivorcedFemales 13.3% Never married63.1% Now married0.0% Separated15.9% Widowed7.8% DivorcedWomen who did not give birth in the past 12 months Now married:
72.2% (316)Unmarried:
27.8% (122)
Marital status - Other race population 15 years and over
Males 40.9% Never married45.0% Now married7.9% Separated0.0% Widowed6.2% DivorcedFemales 35.5% Never married29.8% Now married8.7% Separated8.9% Widowed17.0% DivorcedWomen who gave birth in the past 12 months Now married:
11.0% (18)Unmarried:
89.0% (145)
Women who did not give birth in the past 12 months Now married:
38.4% (541)Unmarried:
61.6% (867)
Marital status - Two or more races population 15 years and over
Males 51.8% Never married41.3% Now married0.0% Separated1.0% Widowed5.8% DivorcedFemales 41.5% Never married27.8% Now married2.6% Separated14.5% Widowed13.5% DivorcedWomen who gave birth in the past 12 months Now married:
29.2% (30)Unmarried:
70.8% (73)
Women who did not give birth in the past 12 months Now married:
17.6% (258)Unmarried:
82.4% (1,209)
Marital status - White alone, not Hispanic / Latino population 15 years and over
Males 39.0% Never married37.7% Now married0.0% Separated3.6% Widowed19.7% DivorcedFemales 40.4% Never married31.0% Now married2.6% Separated17.3% Widowed8.7% DivorcedWomen who gave birth in the past 12 months Now married:
0.0% (0)Unmarried:
100.0% (75)
Women who did not give birth in the past 12 months Now married:
33.9% (535)Unmarried:
66.1% (1,046)
Marital status - Hispanic or Latino population 15 years and over
Males 33.7% Never married53.9% Now married5.4% Separated0.0% Widowed6.9% DivorcedFemales 20.8% Never married35.0% Now married9.5% Separated7.1% Widowed27.7% DivorcedWomen who gave birth in the past 12 months Now married:
76.4% (214)Unmarried:
23.6% (66)
Women who did not give birth in the past 12 months Now married:
34.7% (873)Unmarried:
65.3% (1,643)
Ancestries in Pine Hills
16,053 28.8% Haitian6,504 11.7% Jamaican1,786 3.2% American1,478 2.6% Guyanese1,038 1.9% African583 1.0% British West Indian454 0.8% West Indian421 0.8% Italian382 0.7% English253 0.5% German218 0.4% Nigerian218 0.4% Trinidadian and Tobagonian196 0.4% European183 0.3% Romanian176 0.3% Irish101 0.2% Brazilian75 0.1% French55 0.10% Bahamian47 0.08% Portuguese43 0.08% Polish42 0.08% Swedish37 0.07% Scotch-Irish33 0.06% Scottish31 0.06% Slovak27 0.05% Canadian21 0.04% Finnish19 0.03% British13 0.02% Eastern European11 0.02% Russian5 0.01% Austrian5 0.01% Welsh3 0.01% Dutch3 0.01% Greek
Geographical mobility in Pine Hills Same house 1 year ago 6,754 79.2% White (Caucasian)51,605 86.0% Black or African American1,116 100.0% American Indian / Alaska Native1,648 82.0% Asian5,034 81.4% Other race4,475 73.2% Two or more races5,560 83.4% White alone, not Hispanic / Latino8,743 76.4% Hispanic or LatinoMoved within same county 651 7.6% White / Caucasian5,312 8.9% Black or African American312 15.5% Asian648 10.5% Other race705 11.5% Two or more races359 5.4% White alone, not Hispanic / Latino1,242 10.8% Hispanic or LatinoMoved within same state 774 9.1% White / Caucasian1,320 2.2% Black or African American5 0.2% Asian266 4.3% Other race552 9.0% Two or more races543 8.1% White alone, not Hispanic / Latino661 5.8% Hispanic or LatinoMoved from different state 216 2.5% White / Caucasian927 1.5% Black or African American13 0.6% Asian116 1.9% Other race144 2.4% Two or more races151 2.3% White alone, not Hispanic / Latino441 3.8% Hispanic or LatinoMoved from abroad 87 1.0% White753 1.3% Black or African American121 2.0% Other race117 1.9% Two or more races26 0.4% White alone, not Hispanic / Latino301 2.6% Hispanic or Latino
Children Nativity (place of birth) in Pine Hills
Children under 6 years - Living with two parents Both parents native 192 100.0% NativeBoth parents foreign-born 807 100.0% NativeOne native, one foreign-born parent 899 100.0% NativeChildren under 6 years - Living with one parent Native parent 4,241 100.0% NativeForeign-born parent 204 100.0% Foreign-bornChildren 6 to 17 years - Living with two parents Both parents native 957 100.0% NativeBoth parents foreign-born 2,139 60.4% Native1,405 39.6% Foreign-bornOne native, one foreign-born parent 737 100.0% NativeChildren 6 to 17 years - Living with one parent Native parent 1,488 75.9% Native473 24.1% Foreign-bornForeign-born parent 3,239 70.1% Native1,383 29.9% Foreign-born
Grandparents responsible for own grandchildren in Pine Hills
Grandparents (30 to 59 years) White / Caucasian 4 15.9% Responsible for grandchildren19 84.1% Not responsible for grandchildrenBlack or African American 467 72.4% Responsible for grandchildren178 27.6% Not responsible for grandchildrenAsian 17 100.0% Not responsible for grandchildrenOther race 64 100.0% Not responsible for grandchildrenTwo or more races 124 100.0% Not responsible for grandchildrenWhite alone, not Hispanic / Latino 4 27.1% Responsible for grandchildren11 72.9% Not responsible for grandchildrenHispanic or Latino 148 100.0% Not responsible for grandchildrenGrandparents (60 years and over) White / Caucasian 3 2.6% Responsible for grandchildren117 97.4% Not responsible for grandchildrenBlack or African American 329 31.4% Responsible for grandchildren718 68.6% Not responsible for grandchildrenAsian 57 100.0% Not responsible for grandchildrenWhite alone, not Hispanic / Latino 154 100.0% Not responsible for grandchildrenHispanic or Latino 29 49.8% Responsible for grandchildren30 50.2% Not responsible for grandchildren