Races in Pimmit Hills, Virginia (VA) Detailed Stats
Ancestries, Foreign-born residents, place of birth
Settings
X


Recent posts about races in Pimmit Hills, Virginia on our local forum with over 2,400,000 registered users:
 | Thoughts on the Fairfax County Zoning Ordinance Modernization Project (ZMOD)? (53 replies) |
| Pimmit Hills Builder tearing down 22 homes (50 replies) |
| Fairfax, VA neighborhood assigned to Falls Church High? (10 replies) |
| Where should I buy a house in NOVA? (42 replies) |
| Honest assessment of Falls Church and West Falls Church (7 replies) |
| Pimmit Hills Builder (18 replies) |
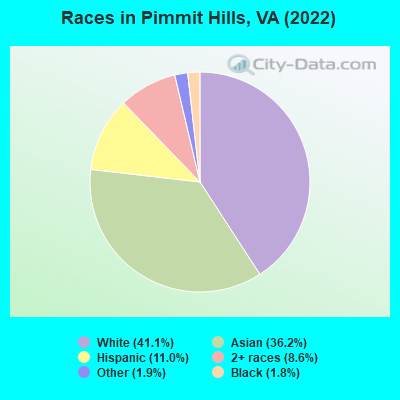
According to 2022 data, the most numerous races in Pimmit Hills, VA are White alone (2,656 residents), Black alone (119 residents), and Hispanic (709 residents). 57.5% of Pimmit Hills residents speak English at home. 43.3% of Pimmit Hills, VA residents are foreign-born (30.7% born in Asia, 8.5% born in Latin America), which is 72.3% greater than the foreign-born rate of 12.0% across the entire state of Virginia.
Race distribution in Pimmit Hills
2000
2022

- 4,03365.6%White alone
- 1,02516.7%Hispanic
- 70511.5%Asian alone
- 1943.2%Two or more races
- 1462.4%Black alone
- 220.4%Other race alone
- 180.3%American Indian alone
- 90.1%Native Hawaiian and Other
Pacific Islander alone

-
- 2,65641.1%White alone
- 2,34136.2%Asian alone
- 70911.0%Hispanic
- 5548.6%Two or more races
- 1211.9%Other race alone
- 1191.8%Black alone
2000
2022
-
- 4,965,63770.2%White alone
- 1,376,37819.4%Black alone
- 329,5404.7%Hispanic
- 259,2773.7%Asian alone
- 114,0221.6%Two or more races
- 18,5960.3%American Indian alone
- 11,6850.2%Other race alone
- 3,3800.05%Native Hawaiian and Other
Pacific Islander alone

-
- 5,095,13058.7%White alone
- 1,594,78518.4%Black alone
- 905,75010.4%Hispanic
- 602,8816.9%Asian alone
- 406,0474.7%Two or more races
- 60,4190.7%Other race alone
- 11,7380.1%American Indian alone
- 6,8690.08%Native Hawaiian and Other
Pacific Islander alone

Income and house value in Pimmit Hills
- Median household income in 2022
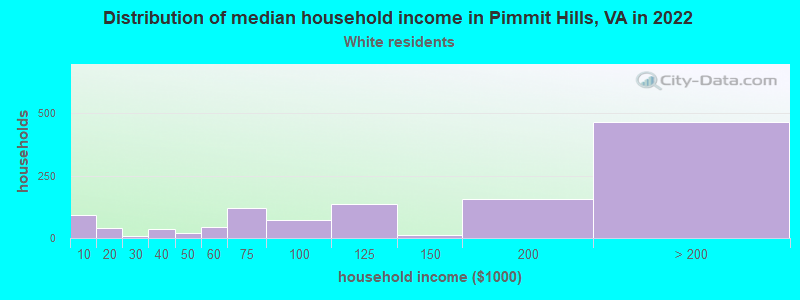
- $156,531White non-Hispanic householders
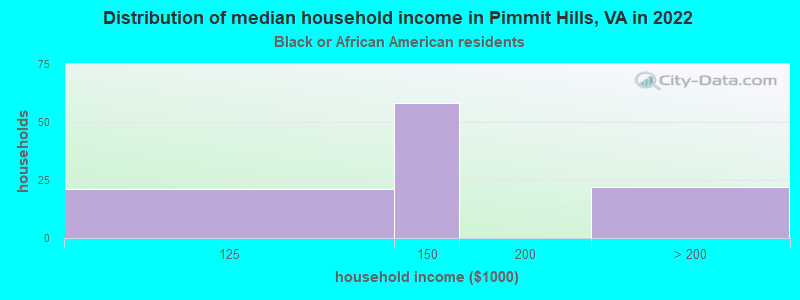
- $147,789Black householders
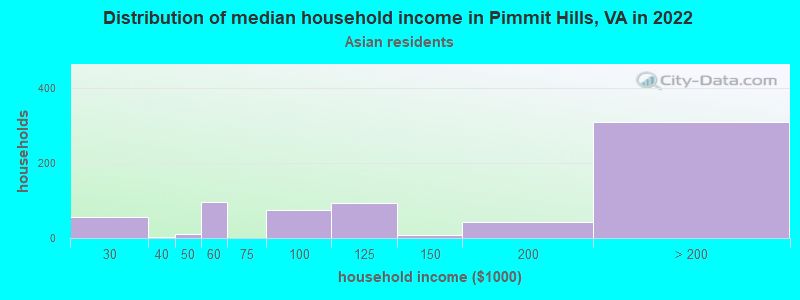
- $150,522Asian householders
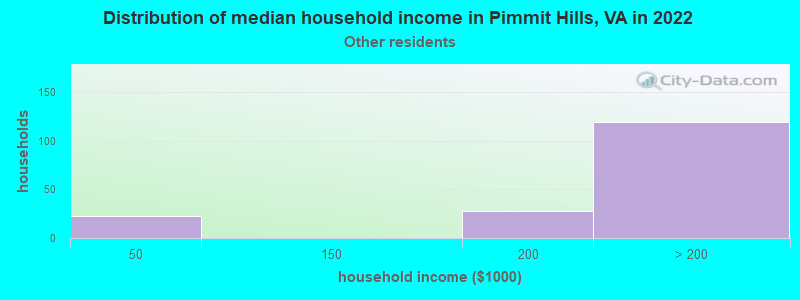
- over $200,000Some other race householders
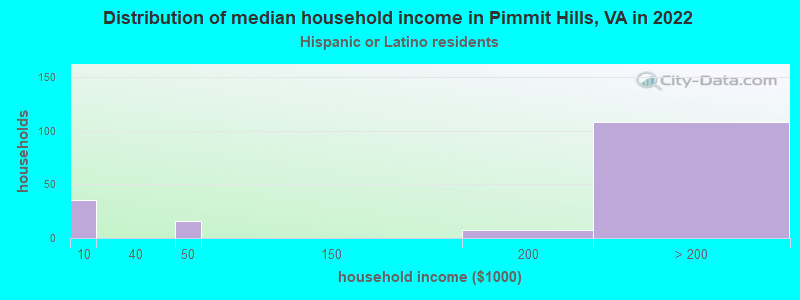
- over $200,000Hispanic or Latino race householders
- Median 2022 house value
- $911,582White Non-Hispanic householders
- over $1,000,000Black or African American householders
- $911,582Asian householders
- $890,888Some other race householders
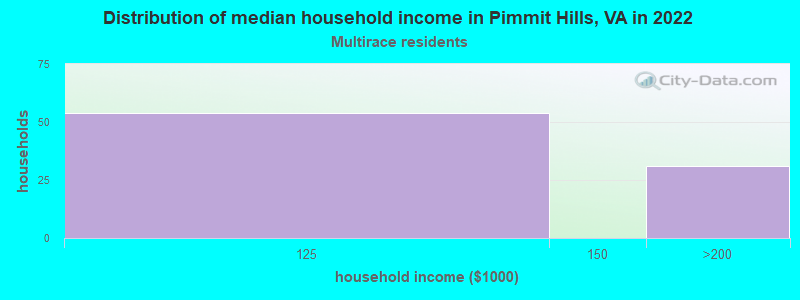
- $994,887Two or more races householders
- $901,500Hispanic or Latino householders
Household income for White non-Hispanic householders
Household income for Black householders
Household income for Asian householders
Household income for Some other race householders
Household income for Two or more races householders
Household income for Hispanic or Latino race householders
Median age by race in Pimmit Hills
- 39.4Median age for White residents
- 35.5Males
- 43.2Females
- 37.9Median age for Black or African American residents
- 57.9Males
- -696,888,888.2Females
- -754,182,753.4Median age for American Indian / Alaska Native residents
- -964,539,006.1Males
- -669,005,847.3Females
- 37.5Median age for Asian residents
- 38.6Males
- 35.7Females
- -666,666,666.0Median age for Native Hawaiian / Pacific Islander residents
- -558,791,801.0Males
- -584,518,166.9Females
- 38.6Median age for Other race residents
- 42.0Males
- 34.6Females
- 16.8Median age for Two or more races residents
- 14.7Males
- 19.4Females
- 39.1Median age for White alone residents
- 39.0Males
- 38.9Females
- 37.8Median age for Hispanic or Latino residents
- 30.0Males
- 48.9Females
Owner/renter occupied households by race in Pimmit Hills
- House owners and renters - White residents
- 81367.8%Owner occupied
- 38632.2%Renter occupied
- House owners and renters - Black or African American residents
- 1718.1%Owner occupied
- 7681.9%Renter occupied
- House owners and renters - Asian residents
- 50270.8%Owner occupied
- 20729.2%Renter occupied
- House owners and renters - Other race residents
- 11372.1%Owner occupied
- 4427.9%Renter occupied
- House owners and renters - Two or more races residents
- 5766.4%Owner occupied
- 2933.6%Renter occupied
- House owners and renters - White alone residents
- 79266.0%Owner occupied
- 40834.0%Renter occupied
- House owners and renters - Hispanic or Latino residents
- 13494.0%Owner occupied
- 86.0%Renter occupied
Language usage in Pimmit Hills
- English speakers - Total
- 57.5% of residents of Pimmit Hills speak English at home.
- 9.5% of residents speak Spanish at home
- 42274.0%Speak English very well
- 14826.0%Speak English less than very well
- 32.7% of residents speak other language at home
- 1,28465.6%Speak English very well
- 67434.4%Speak English less than very well
- English speakers - Born in the United States
- 89.0% of residents of Pimmit Hills speak English at home.
- 3.6% of residents speak Spanish at home
- 67100.0%Speak English very well
- 7.0% of residents speak other language at home
- 10580.8%Speak English very well
- 2519.2%Speak English less than very well
- English speakers - Native, born elsewhere
- 97.2% of residents of Pimmit Hills speak English at home.
- English speakers - Foreign-born
- 24.4% of residents of Pimmit Hills speak English at home.
- 15.0% of residents speak Spanish at home
- 25964.0%Speak English very well
- 14636.0%Speak English less than very well
- 61.7% of residents speak other language at home
- 1,01961.1%Speak English very well
- 65038.9%Speak English less than very well
White (Caucasian) - Speak only English
| Native: | 94.4% (2,183) |
| Foreign-born: | 37.9% (95) |
White (Caucasian) - Speak another language
| Native: | 5.8% (135) |
| Foreign-born: | 66.6% (166) |
Asian - Speak only English
| Native: | 45.7% (176) |
| Foreign-born: | 23.7% (401) |
Asian - Speak another language
| Native: | 54.6% (211) |
| Foreign-born: | 77.8% (1,317) |
Other race - Speak only English
| Native: | 19.1% (20) |
| Foreign-born: | 7.6% (41) |
Other race - Speak another language
| Native: | 73.5% (77) |
| Foreign-born: | 92.3% (502) |
Two or more races - Speak only English
| Native: | 98.2% (421) |
| Foreign-born: | 69.8% (155) |
White alone - Speak only English
| Native: | 96.9% (2,205) |
| Foreign-born: | 41.1% (103) |
White alone - Speak another language
| Native: | 3.4% (77) |
| Foreign-born: | 60.8% (152) |
Hispanic or Latino - Speak only English
| Native: | 13.7% (29) |
| Foreign-born: | 6.1% (27) |
Hispanic or Latino - Speak another language
| Native: | 80.3% (170) |
| Foreign-born: | 93.9% (417) |
Foreign-born residents in Pimmit Hills
2,800 residents are foreign born (30.7% Asia, 8.5% Latin America).
| This city: | 43.3% |
| Virginia: | 12.6% |


Marital status for residents in Pimmit Hills
Marital status - White (Caucasian) population 15 years and over
- Males
- 42.3%Never married
- 42.4%Now married
- 0.0%Separated
- 0.6%Widowed
- 14.6%Divorced
- Females
- 23.7%Never married
- 36.0%Now married
- 1.2%Separated
- 22.1%Widowed
- 17.0%Divorced
Women who did not give birth in the past 12 months
| Now married: | 50.5% (233) |
| Unmarried: | 49.5% (229) |
Marital status - Black or African American population 15 years and over
- Males
- 41.8%Never married
- 32.7%Now married
- 0.0%Separated
- 0.0%Widowed
- 25.5%Divorced
- Females
- 62.9%Never married
- 37.1%Now married
- 0.0%Separated
- 0.0%Widowed
- 0.0%Divorced
Women who did not give birth in the past 12 months
| Now married: | 0.0% (0) |
| Unmarried: | 100.0% (39) |
Marital status - Asian population 15 years and over
- Males
- 27.1%Never married
- 57.4%Now married
- 6.1%Separated
- 5.0%Widowed
- 4.4%Divorced
- Females
- 41.2%Never married
- 51.3%Now married
- 0.0%Separated
- 0.0%Widowed
- 7.4%Divorced
Women who gave birth in the past 12 months
| Now married: | 100.0% (34) |
| Unmarried: | 0.0% (0) |
Women who did not give birth in the past 12 months
| Now married: | 42.1% (302) |
| Unmarried: | 57.9% (416) |
Marital status - Other race population 15 years and over
- Males
- 56.9%Never married
- 43.1%Now married
- 0.0%Separated
- 0.0%Widowed
- 0.0%Divorced
- Females
- 56.1%Never married
- 33.2%Now married
- 0.0%Separated
- 10.7%Widowed
- 0.0%Divorced
Women who did not give birth in the past 12 months
| Now married: | 17.5% (49) |
| Unmarried: | 82.5% (232) |
Marital status - Two or more races population 15 years and over
- Males
- 61.9%Never married
- 38.1%Now married
- 0.0%Separated
- 0.0%Widowed
- 0.0%Divorced
- Females
- 57.3%Never married
- 42.7%Now married
- 0.0%Separated
- 0.0%Widowed
- 0.0%Divorced
Women who did not give birth in the past 12 months
| Now married: | 38.2% (78) |
| Unmarried: | 61.8% (126) |
Marital status - White alone, not Hispanic / Latino population 15 years and over
- Males
- 37.2%Never married
- 46.0%Now married
- 0.0%Separated
- 0.7%Widowed
- 16.1%Divorced
- Females
- 23.0%Never married
- 35.5%Now married
- 1.4%Separated
- 21.8%Widowed
- 18.4%Divorced
Women who did not give birth in the past 12 months
| Now married: | 50.5% (247) |
| Unmarried: | 49.5% (243) |
Marital status - Hispanic or Latino population 15 years and over
- Males
- 66.2%Never married
- 33.8%Now married
- 0.0%Separated
- 0.0%Widowed
- 0.0%Divorced
- Females
- 41.1%Never married
- 43.2%Now married
- 0.0%Separated
- 15.7%Widowed
- 0.0%Divorced
Women who did not give birth in the past 12 months
| Now married: | 26.4% (47) |
| Unmarried: | 73.6% (130) |
Ancestries in Pimmit Hills

- 1073.0%Italian
- 1012.8%European
- 742.1%German
- 591.6%African
- 531.5%English
- 441.2%Polish
- 391.1%American
- 361.0%Norwegian
- 351.0%Macedonian
- 351.0%Russian
- 330.9%Eastern European
- 300.8%Iranian
- 290.8%Palestinian
- 230.6%Armenian
- 180.5%Northern European
- 150.4%Danish
- 140.4%British
- 120.3%Irish
- 60.2%Lithuanian
- 60.2%Ukrainian

Geographical mobility in Pimmit Hills

- Same house 1 year ago
- 2,29286.0%White (Caucasian)
- 120100.0%Black or African American
- 1,80177.3%Asian
- 728100.0%Other race
- 62792.7%Two or more races
- 2,25484.9%White alone, not Hispanic / Latino
- 66894.0%Hispanic or Latino

-
- Moved within same county
- 692.6%White / Caucasian
- 1707.3%Asian
- 233.4%Two or more races
- 752.8%White alone, not Hispanic / Latino
- 141.9%Hispanic or Latino

-
- Moved within same state
- 1596.0%White / Caucasian
- 1024.4%Asian
- 1686.3%White alone, not Hispanic / Latino

-
- Moved from different state
- 1636.1%White / Caucasian
- 2249.6%Asian
- 162.2%Other race
- 1736.5%White alone, not Hispanic / Latino
- 162.3%Hispanic or Latino

Children Nativity (place of birth) in Pimmit Hills
Place of birth for residents in Pimmit Hills
![Place of birth for the foreign-born population - Regions]()
- 1,987Asia
- 838South Central Asia
- 568Eastern Asia
- 563Americas
- 550Latin America
- 541South Eastern Asia
- 472China
- 328South America
- 186Europe
- 138Eastern Europe
- 119Central America
- 102Caribbean
- 63Africa
- 40Western Africa
- 32Western Europe
- 22Eastern Africa
- 17Western Asia
- 14Northern Europe
- 12Northern America

![Place of birth for the foreign-born population - Countries]()
- 704India
- 359China
- 276Philippines
- 236Bolivia
- 205Vietnam
- 113Taiwan
- 102Haiti
- 87El Salvador
- 78Korea
- 64Peru
- 60Bangladesh
- 59Thailand
- 56Ukraine
- 40Sierra Leone
- 38Pakistan
- 33Iran
- 32Germany
- 30Poland
- 26Ecuador
- 23Guatemala
- 22Ethiopia
- 17Israel
- 16North Macedonia (Macedonia)
- 16Japan
- 14Denmark
- 12Canada
- 9Russia
- 7Mexico
- 4Lithuania

Zip codes: 22043.