Races in Pierson-Seville, Florida (FL) Detailed Stats
Ancestries, Foreign-born residents, place of birth
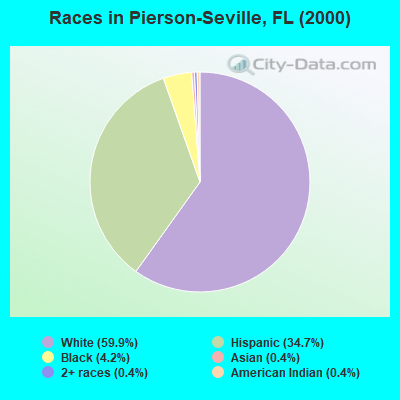
Race distribution in Pierson-Seville

- 5,14659.9%White alone
- 2,97834.7%Hispanic
- 3574.2%Black alone
- 350.4%Two or more races
- 370.4%Asian alone
- 320.4%American Indian alone
- 20.02%Native Hawaiian and Other
Pacific Islander alone - 10.01%Other race alone
2000
2022
-
- 10,458,50965.4%White alone
- 2,682,71516.8%Hispanic
- 2,264,26814.2%Black alone
- 261,6931.6%Asian alone
- 236,9541.5%Two or more races
- 42,3580.3%American Indian alone
- 28,9940.2%Other race alone
- 6,8870.04%Native Hawaiian and Other
Pacific Islander alone

-
- 11,309,40350.8%White alone
- 6,025,03927.1%Hispanic
- 3,241,01514.6%Black alone
- 861,6303.9%Two or more races
- 623,6922.8%Asian alone
- 152,0540.7%Other race alone
- 22,5040.1%American Indian alone
- 9,4860.04%Native Hawaiian and Other
Pacific Islander alone

Income and house value in Pierson-Seville
- Median household income in 2022
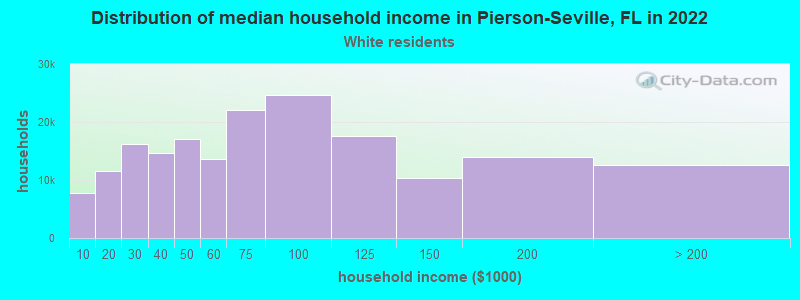
- $64,801White non-Hispanic householders
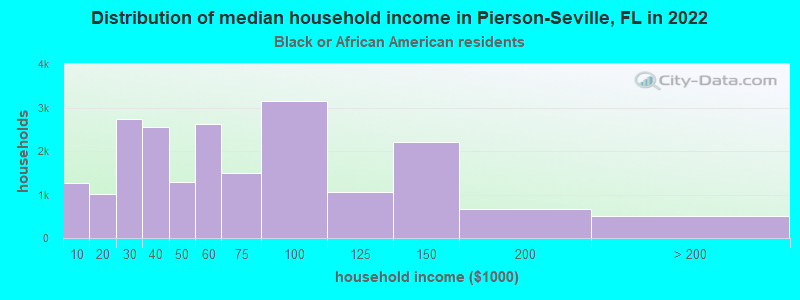
- $54,491Black householders
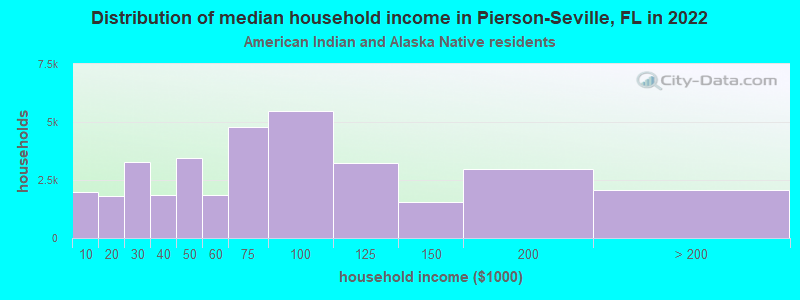
- $55,152American Indian and Alaska Native householders
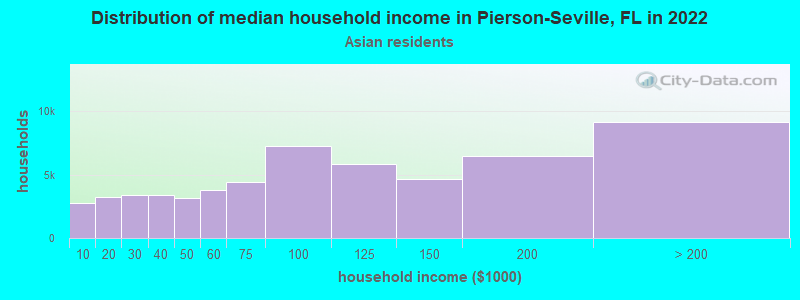
- $64,378Asian householders
- $56,813Some other race householders
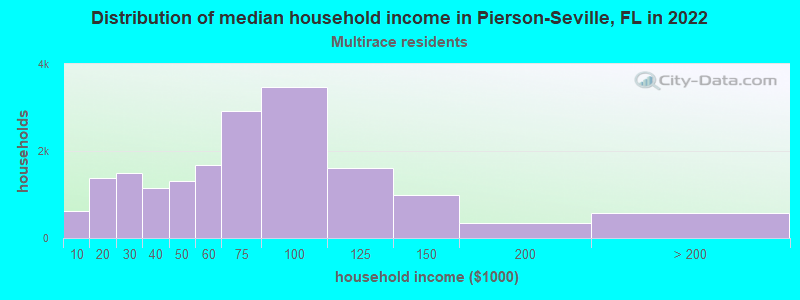
- $97,646Two or more races householders
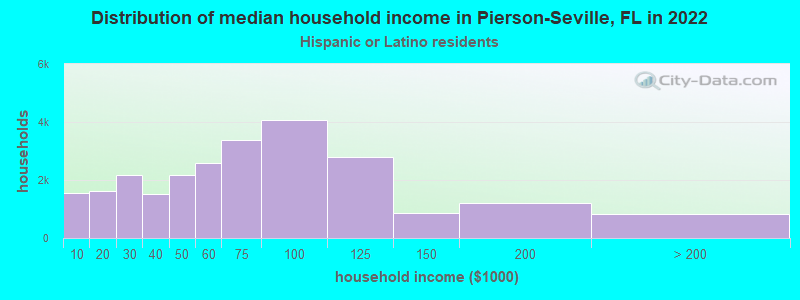
- $50,862Hispanic or Latino race householders
- Median 2022 house value
- $362,275White Non-Hispanic householders
- $171,176Black or African American householders
- $599,487American Indian or Alaska Native householders
- $156,789Some other race householders
- over $1,000,000Two or more races householders
- $267,463Hispanic or Latino householders
Household income for White non-Hispanic householders
Household income for Black householders
Household income for American Indian and Alaska Native householders
Household income for Asian householders
Household income for Two or more races householders
Household income for Hispanic or Latino race householders
Zip code: 32180