Races in Pensacola, Florida (FL) Detailed Stats
Data:
Races - White alone (%)
Races - White alone (% change since 2000)
Races - Black alone (%)
Races - Black alone (% change since 2000)
Races - American Indian alone (%)
Races - American Indian alone (% change since 2000)
Races - Asian alone (%)
Races - Asian alone (% change since 2000)
Races - Hispanic (%)
Races - Hispanic (% change since 2000)
Races - Native Hawaiian and Other Pacific Islander alone (%)
Races - Native Hawaiian and Other Pacific Islander alone (% change since 2000)
Races - Two or more races(%)
Races - Two or more races(% change since 2000)
Races - Other race alone (%)
Races - Other race alone (% change since 2000)
Racial diversity
Place of birth - Born in state of residence (%)
Place of birth - Born in state of residence (%) - White
Place of birth - Born in state of residence (%) - Black or African American
Place of birth - Born in state of residence (%) - Asian
Place of birth - Born in state of residence (%) - Hispanic or Latino
Place of birth - Born in state of residence (%) - American Indian and Alaska Native
Place of birth - Born in state of residence (%) - Multirace
Place of birth - Born in state of residence (%) - Other Race
Place of birth - Born in other state (%)
Place of birth - Born in other state (%) - White
Place of birth - Born in other state (%) - Black or African American
Place of birth - Born in other state (%) - Asian
Place of birth - Born in other state (%) - Hispanic or Latino
Place of birth - Born in other state (%) - American Indian and Alaska Native
Place of birth - Born in other state (%) - Multirace
Place of birth - Born in other state (%) - Other Race
Place of birth - Native, outside of US (%)
Place of birth - Native, outside of US (%) - White
Place of birth - Native, outside of US (%) - Black or African American
Place of birth - Native, outside of US (%) - Asian
Place of birth - Native, outside of US (%) - Hispanic or Latino
Place of birth - Native, outside of US (%) - American Indian and Alaska Native
Place of birth - Native, outside of US (%) - Multirace
Place of birth - Native, outside of US (%) - Other Race
Place of birth - Foreign born (%)
Place of birth - Foreign born (%) - White
Place of birth - Foreign born (%) - Black or African American
Place of birth - Foreign born (%) - Asian
Place of birth - Foreign born (%) - Hispanic or Latino
Place of birth - Foreign born (%) - American Indian and Alaska Native
Place of birth - Foreign born (%) - Multirace
Place of birth - Foreign born (%) - Other Race
Residents speaking English at home (%)
Residents speaking English at home - Born in the United States (%)
Residents speaking English at home - Native, born elsewhere (%)
Residents speaking English at home - Foreign born (%)
Residents speaking Spanish at home (%)
Residents speaking Spanish at home - Born in the United States (%)
Residents speaking Spanish at home - Native, born elsewhere (%)
Residents speaking Spanish at home - Foreign born (%)
Residents speaking other language at home (%)
Residents speaking other language at home - Born in the United States (%)
Residents speaking other language at home - Native, born elsewhere (%)
Residents speaking other language at home - Foreign born (%)
Marital status - Never married (%)
Marital status - Now married (%)
Marital status - Separated (%)
Marital status - Widowed (%)
Marital status - Divorced (%)
Ancestries Reported - Arab (%)
Ancestries Reported - Czech (%)
Ancestries Reported - Danish (%)
Ancestries Reported - Dutch (%)
Ancestries Reported - English (%)
Ancestries Reported - French (%)
Ancestries Reported - French Canadian (%)
Ancestries Reported - German (%)
Ancestries Reported - Greek (%)
Ancestries Reported - Hungarian (%)
Ancestries Reported - Irish (%)
Ancestries Reported - Italian (%)
Ancestries Reported - Lithuanian (%)
Ancestries Reported - Norwegian (%)
Ancestries Reported - Polish (%)
Ancestries Reported - Portuguese (%)
Ancestries Reported - Russian (%)
Ancestries Reported - Scotch-Irish (%)
Ancestries Reported - Scottish (%)
Ancestries Reported - Slovak (%)
Ancestries Reported - Subsaharan African (%)
Ancestries Reported - Swedish (%)
Ancestries Reported - Swiss (%)
Ancestries Reported - Ukrainian (%)
Ancestries Reported - United States (%)
Ancestries Reported - Welsh (%)
Ancestries Reported - West Indian (%)
Ancestries Reported - Other (%)
Geographical mobility - Same house 1 year ago (%)
Geographical mobility - Same house 1 year ago (%) - White
Geographical mobility - Same house 1 year ago (%) - Black or African American
Geographical mobility - Same house 1 year ago (%) - Asian
Geographical mobility - Same house 1 year ago (%) - Hispanic or Latino
Geographical mobility - Same house 1 year ago (%) - American Indian and Alaska Native
Geographical mobility - Same house 1 year ago (%) - Multirace
Geographical mobility - Same house 1 year ago (%) - Other Race
Geographical mobility - Moved within same county (%)
Geographical mobility - Moved within same county (%) - White
Geographical mobility - Moved within same county (%) - Black or African American
Geographical mobility - Moved within same county (%) - Asian
Geographical mobility - Moved within same county (%) - Hispanic or Latino
Geographical mobility - Moved within same county (%) - American Indian and Alaska Native
Geographical mobility - Moved within same county (%) - Multirace
Geographical mobility - Moved within same county (%) - Other Race
Geographical mobility - Moved from different county within same state (%)
Geographical mobility - Moved from different county within same state (%) - White
Geographical mobility - Moved from different county within same state (%) - Black or African American
Geographical mobility - Moved from different county within same state (%) - Asian
Geographical mobility - Moved from different county within same state (%) - Hispanic or Latino
Geographical mobility - Moved from different county within same state (%) - American Indian and Alaska Native
Geographical mobility - Moved from different county within same state (%) - Multirace
Geographical mobility - Moved from different county within same state (%) - Other Race
Geographical mobility - Moved from different state (%)
Geographical mobility - Moved from different state (%) - White
Geographical mobility - Moved from different state (%) - Black or African American
Geographical mobility - Moved from different state (%) - Asian
Geographical mobility - Moved from different state (%) - Hispanic or Latino
Geographical mobility - Moved from different state (%) - American Indian and Alaska Native
Geographical mobility - Moved from different state (%) - Multirace
Geographical mobility - Moved from different state (%) - Other Race
Geographical mobility - Moved from abroad (%)
Geographical mobility - Moved from abroad (%) - White
Geographical mobility - Moved from abroad (%) - Black or African American
Geographical mobility - Moved from abroad (%) - Asian
Geographical mobility - Moved from abroad (%) - Hispanic or Latino
Geographical mobility - Moved from abroad (%) - American Indian and Alaska Native
Geographical mobility - Moved from abroad (%) - Multirace
Geographical mobility - Moved from abroad (%) - Other Race
Place of birth for the foreign-born population - Ireland (%)
Place of birth for the foreign-born population - Denmark (%)
Place of birth for the foreign-born population - Norway (%)
Place of birth for the foreign-born population - Sweden (%)
Place of birth for the foreign-born population - United Kingdom (%)
Place of birth for the foreign-born population - England (%)
Place of birth for the foreign-born population - Scotland (%)
Place of birth for the foreign-born population - Other Northern Europe (%)
Place of birth for the foreign-born population - Austria (%)
Place of birth for the foreign-born population - Belgium (%)
Place of birth for the foreign-born population - France (%)
Place of birth for the foreign-born population - Germany (%)
Place of birth for the foreign-born population - Netherlands (%)
Place of birth for the foreign-born population - Switzerland (%)
Place of birth for the foreign-born population - Other Western Europe (%)
Place of birth for the foreign-born population - Greece (%)
Place of birth for the foreign-born population - Italy (%)
Place of birth for the foreign-born population - Portugal (%)
Place of birth for the foreign-born population - Spain (%)
Place of birth for the foreign-born population - Other Southern Europe (%)
Place of birth for the foreign-born population - Albania (%)
Place of birth for the foreign-born population - Belarus (%)
Place of birth for the foreign-born population - Bosnia and Herzegovina (%)
Place of birth for the foreign-born population - Bulgaria (%)
Place of birth for the foreign-born population - Croatia (%)
Place of birth for the foreign-born population - Czechoslovakia (%)
Place of birth for the foreign-born population - Hungary (%)
Place of birth for the foreign-born population - Latvia (%)
Place of birth for the foreign-born population - Lithuania (%)
Place of birth for the foreign-born population - North Macedonia (Macedonia) (%)
Place of birth for the foreign-born population - Moldova (%)
Place of birth for the foreign-born population - Poland (%)
Place of birth for the foreign-born population - Romania (%)
Place of birth for the foreign-born population - Russia (%)
Place of birth for the foreign-born population - Serbia (%)
Place of birth for the foreign-born population - Ukraine (%)
Place of birth for the foreign-born population - Other Eastern Europe (%)
Place of birth for the foreign-born population - China (%)
Place of birth for the foreign-born population - Hong Kong (%)
Place of birth for the foreign-born population - Taiwan (%)
Place of birth for the foreign-born population - Japan (%)
Place of birth for the foreign-born population - Korea (%)
Place of birth for the foreign-born population - Other Eastern Asia (%)
Place of birth for the foreign-born population - Afghanistan (%)
Place of birth for the foreign-born population - Bangladesh (%)
Place of birth for the foreign-born population - India (%)
Place of birth for the foreign-born population - Iran (%)
Place of birth for the foreign-born population - Kazakhstan (%)
Place of birth for the foreign-born population - Nepal (%)
Place of birth for the foreign-born population - Pakistan (%)
Place of birth for the foreign-born population - Sri Lanka (%)
Place of birth for the foreign-born population - Uzbekistan (%)
Place of birth for the foreign-born population - Other South Central Asia (%)
Place of birth for the foreign-born population - Burma (%)
Place of birth for the foreign-born population - Cambodia (%)
Place of birth for the foreign-born population - Indonesia (%)
Place of birth for the foreign-born population - Laos (%)
Place of birth for the foreign-born population - Malaysia (%)
Place of birth for the foreign-born population - Philippines (%)
Place of birth for the foreign-born population - Singapore (%)
Place of birth for the foreign-born population - Thailand (%)
Place of birth for the foreign-born population - Vietnam (%)
Place of birth for the foreign-born population - Other South Eastern Asia (%)
Place of birth for the foreign-born population - Armenia (%)
Place of birth for the foreign-born population - Iraq (%)
Place of birth for the foreign-born population - Israel (%)
Place of birth for the foreign-born population - Jordan (%)
Place of birth for the foreign-born population - Kuwait (%)
Place of birth for the foreign-born population - Lebanon (%)
Place of birth for the foreign-born population - Saudi Arabia (%)
Place of birth for the foreign-born population - Syria (%)
Place of birth for the foreign-born population - Turkey (%)
Place of birth for the foreign-born population - Yemen (%)
Place of birth for the foreign-born population - Other Western Asia (%)
Place of birth for the foreign-born population - Eritrea (%)
Place of birth for the foreign-born population - Ethiopia (%)
Place of birth for the foreign-born population - Kenya (%)
Place of birth for the foreign-born population - Somalia (%)
Place of birth for the foreign-born population - Uganda (%)
Place of birth for the foreign-born population - Zimbabwe (%)
Place of birth for the foreign-born population - Other Eastern Africa (%)
Place of birth for the foreign-born population - Cameroon (%)
Place of birth for the foreign-born population - Congo (%)
Place of birth for the foreign-born population - Democratic Republic of Congo (Zaire) (%)
Place of birth for the foreign-born population - Other Middle Africa (%)
Place of birth for the foreign-born population - Egypt (%)
Place of birth for the foreign-born population - Morocco (%)
Place of birth for the foreign-born population - Sudan (%)
Place of birth for the foreign-born population - Other Northern Africa (%)
Place of birth for the foreign-born population - South Africa (%)
Place of birth for the foreign-born population - Other Southern Africa (%)
Place of birth for the foreign-born population - Cabo Verde (%)
Place of birth for the foreign-born population - Ghana (%)
Place of birth for the foreign-born population - Liberia (%)
Place of birth for the foreign-born population - Nigeria (%)
Place of birth for the foreign-born population - Senegal (%)
Place of birth for the foreign-born population - Sierra Leone (%)
Place of birth for the foreign-born population - Other Western Africa (%)
Place of birth for the foreign-born population - Australia (%)
Place of birth for the foreign-born population - New Zealand (%)
Place of birth for the foreign-born population - Fiji (%)
Place of birth for the foreign-born population - Micronesia (%)
Place of birth for the foreign-born population - Bahamas (%)
Place of birth for the foreign-born population - Barbados (%)
Place of birth for the foreign-born population - Cuba (%)
Place of birth for the foreign-born population - Dominica (%)
Place of birth for the foreign-born population - Dominican Republic (%)
Place of birth for the foreign-born population - Grenada (%)
Place of birth for the foreign-born population - Haiti (%)
Place of birth for the foreign-born population - Jamaica (%)
Place of birth for the foreign-born population - St. Vincent and the Grenadines (%)
Place of birth for the foreign-born population - Trinidad and Tobago (%)
Place of birth for the foreign-born population - West Indies (%)
Place of birth for the foreign-born population - Other Caribbean (%)
Place of birth for the foreign-born population - Belize (%)
Place of birth for the foreign-born population - Costa Rica (%)
Place of birth for the foreign-born population - El Salvador (%)
Place of birth for the foreign-born population - Guatemala (%)
Place of birth for the foreign-born population - Honduras (%)
Place of birth for the foreign-born population - Mexico (%)
Place of birth for the foreign-born population - Nicaragua (%)
Place of birth for the foreign-born population - Panama (%)
Place of birth for the foreign-born population - Other Central America (%)
Place of birth for the foreign-born population - Argentina (%)
Place of birth for the foreign-born population - Bolivia (%)
Place of birth for the foreign-born population - Brazil (%)
Place of birth for the foreign-born population - Chile (%)
Place of birth for the foreign-born population - Colombia (%)
Place of birth for the foreign-born population - Ecuador (%)
Place of birth for the foreign-born population - Guyana (%)
Place of birth for the foreign-born population - Peru (%)
Place of birth for the foreign-born population - Uruguay (%)
Place of birth for the foreign-born population - Venezuela (%)
Place of birth for the foreign-born population - Other South America (%)
Place of birth for the foreign-born population - Canada (%)
Place of birth for the foreign-born population - Other Northern America (%)
Place of birth for the foreign-born population - Other (%)
Latest news about races in Pensacola, FL collected exclusively by city-data.com from local newspapers, TV, and radio stations
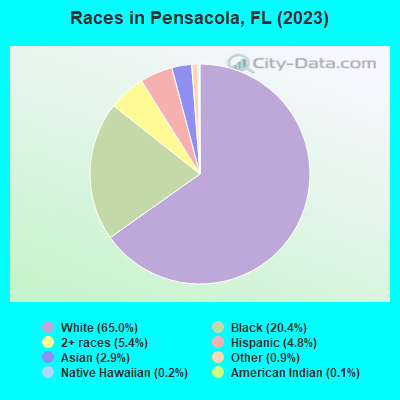
According to 2022 data, the most numerous races in Pensacola, FL are White alone (34,737 residents), Hispanic (2,623 residents), and Black alone (12,200 residents). 94.8% of Pensacola residents speak English at home. 4.2% of Pensacola, FL residents are foreign-born (1.4% born in Latin America, 1.1% born in Asia, 1.0% born in Europe), which is 394.6% less than the foreign-born rate of 21.0% across the entire state of Florida.
Race distribution in Pensacola
2000 2022
10,458,509 65.4% White alone 2,682,715 16.8% Hispanic 2,264,268 14.2% Black alone 261,693 1.6% Asian alone 236,954 1.5% Two or more races 42,358 0.3% American Indian alone 28,994 0.2% Other race alone 6,887 0.04% Native Hawaiian and Other
11,309,403 50.8% White alone 6,025,039 27.1% Hispanic 3,241,015 14.6% Black alone 861,630 3.9% Two or more races 623,692 2.8% Asian alone 152,054 0.7% Other race alone 22,504 0.1% American Indian alone 9,486 0.04% Native Hawaiian and Other
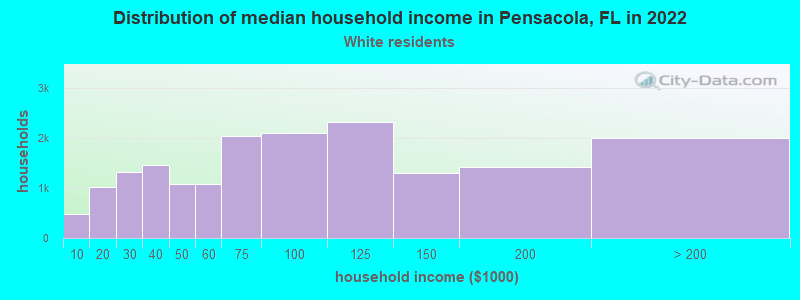
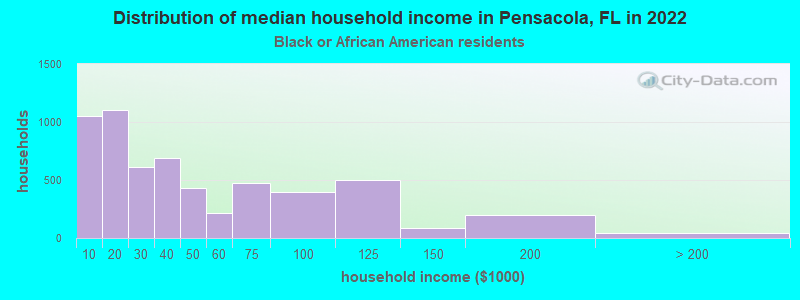
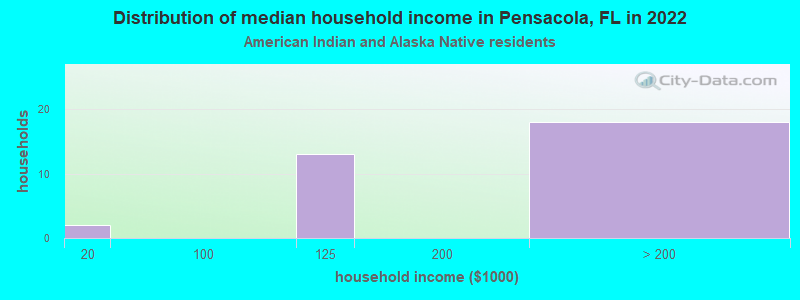
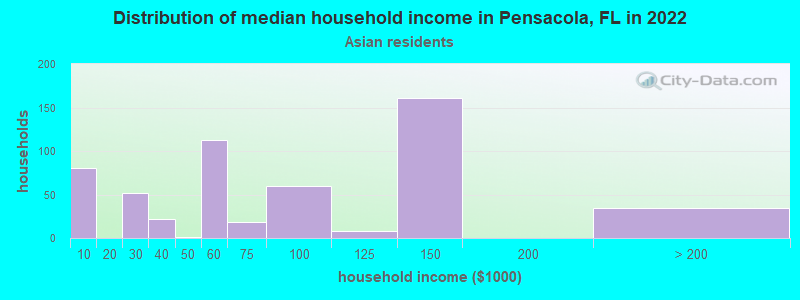
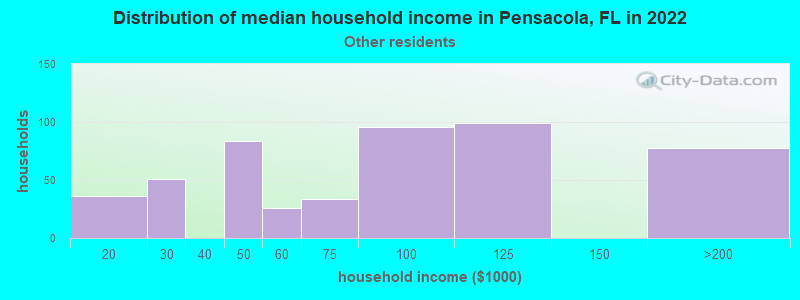
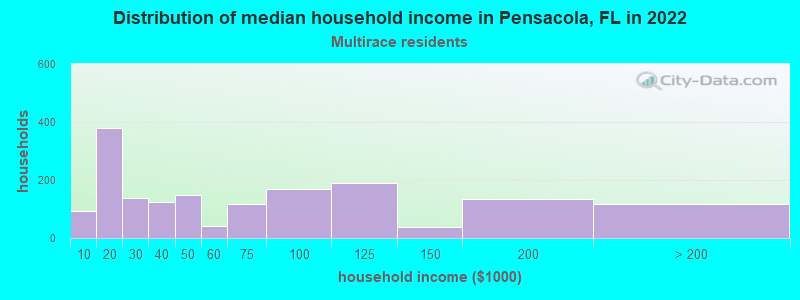
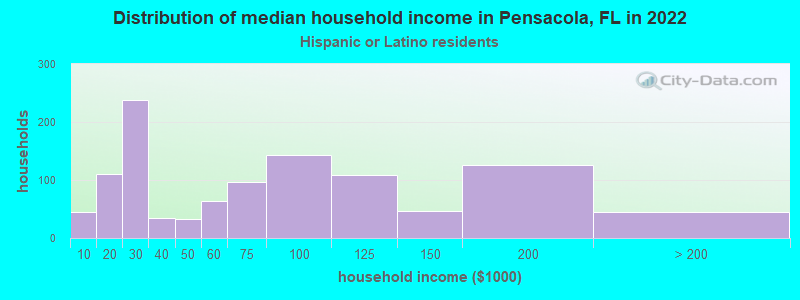
Income and house value in Pensacola Median household income in 2022 $78,493 White non-Hispanic householders$34,011 Black householdersover $200,000 American Indian and Alaska Native householders$83,061 Asian householders$100,363 Some other race householders$42,108 Two or more races householders$64,855 Hispanic or Latino race householdersMedian 2022 house value $348,985 White Non-Hispanic householders$203,151 Black or African American householders$281,833 American Indian or Alaska Native householders $328,636 Asian householders$254,362 Native Hawaiian and other Pacific Islander householders$283,529 Some other race householders$287,599 Two or more races householders$278,103 Hispanic or Latino householders
Median age by race in Pensacola
41.5 Median age for White residents36.8 46.9 37.9 Median age for Black or African American residents35.6 40.8 37.9 Median age for American Indian / Alaska Native residents42.6 62.3 41.9 Median age for Asian residents41.0 37.4 71.8 Median age for Native Hawaiian / Pacific Islander residents-858,307,848.3 -443,298,968.6 49.2 Median age for Other race residents51.7 43.4 24.9 Median age for Two or more races residents16.0 28.9 41.5 Median age for White alone residents37.2 47.0 35.0 Median age for Hispanic or Latino residents36.4 31.3
Owner/renter occupied households by race in Pensacola
House owners and renters - White residents 12,258 69.7% Owner occupied5,325 30.3% Renter occupiedHouse owners and renters - Black or African American residents 2,527 43.8% Owner occupied3,243 56.2% Renter occupiedHouse owners and renters - American Indian / Alaska Native residents 23 86.8% Owner occupied3 13.2% Renter occupiedHouse owners and renters - Asian residents 309 55.3% Owner occupied250 44.7% Renter occupiedHouse owners and renters - Native Hawaiian / Pacific Islander residents 2 100.0% Renter occupiedHouse owners and renters - Other race residents 324 60.2% Owner occupied214 39.8% Renter occupiedHouse owners and renters - Two or more races residents 768 48.4% Owner occupied818 51.6% Renter occupiedHouse owners and renters - White alone residents 12,075 69.9% Owner occupied5,200 30.1% Renter occupiedHouse owners and renters - Hispanic or Latino residents 496 48.1% Owner occupied535 51.9% Renter occupied
Language usage in Pensacola
English speakers - Total 94.8% of residents of Pensacola speak English at home.
1.9% of residents speak Spanish at home 635 65.6% Speak English very well333 34.4% Speak English less than very well3.6% of residents speak other language at home 1,591 85.9% Speak English very well261 14.1% Speak English less than very well
English speakers - Born in the United States 97.3% of residents of Pensacola speak English at home.
1.4% of residents speak Spanish at home 304 84.4% Speak English very well56 15.6% Speak English less than very well1.3% of residents speak other language at home 338 100.0% Speak English very well
English speakers - Native, born elsewhere 78.3% of residents of Pensacola speak English at home.
10.1% of residents speak Spanish at home 99 99.0% Speak English very well1 1.0% Speak English less than very well13.4% of residents speak other language at home 133 100.0% Speak English very well
English speakers - Foreign-born 30.7% of residents of Pensacola speak English at home.
20.9% of residents speak Spanish at home 277 59.3% Speak English very well190 40.7% Speak English less than very well54.8% of residents speak other language at home 998 81.4% Speak English very well228 18.6% Speak English less than very well
White (Caucasian) - Speak only English Native:
97.8% (32,015)Foreign-born:
45.0% (341)
White (Caucasian) - Speak another language Native:
2.2% (725)Foreign-born:
55.2% (418)
Black or African American - Speak only English Native:
100.0% (11,176)Foreign-born:
57.5% (86)
Black or African American - Speak another language Native:
1.3% (142)Foreign-born:
39.3% (59)
Asian - Speak only English Native:
86.4% (375)Foreign-born:
17.7% (103)
Asian - Speak another language Native:
12.2% (53)Foreign-born:
82.3% (476)
Native Hawaiian / Pacific Islander - Speak only English Native:
87.6% (6)Foreign-born:
19.4% (6)
Other race - Speak only English Native:
98.5% (712)Foreign-born:
16.1% (87)
Other race - Speak another language Native:
20.1% (145)Foreign-born:
71.2% (387)
Two or more races - Speak only English Native:
95.5% (3,291)Foreign-born:
22.1% (40)
Two or more races - Speak another language Native:
4.7% (162)Foreign-born:
75.0% (136)
White alone - Speak only English Native:
97.8% (31,504)Foreign-born:
39.0% (307)
White alone - Speak another language Native:
2.3% (731)Foreign-born:
62.8% (493)
Hispanic or Latino - Speak only English Native:
85.0% (1,522)Foreign-born:
18.5% (120)
Hispanic or Latino - Speak another language Native:
16.8% (301)Foreign-born:
80.7% (521)
Foreign-born residents in Pensacola 2,321 residents are foreign born (1.4% Latin America , 1.1% Asia , 1.0% Europe ).
This city:
4.2%Florida:
21.1%
Marital status for residents in Pensacola Marital status - White (Caucasian) population 15 years and over
Males 34.7% Never married48.2% Now married1.5% Separated2.9% Widowed12.6% DivorcedFemales 25.9% Never married44.2% Now married1.0% Separated11.7% Widowed17.3% DivorcedWomen who gave birth in the past 12 months Now married:
91.4% (278)Unmarried:
8.6% (26)
Women who did not give birth in the past 12 months Now married:
41.5% (2,988)Unmarried:
58.5% (4,215)
Marital status - Black or African American population 15 years and over
Males 53.5% Never married25.7% Now married2.1% Separated6.4% Widowed12.3% DivorcedFemales 41.1% Never married19.2% Now married10.1% Separated9.7% Widowed19.9% DivorcedWomen who gave birth in the past 12 months Now married:
0.0% (0)Unmarried:
100.0% (128)
Women who did not give birth in the past 12 months Now married:
22.4% (549)Unmarried:
77.6% (1,905)
Marital status - American Indian / Alaska Native population 15 years and over
Males 0.0% Never married63.6% Now married0.0% Separated36.4% Widowed0.0% DivorcedFemales 0.0% Never married77.8% Now married0.0% Separated22.2% Widowed0.0% DivorcedMarital status - Asian population 15 years and over
Males 63.0% Never married23.5% Now married13.5% Separated0.0% Widowed0.0% DivorcedFemales 38.2% Never married52.2% Now married0.0% Separated0.2% Widowed9.5% DivorcedWomen who gave birth in the past 12 months Now married:
100.0% (21)Unmarried:
0.0% (0)
Women who did not give birth in the past 12 months Now married:
50.5% (170)Unmarried:
49.5% (167)
Marital status - Native Hawaiian / Pacific Islander population 15 years and over
Males 11.3% Never married0.0% Now married0.0% Separated88.7% Widowed0.0% DivorcedFemales 0.0% Never married33.3% Now married0.0% Separated66.7% Widowed0.0% DivorcedWomen who did not give birth in the past 12 months Now married:
33.3% (2)Unmarried:
66.7% (3)
Marital status - Other race population 15 years and over
Males 34.2% Never married64.6% Now married0.0% Separated0.0% Widowed1.2% DivorcedFemales 16.8% Never married51.8% Now married12.2% Separated1.5% Widowed17.7% DivorcedWomen who gave birth in the past 12 months Now married:
43.8% (34)Unmarried:
56.2% (43)
Women who did not give birth in the past 12 months Now married:
86.0% (267)Unmarried:
14.0% (43)
Marital status - Two or more races population 15 years and over
Males 48.0% Never married41.1% Now married0.0% Separated2.2% Widowed8.8% DivorcedFemales 50.4% Never married27.1% Now married1.8% Separated8.2% Widowed12.5% DivorcedWomen who gave birth in the past 12 months Now married:
6.8% (5)Unmarried:
93.2% (73)
Women who did not give birth in the past 12 months Now married:
17.3% (179)Unmarried:
82.7% (854)
Marital status - White alone, not Hispanic / Latino population 15 years and over
Males 33.6% Never married49.0% Now married1.6% Separated3.0% Widowed12.8% DivorcedFemales 25.1% Never married44.5% Now married1.0% Separated11.8% Widowed17.6% DivorcedWomen who gave birth in the past 12 months Now married:
91.1% (274)Unmarried:
8.9% (27)
Women who did not give birth in the past 12 months Now married:
42.3% (3,003)Unmarried:
57.7% (4,089)
Marital status - Hispanic or Latino population 15 years and over
Males 62.7% Never married29.1% Now married0.1% Separated1.4% Widowed6.7% DivorcedFemales 31.8% Never married39.4% Now married4.7% Separated8.1% Widowed16.0% DivorcedWomen who gave birth in the past 12 months Now married:
64.0% (32)Unmarried:
36.0% (18)
Women who did not give birth in the past 12 months Now married:
43.3% (218)Unmarried:
56.7% (285)
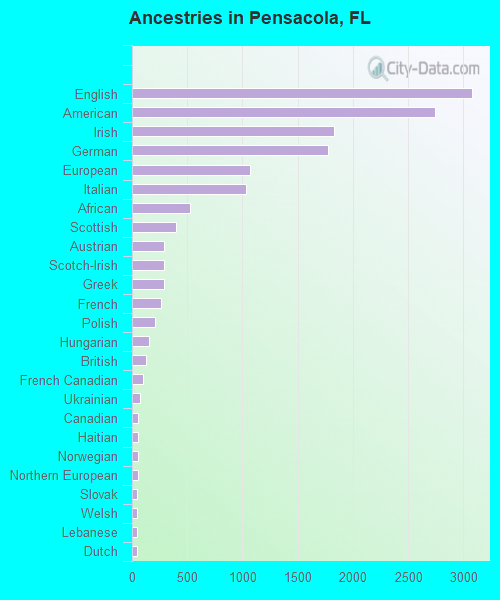
Ancestries in Pensacola
3,079 10.8% English2,741 9.6% American1,827 6.4% Irish1,775 6.2% German1,071 3.8% European1,030 3.6% Italian523 1.8% African401 1.4% Scottish291 1.0% Austrian290 1.0% Scotch-Irish288 1.0% Greek264 0.9% French207 0.7% Polish155 0.5% Hungarian124 0.4% British97 0.3% French Canadian69 0.2% Ukrainian58 0.2% Canadian56 0.2% Haitian55 0.2% Norwegian54 0.2% Northern European48 0.2% Slovak48 0.2% Welsh45 0.2% Lebanese43 0.2% Dutch43 0.2% Czech42 0.1% Russian42 0.1% Scandinavian38 0.1% Eastern European37 0.1% Cajun33 0.1% Icelander30 0.1% Romanian25 0.09% Swedish24 0.08% Jamaican22 0.08% Cape Verdean21 0.07% Croatian19 0.07% Danish19 0.07% Portuguese16 0.06% Brazilian15 0.05% Arab12 0.04% Armenian9 0.03% Finnish8 0.03% Latvian8 0.03% Belizean7 0.02% Lithuanian6 0.02% Czechoslovakian
Geographical mobility in Pensacola Same house 1 year ago 29,835 84.9% White (Caucasian)10,618 87.7% Black or African American40 75.9% American Indian / Alaska Native755 66.8% Asian57 100.0% Native Hawaiian / Pacific Islander1,413 100.0% Other race3,622 90.9% Two or more races29,562 85.4% White alone, not Hispanic / Latino2,057 80.5% Hispanic or LatinoMoved within same county 2,807 8.0% White / Caucasian865 7.1% Black or African American213 18.8% Asian28 2.0% Other race253 6.3% Two or more races2,728 7.9% White alone, not Hispanic / Latino264 10.3% Hispanic or LatinoMoved within same state 610 1.7% White / Caucasian300 2.5% Black or African American9 17.7% American Indian / Alaska Native2 0.2% Asian6 0.5% Other race71 1.8% Two or more races546 1.6% White alone, not Hispanic / Latino285 11.1% Hispanic or LatinoMoved from different state 1,729 4.9% White / Caucasian165 1.4% Black or African American2 4.6% American Indian / Alaska Native114 10.1% Asian4 0.3% Other race102 2.6% Two or more races1,688 4.9% White alone, not Hispanic / Latino92 3.6% Hispanic or LatinoMoved from abroad 40 0.1% White224 1.9% Black or African American32 2.8% Asian45 0.1% White alone, not Hispanic / Latino14 0.6% Hispanic or Latino
Children Nativity (place of birth) in Pensacola
Children under 6 years - Living with two parents Both parents native 2,087 100.0% NativeBoth parents foreign-born 125 100.0% NativeOne native, one foreign-born parent 181 100.0% NativeChildren under 6 years - Living with one parent Native parent 1,503 100.0% NativeForeign-born parent 89 100.0% NativeChildren 6 to 17 years - Living with two parents Both parents native 2,581 100.0% NativeBoth parents foreign-born 172 100.0% NativeOne native, one foreign-born parent 56 100.0% NativeChildren 6 to 17 years - Living with one parent Native parent 3,570 100.0% NativeForeign-born parent 60 50.6% Native59 49.4% Foreign-born
Grandparents responsible for own grandchildren in Pensacola
Grandparents (30 to 59 years) White / Caucasian 14 34.2% Responsible for grandchildren28 65.8% Not responsible for grandchildrenBlack or African American 66 43.3% Responsible for grandchildren86 56.7% Not responsible for grandchildrenNative Hawaiian / Pacific Islander 8 100.0% Responsible for grandchildrenTwo or more races 34 100.0% Responsible for grandchildrenWhite alone, not Hispanic / Latino 15 34.5% Responsible for grandchildren28 65.5% Not responsible for grandchildrenGrandparents (60 years and over) White / Caucasian 112 67.1% Responsible for grandchildren55 32.9% Not responsible for grandchildrenBlack or African American 97 36.8% Responsible for grandchildren167 63.2% Not responsible for grandchildrenTwo or more races 57 100.0% Responsible for grandchildrenWhite alone, not Hispanic / Latino 101 64.6% Responsible for grandchildren55 35.4% Not responsible for grandchildren