Races in Patchogue, New York (NY) Detailed Stats
Data:
Races - White alone (%)
Races - White alone (% change since 2000)
Races - Black alone (%)
Races - Black alone (% change since 2000)
Races - American Indian alone (%)
Races - American Indian alone (% change since 2000)
Races - Asian alone (%)
Races - Asian alone (% change since 2000)
Races - Hispanic (%)
Races - Hispanic (% change since 2000)
Races - Native Hawaiian and Other Pacific Islander alone (%)
Races - Native Hawaiian and Other Pacific Islander alone (% change since 2000)
Races - Two or more races(%)
Races - Two or more races(% change since 2000)
Races - Other race alone (%)
Races - Other race alone (% change since 2000)
Racial diversity
Place of birth - Born in state of residence (%)
Place of birth - Born in state of residence (%) - White
Place of birth - Born in state of residence (%) - Black or African American
Place of birth - Born in state of residence (%) - Asian
Place of birth - Born in state of residence (%) - Hispanic or Latino
Place of birth - Born in state of residence (%) - American Indian and Alaska Native
Place of birth - Born in state of residence (%) - Multirace
Place of birth - Born in state of residence (%) - Other Race
Place of birth - Born in other state (%)
Place of birth - Born in other state (%) - White
Place of birth - Born in other state (%) - Black or African American
Place of birth - Born in other state (%) - Asian
Place of birth - Born in other state (%) - Hispanic or Latino
Place of birth - Born in other state (%) - American Indian and Alaska Native
Place of birth - Born in other state (%) - Multirace
Place of birth - Born in other state (%) - Other Race
Place of birth - Native, outside of US (%)
Place of birth - Native, outside of US (%) - White
Place of birth - Native, outside of US (%) - Black or African American
Place of birth - Native, outside of US (%) - Asian
Place of birth - Native, outside of US (%) - Hispanic or Latino
Place of birth - Native, outside of US (%) - American Indian and Alaska Native
Place of birth - Native, outside of US (%) - Multirace
Place of birth - Native, outside of US (%) - Other Race
Place of birth - Foreign born (%)
Place of birth - Foreign born (%) - White
Place of birth - Foreign born (%) - Black or African American
Place of birth - Foreign born (%) - Asian
Place of birth - Foreign born (%) - Hispanic or Latino
Place of birth - Foreign born (%) - American Indian and Alaska Native
Place of birth - Foreign born (%) - Multirace
Place of birth - Foreign born (%) - Other Race
Residents speaking English at home (%)
Residents speaking English at home - Born in the United States (%)
Residents speaking English at home - Native, born elsewhere (%)
Residents speaking English at home - Foreign born (%)
Residents speaking Spanish at home (%)
Residents speaking Spanish at home - Born in the United States (%)
Residents speaking Spanish at home - Native, born elsewhere (%)
Residents speaking Spanish at home - Foreign born (%)
Residents speaking other language at home (%)
Residents speaking other language at home - Born in the United States (%)
Residents speaking other language at home - Native, born elsewhere (%)
Residents speaking other language at home - Foreign born (%)
Marital status - Never married (%)
Marital status - Now married (%)
Marital status - Separated (%)
Marital status - Widowed (%)
Marital status - Divorced (%)
Ancestries Reported - Arab (%)
Ancestries Reported - Czech (%)
Ancestries Reported - Danish (%)
Ancestries Reported - Dutch (%)
Ancestries Reported - English (%)
Ancestries Reported - French (%)
Ancestries Reported - French Canadian (%)
Ancestries Reported - German (%)
Ancestries Reported - Greek (%)
Ancestries Reported - Hungarian (%)
Ancestries Reported - Irish (%)
Ancestries Reported - Italian (%)
Ancestries Reported - Lithuanian (%)
Ancestries Reported - Norwegian (%)
Ancestries Reported - Polish (%)
Ancestries Reported - Portuguese (%)
Ancestries Reported - Russian (%)
Ancestries Reported - Scotch-Irish (%)
Ancestries Reported - Scottish (%)
Ancestries Reported - Slovak (%)
Ancestries Reported - Subsaharan African (%)
Ancestries Reported - Swedish (%)
Ancestries Reported - Swiss (%)
Ancestries Reported - Ukrainian (%)
Ancestries Reported - United States (%)
Ancestries Reported - Welsh (%)
Ancestries Reported - West Indian (%)
Ancestries Reported - Other (%)
Geographical mobility - Same house 1 year ago (%)
Geographical mobility - Same house 1 year ago (%) - White
Geographical mobility - Same house 1 year ago (%) - Black or African American
Geographical mobility - Same house 1 year ago (%) - Asian
Geographical mobility - Same house 1 year ago (%) - Hispanic or Latino
Geographical mobility - Same house 1 year ago (%) - American Indian and Alaska Native
Geographical mobility - Same house 1 year ago (%) - Multirace
Geographical mobility - Same house 1 year ago (%) - Other Race
Geographical mobility - Moved within same county (%)
Geographical mobility - Moved within same county (%) - White
Geographical mobility - Moved within same county (%) - Black or African American
Geographical mobility - Moved within same county (%) - Asian
Geographical mobility - Moved within same county (%) - Hispanic or Latino
Geographical mobility - Moved within same county (%) - American Indian and Alaska Native
Geographical mobility - Moved within same county (%) - Multirace
Geographical mobility - Moved within same county (%) - Other Race
Geographical mobility - Moved from different county within same state (%)
Geographical mobility - Moved from different county within same state (%) - White
Geographical mobility - Moved from different county within same state (%) - Black or African American
Geographical mobility - Moved from different county within same state (%) - Asian
Geographical mobility - Moved from different county within same state (%) - Hispanic or Latino
Geographical mobility - Moved from different county within same state (%) - American Indian and Alaska Native
Geographical mobility - Moved from different county within same state (%) - Multirace
Geographical mobility - Moved from different county within same state (%) - Other Race
Geographical mobility - Moved from different state (%)
Geographical mobility - Moved from different state (%) - White
Geographical mobility - Moved from different state (%) - Black or African American
Geographical mobility - Moved from different state (%) - Asian
Geographical mobility - Moved from different state (%) - Hispanic or Latino
Geographical mobility - Moved from different state (%) - American Indian and Alaska Native
Geographical mobility - Moved from different state (%) - Multirace
Geographical mobility - Moved from different state (%) - Other Race
Geographical mobility - Moved from abroad (%)
Geographical mobility - Moved from abroad (%) - White
Geographical mobility - Moved from abroad (%) - Black or African American
Geographical mobility - Moved from abroad (%) - Asian
Geographical mobility - Moved from abroad (%) - Hispanic or Latino
Geographical mobility - Moved from abroad (%) - American Indian and Alaska Native
Geographical mobility - Moved from abroad (%) - Multirace
Geographical mobility - Moved from abroad (%) - Other Race
Place of birth for the foreign-born population - Ireland (%)
Place of birth for the foreign-born population - Denmark (%)
Place of birth for the foreign-born population - Norway (%)
Place of birth for the foreign-born population - Sweden (%)
Place of birth for the foreign-born population - United Kingdom (%)
Place of birth for the foreign-born population - England (%)
Place of birth for the foreign-born population - Scotland (%)
Place of birth for the foreign-born population - Other Northern Europe (%)
Place of birth for the foreign-born population - Austria (%)
Place of birth for the foreign-born population - Belgium (%)
Place of birth for the foreign-born population - France (%)
Place of birth for the foreign-born population - Germany (%)
Place of birth for the foreign-born population - Netherlands (%)
Place of birth for the foreign-born population - Switzerland (%)
Place of birth for the foreign-born population - Other Western Europe (%)
Place of birth for the foreign-born population - Greece (%)
Place of birth for the foreign-born population - Italy (%)
Place of birth for the foreign-born population - Portugal (%)
Place of birth for the foreign-born population - Spain (%)
Place of birth for the foreign-born population - Other Southern Europe (%)
Place of birth for the foreign-born population - Albania (%)
Place of birth for the foreign-born population - Belarus (%)
Place of birth for the foreign-born population - Bosnia and Herzegovina (%)
Place of birth for the foreign-born population - Bulgaria (%)
Place of birth for the foreign-born population - Croatia (%)
Place of birth for the foreign-born population - Czechoslovakia (%)
Place of birth for the foreign-born population - Hungary (%)
Place of birth for the foreign-born population - Latvia (%)
Place of birth for the foreign-born population - Lithuania (%)
Place of birth for the foreign-born population - North Macedonia (Macedonia) (%)
Place of birth for the foreign-born population - Moldova (%)
Place of birth for the foreign-born population - Poland (%)
Place of birth for the foreign-born population - Romania (%)
Place of birth for the foreign-born population - Russia (%)
Place of birth for the foreign-born population - Serbia (%)
Place of birth for the foreign-born population - Ukraine (%)
Place of birth for the foreign-born population - Other Eastern Europe (%)
Place of birth for the foreign-born population - China (%)
Place of birth for the foreign-born population - Hong Kong (%)
Place of birth for the foreign-born population - Taiwan (%)
Place of birth for the foreign-born population - Japan (%)
Place of birth for the foreign-born population - Korea (%)
Place of birth for the foreign-born population - Other Eastern Asia (%)
Place of birth for the foreign-born population - Afghanistan (%)
Place of birth for the foreign-born population - Bangladesh (%)
Place of birth for the foreign-born population - India (%)
Place of birth for the foreign-born population - Iran (%)
Place of birth for the foreign-born population - Kazakhstan (%)
Place of birth for the foreign-born population - Nepal (%)
Place of birth for the foreign-born population - Pakistan (%)
Place of birth for the foreign-born population - Sri Lanka (%)
Place of birth for the foreign-born population - Uzbekistan (%)
Place of birth for the foreign-born population - Other South Central Asia (%)
Place of birth for the foreign-born population - Burma (%)
Place of birth for the foreign-born population - Cambodia (%)
Place of birth for the foreign-born population - Indonesia (%)
Place of birth for the foreign-born population - Laos (%)
Place of birth for the foreign-born population - Malaysia (%)
Place of birth for the foreign-born population - Philippines (%)
Place of birth for the foreign-born population - Singapore (%)
Place of birth for the foreign-born population - Thailand (%)
Place of birth for the foreign-born population - Vietnam (%)
Place of birth for the foreign-born population - Other South Eastern Asia (%)
Place of birth for the foreign-born population - Armenia (%)
Place of birth for the foreign-born population - Iraq (%)
Place of birth for the foreign-born population - Israel (%)
Place of birth for the foreign-born population - Jordan (%)
Place of birth for the foreign-born population - Kuwait (%)
Place of birth for the foreign-born population - Lebanon (%)
Place of birth for the foreign-born population - Saudi Arabia (%)
Place of birth for the foreign-born population - Syria (%)
Place of birth for the foreign-born population - Turkey (%)
Place of birth for the foreign-born population - Yemen (%)
Place of birth for the foreign-born population - Other Western Asia (%)
Place of birth for the foreign-born population - Eritrea (%)
Place of birth for the foreign-born population - Ethiopia (%)
Place of birth for the foreign-born population - Kenya (%)
Place of birth for the foreign-born population - Somalia (%)
Place of birth for the foreign-born population - Uganda (%)
Place of birth for the foreign-born population - Zimbabwe (%)
Place of birth for the foreign-born population - Other Eastern Africa (%)
Place of birth for the foreign-born population - Cameroon (%)
Place of birth for the foreign-born population - Congo (%)
Place of birth for the foreign-born population - Democratic Republic of Congo (Zaire) (%)
Place of birth for the foreign-born population - Other Middle Africa (%)
Place of birth for the foreign-born population - Egypt (%)
Place of birth for the foreign-born population - Morocco (%)
Place of birth for the foreign-born population - Sudan (%)
Place of birth for the foreign-born population - Other Northern Africa (%)
Place of birth for the foreign-born population - South Africa (%)
Place of birth for the foreign-born population - Other Southern Africa (%)
Place of birth for the foreign-born population - Cabo Verde (%)
Place of birth for the foreign-born population - Ghana (%)
Place of birth for the foreign-born population - Liberia (%)
Place of birth for the foreign-born population - Nigeria (%)
Place of birth for the foreign-born population - Senegal (%)
Place of birth for the foreign-born population - Sierra Leone (%)
Place of birth for the foreign-born population - Other Western Africa (%)
Place of birth for the foreign-born population - Australia (%)
Place of birth for the foreign-born population - New Zealand (%)
Place of birth for the foreign-born population - Fiji (%)
Place of birth for the foreign-born population - Micronesia (%)
Place of birth for the foreign-born population - Bahamas (%)
Place of birth for the foreign-born population - Barbados (%)
Place of birth for the foreign-born population - Cuba (%)
Place of birth for the foreign-born population - Dominica (%)
Place of birth for the foreign-born population - Dominican Republic (%)
Place of birth for the foreign-born population - Grenada (%)
Place of birth for the foreign-born population - Haiti (%)
Place of birth for the foreign-born population - Jamaica (%)
Place of birth for the foreign-born population - St. Vincent and the Grenadines (%)
Place of birth for the foreign-born population - Trinidad and Tobago (%)
Place of birth for the foreign-born population - West Indies (%)
Place of birth for the foreign-born population - Other Caribbean (%)
Place of birth for the foreign-born population - Belize (%)
Place of birth for the foreign-born population - Costa Rica (%)
Place of birth for the foreign-born population - El Salvador (%)
Place of birth for the foreign-born population - Guatemala (%)
Place of birth for the foreign-born population - Honduras (%)
Place of birth for the foreign-born population - Mexico (%)
Place of birth for the foreign-born population - Nicaragua (%)
Place of birth for the foreign-born population - Panama (%)
Place of birth for the foreign-born population - Other Central America (%)
Place of birth for the foreign-born population - Argentina (%)
Place of birth for the foreign-born population - Bolivia (%)
Place of birth for the foreign-born population - Brazil (%)
Place of birth for the foreign-born population - Chile (%)
Place of birth for the foreign-born population - Colombia (%)
Place of birth for the foreign-born population - Ecuador (%)
Place of birth for the foreign-born population - Guyana (%)
Place of birth for the foreign-born population - Peru (%)
Place of birth for the foreign-born population - Uruguay (%)
Place of birth for the foreign-born population - Venezuela (%)
Place of birth for the foreign-born population - Other South America (%)
Place of birth for the foreign-born population - Canada (%)
Place of birth for the foreign-born population - Other Northern America (%)
Place of birth for the foreign-born population - Other (%)
Latest news about races in Patchogue, NY collected exclusively by city-data.com from local newspapers, TV, and radio stations
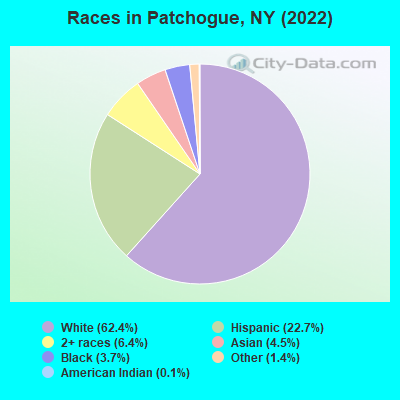
According to 2022 data, the most numerous races in Patchogue, NY are White alone (7,706 residents), Hispanic (2,804 residents), and Black alone (451 residents). 77.3% of Patchogue residents speak English at home. 15.4% of Patchogue, NY residents are foreign-born (11.2% born in Latin America, 1.9% born in Europe, 1.8% born in Asia), which is 42.7% less than the foreign-born rate of 22.0% across the entire state of New York.
Race distribution in Patchogue
2000 2022
11,760,981 62.0% White alone 2,867,583 15.1% Hispanic 2,812,623 14.8% Black alone 1,035,926 5.5% Asian alone 366,116 1.9% Two or more races 75,499 0.4% Other race alone 52,499 0.3% American Indian alone 5,230 0.03% Native Hawaiian and Other
10,408,933 52.9% White alone 3,867,299 19.7% Hispanic 2,633,840 13.4% Black alone 1,776,286 9.0% Asian alone 732,670 3.7% Two or more races 216,110 1.1% Other race alone 35,082 0.2% American Indian alone 6,931 0.04% Native Hawaiian and Other
Income and house value in Patchogue Median household income in 2022 $105,191 White non-Hispanic householders$95,388 Black householders$198,540 Asian householders$80,137 Some other race householders$20,548 Two or more races householders$60,970 Hispanic or Latino race householdersMedian 2022 house value $488,865 White Non-Hispanic householders$714,100 Black or African American householders $621,537 Asian householders$482,009 Some other race householders$498,121 Two or more races householders$500,864 Hispanic or Latino householders
Median age by race in Patchogue
40.8 Median age for White residents40.4 40.9 42.2 Median age for Black or African American residents35.1 44.0 -748,832,865.7 Median age for American Indian / Alaska Native residents-807,017,543.1 -513,692,161.9 35.0 Median age for Asian residents35.6 28.9 -742,816,091.2 Median age for Native Hawaiian / Pacific Islander residents-831,187,409.8 -771,300,447.7 32.7 Median age for Other race residents30.0 36.3 31.1 Median age for Two or more races residents39.4 19.4 40.2 Median age for White alone residents40.1 40.3 35.3 Median age for Hispanic or Latino residents32.1 35.9
Owner/renter occupied households by race in Patchogue
House owners and renters - White residents 2,561 66.1% Owner occupied1,314 33.9% Renter occupiedHouse owners and renters - Black or African American residents 81 36.5% Owner occupied141 63.5% Renter occupiedHouse owners and renters - Asian residents 70 34.3% Owner occupied133 65.7% Renter occupiedHouse owners and renters - Other race residents 85 19.6% Owner occupied350 80.4% Renter occupiedHouse owners and renters - Two or more races residents 208 36.4% Owner occupied363 63.6% Renter occupiedHouse owners and renters - White alone residents 2,469 65.9% Owner occupied1,276 34.1% Renter occupiedHouse owners and renters - Hispanic or Latino residents 227 24.3% Owner occupied707 75.7% Renter occupied
Language usage in Patchogue
English speakers - Total 77.3% of residents of Patchogue speak English at home.
15.6% of residents speak Spanish at home 830 45.7% Speak English very well985 54.3% Speak English less than very well7.3% of residents speak other language at home 766 89.7% Speak English very well88 10.3% Speak English less than very well
English speakers - Born in the United States 89.0% of residents of Patchogue speak English at home.
4.5% of residents speak Spanish at home 48 100.0% Speak English very well6.9% of residents speak other language at home 74 100.0% Speak English very well
English speakers - Native, born elsewhere 41.1% of residents of Patchogue speak English at home.
54.8% of residents speak Spanish at home 123 85.4% Speak English very well21 14.6% Speak English less than very well
English speakers - Foreign-born 17.9% of residents of Patchogue speak English at home.
55.8% of residents speak Spanish at home 257 22.3% Speak English very well895 77.7% Speak English less than very well28.3% of residents speak other language at home 494 84.6% Speak English very well90 15.4% Speak English less than very well
White (Caucasian) - Speak only English Native:
96.7% (7,145)Foreign-born:
22.8% (87)
White (Caucasian) - Speak another language Native:
3.8% (277)Foreign-born:
75.1% (288)
Black or African American - Speak only English Native:
97.0% (237)Foreign-born:
27.0% (81)
Asian - Speak only English Native:
78.3% (360)Foreign-born:
6.5% (9)
Asian - Speak another language Native:
15.7% (72)Foreign-born:
97.0% (132)
Other race - Speak only English Native:
34.0% (182)Foreign-born:
25.4% (231)
Other race - Speak another language Native:
65.3% (350)Foreign-born:
70.5% (640)
Two or more races - Speak another language Native:
24.9% (249)Foreign-born:
100.0% (452)
White alone - Speak only English Native:
97.5% (7,035)Foreign-born:
29.6% (85)
White alone - Speak another language Native:
2.4% (175)Foreign-born:
70.4% (203)
Hispanic or Latino - Speak only English Native:
44.9% (533)Foreign-born:
8.0% (103)
Hispanic or Latino - Speak another language Native:
54.8% (651)Foreign-born:
92.0% (1,190)
Foreign-born residents in Patchogue 1,904 residents are foreign born (11.2% Latin America , 1.9% Europe , 1.8% Asia ).
This city:
15.4%New York:
22.6%
Marital status for residents in Patchogue Marital status - White (Caucasian) population 15 years and over
Males 38.5% Never married43.6% Now married2.0% Separated3.9% Widowed11.9% DivorcedFemales 31.8% Never married41.9% Now married1.6% Separated7.6% Widowed17.3% DivorcedWomen who gave birth in the past 12 months Now married:
49.1% (47)Unmarried:
50.9% (49)
Women who did not give birth in the past 12 months Now married:
43.4% (966)Unmarried:
56.6% (1,259)
Marital status - Black or African American population 15 years and over
Males 39.2% Never married60.8% Now married0.0% Separated0.0% Widowed0.0% DivorcedFemales 52.1% Never married36.2% Now married5.7% Separated0.0% Widowed6.0% DivorcedWomen who did not give birth in the past 12 months Now married:
40.5% (86)Unmarried:
59.5% (127)
Marital status - American Indian / Alaska Native population 15 years and over
Males 0.0% Never married0.0% Now married0.0% Separated0.0% Widowed100.0% DivorcedFemales 100.0% Never married0.0% Now married0.0% Separated0.0% Widowed0.0% DivorcedWomen who did not give birth in the past 12 months Now married:
0.0% (0)Unmarried:
100.0% (36)
Marital status - Asian population 15 years and over
Males 78.0% Never married18.7% Now married0.0% Separated0.0% Widowed3.3% DivorcedFemales 52.8% Never married47.2% Now married0.0% Separated0.0% Widowed0.0% DivorcedWomen who did not give birth in the past 12 months Now married:
32.1% (46)Unmarried:
67.9% (97)
Marital status - Other race population 15 years and over
Males 56.1% Never married31.1% Now married12.8% Separated0.0% Widowed0.0% DivorcedFemales 49.8% Never married30.0% Now married0.0% Separated6.6% Widowed13.7% DivorcedWomen who did not give birth in the past 12 months Now married:
31.3% (136)Unmarried:
68.7% (298)
Marital status - Two or more races population 15 years and over
Males 65.2% Never married30.0% Now married0.0% Separated0.0% Widowed4.8% DivorcedFemales 39.3% Never married31.3% Now married0.0% Separated18.0% Widowed11.4% DivorcedWomen who did not give birth in the past 12 months Now married:
18.6% (56)Unmarried:
81.4% (243)
Marital status - White alone, not Hispanic / Latino population 15 years and over
Males 36.2% Never married44.7% Now married2.2% Separated3.8% Widowed13.0% DivorcedFemales 31.4% Never married40.6% Now married1.7% Separated8.1% Widowed18.2% DivorcedWomen who gave birth in the past 12 months Now married:
49.1% (51)Unmarried:
50.9% (53)
Women who did not give birth in the past 12 months Now married:
41.4% (895)Unmarried:
58.6% (1,268)
Marital status - Hispanic or Latino population 15 years and over
Males 53.8% Never married33.4% Now married6.2% Separated1.5% Widowed5.1% DivorcedFemales 44.6% Never married34.4% Now married0.0% Separated9.9% Widowed11.1% DivorcedWomen who did not give birth in the past 12 months Now married:
38.7% (302)Unmarried:
61.3% (480)
Ancestries in Patchogue
1,292 24.3% Italian343 6.4% European338 6.3% Irish309 5.8% American166 3.1% Haitian154 2.9% German137 2.6% Polish124 2.3% Ghanaian70 1.3% Eastern European37 0.7% English37 0.7% French36 0.7% Egyptian31 0.6% Dutch31 0.6% Russian29 0.5% Iranian28 0.5% Scottish25 0.5% Turkish20 0.4% Scotch-Irish19 0.4% Belgian19 0.4% British8 0.2% Hungarian8 0.2% Scandinavian8 0.2% Welsh
Children Nativity (place of birth) in Patchogue
Children under 6 years - Living with two parents Both parents native 211 100.0% NativeBoth parents foreign-born 10 100.0% NativeOne native, one foreign-born parent 339 100.0% NativeChildren under 6 years - Living with one parent Native parent 66 100.0% NativeForeign-born parent 223 100.0% NativeChildren 6 to 17 years - Living with two parents Both parents native 180 100.0% NativeBoth parents foreign-born 171 100.0% NativeOne native, one foreign-born parent 157 100.0% NativeChildren 6 to 17 years - Living with one parent Native parent 324 87.3% Native47 12.7% Foreign-bornForeign-born parent 205 70.9% Native84 29.1% Foreign-born
Grandparents responsible for own grandchildren in Patchogue
Grandparents (30 to 59 years) White / Caucasian 15 100.0% Responsible for grandchildrenOther race 27 100.0% Not responsible for grandchildrenWhite alone, not Hispanic / Latino 14 100.0% Responsible for grandchildrenHispanic or Latino 28 100.0% Not responsible for grandchildrenGrandparents (60 years and over) White / Caucasian 36 28.2% Responsible for grandchildren92 71.8% Not responsible for grandchildrenWhite alone, not Hispanic / Latino 44 33.6% Responsible for grandchildren87 66.4% Not responsible for grandchildrenHispanic or Latino 46 100.0% Not responsible for grandchildren