Races in Parole, Maryland (MD) Detailed Stats
Data:
Races - White alone (%)
Races - White alone (% change since 2000)
Races - Black alone (%)
Races - Black alone (% change since 2000)
Races - American Indian alone (%)
Races - American Indian alone (% change since 2000)
Races - Asian alone (%)
Races - Asian alone (% change since 2000)
Races - Hispanic (%)
Races - Hispanic (% change since 2000)
Races - Native Hawaiian and Other Pacific Islander alone (%)
Races - Native Hawaiian and Other Pacific Islander alone (% change since 2000)
Races - Two or more races(%)
Races - Two or more races(% change since 2000)
Races - Other race alone (%)
Races - Other race alone (% change since 2000)
Racial diversity
Place of birth - Born in state of residence (%)
Place of birth - Born in state of residence (%) - White
Place of birth - Born in state of residence (%) - Black or African American
Place of birth - Born in state of residence (%) - Asian
Place of birth - Born in state of residence (%) - Hispanic or Latino
Place of birth - Born in state of residence (%) - American Indian and Alaska Native
Place of birth - Born in state of residence (%) - Multirace
Place of birth - Born in state of residence (%) - Other Race
Place of birth - Born in other state (%)
Place of birth - Born in other state (%) - White
Place of birth - Born in other state (%) - Black or African American
Place of birth - Born in other state (%) - Asian
Place of birth - Born in other state (%) - Hispanic or Latino
Place of birth - Born in other state (%) - American Indian and Alaska Native
Place of birth - Born in other state (%) - Multirace
Place of birth - Born in other state (%) - Other Race
Place of birth - Native, outside of US (%)
Place of birth - Native, outside of US (%) - White
Place of birth - Native, outside of US (%) - Black or African American
Place of birth - Native, outside of US (%) - Asian
Place of birth - Native, outside of US (%) - Hispanic or Latino
Place of birth - Native, outside of US (%) - American Indian and Alaska Native
Place of birth - Native, outside of US (%) - Multirace
Place of birth - Native, outside of US (%) - Other Race
Place of birth - Foreign born (%)
Place of birth - Foreign born (%) - White
Place of birth - Foreign born (%) - Black or African American
Place of birth - Foreign born (%) - Asian
Place of birth - Foreign born (%) - Hispanic or Latino
Place of birth - Foreign born (%) - American Indian and Alaska Native
Place of birth - Foreign born (%) - Multirace
Place of birth - Foreign born (%) - Other Race
Residents speaking English at home (%)
Residents speaking English at home - Born in the United States (%)
Residents speaking English at home - Native, born elsewhere (%)
Residents speaking English at home - Foreign born (%)
Residents speaking Spanish at home (%)
Residents speaking Spanish at home - Born in the United States (%)
Residents speaking Spanish at home - Native, born elsewhere (%)
Residents speaking Spanish at home - Foreign born (%)
Residents speaking other language at home (%)
Residents speaking other language at home - Born in the United States (%)
Residents speaking other language at home - Native, born elsewhere (%)
Residents speaking other language at home - Foreign born (%)
Marital status - Never married (%)
Marital status - Now married (%)
Marital status - Separated (%)
Marital status - Widowed (%)
Marital status - Divorced (%)
Ancestries Reported - Arab (%)
Ancestries Reported - Czech (%)
Ancestries Reported - Danish (%)
Ancestries Reported - Dutch (%)
Ancestries Reported - English (%)
Ancestries Reported - French (%)
Ancestries Reported - French Canadian (%)
Ancestries Reported - German (%)
Ancestries Reported - Greek (%)
Ancestries Reported - Hungarian (%)
Ancestries Reported - Irish (%)
Ancestries Reported - Italian (%)
Ancestries Reported - Lithuanian (%)
Ancestries Reported - Norwegian (%)
Ancestries Reported - Polish (%)
Ancestries Reported - Portuguese (%)
Ancestries Reported - Russian (%)
Ancestries Reported - Scotch-Irish (%)
Ancestries Reported - Scottish (%)
Ancestries Reported - Slovak (%)
Ancestries Reported - Subsaharan African (%)
Ancestries Reported - Swedish (%)
Ancestries Reported - Swiss (%)
Ancestries Reported - Ukrainian (%)
Ancestries Reported - United States (%)
Ancestries Reported - Welsh (%)
Ancestries Reported - West Indian (%)
Ancestries Reported - Other (%)
Geographical mobility - Same house 1 year ago (%)
Geographical mobility - Same house 1 year ago (%) - White
Geographical mobility - Same house 1 year ago (%) - Black or African American
Geographical mobility - Same house 1 year ago (%) - Asian
Geographical mobility - Same house 1 year ago (%) - Hispanic or Latino
Geographical mobility - Same house 1 year ago (%) - American Indian and Alaska Native
Geographical mobility - Same house 1 year ago (%) - Multirace
Geographical mobility - Same house 1 year ago (%) - Other Race
Geographical mobility - Moved within same county (%)
Geographical mobility - Moved within same county (%) - White
Geographical mobility - Moved within same county (%) - Black or African American
Geographical mobility - Moved within same county (%) - Asian
Geographical mobility - Moved within same county (%) - Hispanic or Latino
Geographical mobility - Moved within same county (%) - American Indian and Alaska Native
Geographical mobility - Moved within same county (%) - Multirace
Geographical mobility - Moved within same county (%) - Other Race
Geographical mobility - Moved from different county within same state (%)
Geographical mobility - Moved from different county within same state (%) - White
Geographical mobility - Moved from different county within same state (%) - Black or African American
Geographical mobility - Moved from different county within same state (%) - Asian
Geographical mobility - Moved from different county within same state (%) - Hispanic or Latino
Geographical mobility - Moved from different county within same state (%) - American Indian and Alaska Native
Geographical mobility - Moved from different county within same state (%) - Multirace
Geographical mobility - Moved from different county within same state (%) - Other Race
Geographical mobility - Moved from different state (%)
Geographical mobility - Moved from different state (%) - White
Geographical mobility - Moved from different state (%) - Black or African American
Geographical mobility - Moved from different state (%) - Asian
Geographical mobility - Moved from different state (%) - Hispanic or Latino
Geographical mobility - Moved from different state (%) - American Indian and Alaska Native
Geographical mobility - Moved from different state (%) - Multirace
Geographical mobility - Moved from different state (%) - Other Race
Geographical mobility - Moved from abroad (%)
Geographical mobility - Moved from abroad (%) - White
Geographical mobility - Moved from abroad (%) - Black or African American
Geographical mobility - Moved from abroad (%) - Asian
Geographical mobility - Moved from abroad (%) - Hispanic or Latino
Geographical mobility - Moved from abroad (%) - American Indian and Alaska Native
Geographical mobility - Moved from abroad (%) - Multirace
Geographical mobility - Moved from abroad (%) - Other Race
Place of birth for the foreign-born population - Ireland (%)
Place of birth for the foreign-born population - Denmark (%)
Place of birth for the foreign-born population - Norway (%)
Place of birth for the foreign-born population - Sweden (%)
Place of birth for the foreign-born population - United Kingdom (%)
Place of birth for the foreign-born population - England (%)
Place of birth for the foreign-born population - Scotland (%)
Place of birth for the foreign-born population - Other Northern Europe (%)
Place of birth for the foreign-born population - Austria (%)
Place of birth for the foreign-born population - Belgium (%)
Place of birth for the foreign-born population - France (%)
Place of birth for the foreign-born population - Germany (%)
Place of birth for the foreign-born population - Netherlands (%)
Place of birth for the foreign-born population - Switzerland (%)
Place of birth for the foreign-born population - Other Western Europe (%)
Place of birth for the foreign-born population - Greece (%)
Place of birth for the foreign-born population - Italy (%)
Place of birth for the foreign-born population - Portugal (%)
Place of birth for the foreign-born population - Spain (%)
Place of birth for the foreign-born population - Other Southern Europe (%)
Place of birth for the foreign-born population - Albania (%)
Place of birth for the foreign-born population - Belarus (%)
Place of birth for the foreign-born population - Bosnia and Herzegovina (%)
Place of birth for the foreign-born population - Bulgaria (%)
Place of birth for the foreign-born population - Croatia (%)
Place of birth for the foreign-born population - Czechoslovakia (%)
Place of birth for the foreign-born population - Hungary (%)
Place of birth for the foreign-born population - Latvia (%)
Place of birth for the foreign-born population - Lithuania (%)
Place of birth for the foreign-born population - North Macedonia (Macedonia) (%)
Place of birth for the foreign-born population - Moldova (%)
Place of birth for the foreign-born population - Poland (%)
Place of birth for the foreign-born population - Romania (%)
Place of birth for the foreign-born population - Russia (%)
Place of birth for the foreign-born population - Serbia (%)
Place of birth for the foreign-born population - Ukraine (%)
Place of birth for the foreign-born population - Other Eastern Europe (%)
Place of birth for the foreign-born population - China (%)
Place of birth for the foreign-born population - Hong Kong (%)
Place of birth for the foreign-born population - Taiwan (%)
Place of birth for the foreign-born population - Japan (%)
Place of birth for the foreign-born population - Korea (%)
Place of birth for the foreign-born population - Other Eastern Asia (%)
Place of birth for the foreign-born population - Afghanistan (%)
Place of birth for the foreign-born population - Bangladesh (%)
Place of birth for the foreign-born population - India (%)
Place of birth for the foreign-born population - Iran (%)
Place of birth for the foreign-born population - Kazakhstan (%)
Place of birth for the foreign-born population - Nepal (%)
Place of birth for the foreign-born population - Pakistan (%)
Place of birth for the foreign-born population - Sri Lanka (%)
Place of birth for the foreign-born population - Uzbekistan (%)
Place of birth for the foreign-born population - Other South Central Asia (%)
Place of birth for the foreign-born population - Burma (%)
Place of birth for the foreign-born population - Cambodia (%)
Place of birth for the foreign-born population - Indonesia (%)
Place of birth for the foreign-born population - Laos (%)
Place of birth for the foreign-born population - Malaysia (%)
Place of birth for the foreign-born population - Philippines (%)
Place of birth for the foreign-born population - Singapore (%)
Place of birth for the foreign-born population - Thailand (%)
Place of birth for the foreign-born population - Vietnam (%)
Place of birth for the foreign-born population - Other South Eastern Asia (%)
Place of birth for the foreign-born population - Armenia (%)
Place of birth for the foreign-born population - Iraq (%)
Place of birth for the foreign-born population - Israel (%)
Place of birth for the foreign-born population - Jordan (%)
Place of birth for the foreign-born population - Kuwait (%)
Place of birth for the foreign-born population - Lebanon (%)
Place of birth for the foreign-born population - Saudi Arabia (%)
Place of birth for the foreign-born population - Syria (%)
Place of birth for the foreign-born population - Turkey (%)
Place of birth for the foreign-born population - Yemen (%)
Place of birth for the foreign-born population - Other Western Asia (%)
Place of birth for the foreign-born population - Eritrea (%)
Place of birth for the foreign-born population - Ethiopia (%)
Place of birth for the foreign-born population - Kenya (%)
Place of birth for the foreign-born population - Somalia (%)
Place of birth for the foreign-born population - Uganda (%)
Place of birth for the foreign-born population - Zimbabwe (%)
Place of birth for the foreign-born population - Other Eastern Africa (%)
Place of birth for the foreign-born population - Cameroon (%)
Place of birth for the foreign-born population - Congo (%)
Place of birth for the foreign-born population - Democratic Republic of Congo (Zaire) (%)
Place of birth for the foreign-born population - Other Middle Africa (%)
Place of birth for the foreign-born population - Egypt (%)
Place of birth for the foreign-born population - Morocco (%)
Place of birth for the foreign-born population - Sudan (%)
Place of birth for the foreign-born population - Other Northern Africa (%)
Place of birth for the foreign-born population - South Africa (%)
Place of birth for the foreign-born population - Other Southern Africa (%)
Place of birth for the foreign-born population - Cabo Verde (%)
Place of birth for the foreign-born population - Ghana (%)
Place of birth for the foreign-born population - Liberia (%)
Place of birth for the foreign-born population - Nigeria (%)
Place of birth for the foreign-born population - Senegal (%)
Place of birth for the foreign-born population - Sierra Leone (%)
Place of birth for the foreign-born population - Other Western Africa (%)
Place of birth for the foreign-born population - Australia (%)
Place of birth for the foreign-born population - New Zealand (%)
Place of birth for the foreign-born population - Fiji (%)
Place of birth for the foreign-born population - Micronesia (%)
Place of birth for the foreign-born population - Bahamas (%)
Place of birth for the foreign-born population - Barbados (%)
Place of birth for the foreign-born population - Cuba (%)
Place of birth for the foreign-born population - Dominica (%)
Place of birth for the foreign-born population - Dominican Republic (%)
Place of birth for the foreign-born population - Grenada (%)
Place of birth for the foreign-born population - Haiti (%)
Place of birth for the foreign-born population - Jamaica (%)
Place of birth for the foreign-born population - St. Vincent and the Grenadines (%)
Place of birth for the foreign-born population - Trinidad and Tobago (%)
Place of birth for the foreign-born population - West Indies (%)
Place of birth for the foreign-born population - Other Caribbean (%)
Place of birth for the foreign-born population - Belize (%)
Place of birth for the foreign-born population - Costa Rica (%)
Place of birth for the foreign-born population - El Salvador (%)
Place of birth for the foreign-born population - Guatemala (%)
Place of birth for the foreign-born population - Honduras (%)
Place of birth for the foreign-born population - Mexico (%)
Place of birth for the foreign-born population - Nicaragua (%)
Place of birth for the foreign-born population - Panama (%)
Place of birth for the foreign-born population - Other Central America (%)
Place of birth for the foreign-born population - Argentina (%)
Place of birth for the foreign-born population - Bolivia (%)
Place of birth for the foreign-born population - Brazil (%)
Place of birth for the foreign-born population - Chile (%)
Place of birth for the foreign-born population - Colombia (%)
Place of birth for the foreign-born population - Ecuador (%)
Place of birth for the foreign-born population - Guyana (%)
Place of birth for the foreign-born population - Peru (%)
Place of birth for the foreign-born population - Uruguay (%)
Place of birth for the foreign-born population - Venezuela (%)
Place of birth for the foreign-born population - Other South America (%)
Place of birth for the foreign-born population - Canada (%)
Place of birth for the foreign-born population - Other Northern America (%)
Place of birth for the foreign-born population - Other (%)
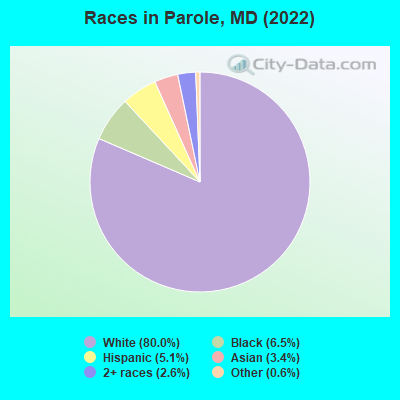
According to 2022 data, the most numerous races in Parole, MD are White alone (14,959 residents), Black alone (1,215 residents), and Hispanic (953 residents). 89.2% of Parole residents speak English at home. 9.3% of Parole, MD residents are foreign-born (3.8% born in Europe, 2.5% born in Asia, 1.4% born in Latin America), which is 71.7% less than the foreign-born rate of 16.0% across the entire state of Maryland.
Race distribution in Parole
2000 2022
3,286,547 62.1% White alone 1,464,735 27.7% Black alone 227,916 4.3% Hispanic 209,738 4.0% Asian alone 82,946 1.6% Two or more races 13,312 0.3% American Indian alone 9,379 0.2% Other race alone 1,913 0.04% Native Hawaiian and Other
2,906,492 47.1% White alone 1,800,914 29.2% Black alone 705,842 11.4% Hispanic 401,818 6.5% Asian alone 291,317 4.7% Two or more races 46,930 0.8% Other race alone 8,930 0.1% American Indian alone 2,417 0.04% Native Hawaiian and Other
Income and house value in Parole Median household income in 2022 $117,937 White non-Hispanic householders$152,077 Black householders$57,195 Some other race householders$93,194 Two or more races householders$81,038 Hispanic or Latino race householdersMedian 2022 house value $568,697 White Non-Hispanic householders$381,373 Black or African American householders$560,477 American Indian or Alaska Native householders $362,940 Asian householders$633,962 Two or more races householders$365,929 Hispanic or Latino householders
Median age by race in Parole
57.2 Median age for White residents53.0 61.8 44.4 Median age for Black or African American residents49.4 43.8 -836,842,104.4 Median age for American Indian / Alaska Native residents-674,418,604.0 -1,072,276,158.6 39.1 Median age for Asian residents33.0 40.7 -534,101,824.6 Median age for Native Hawaiian / Pacific Islander residents-720,061,021.4 -760,942,760.2 28.6 Median age for Other race residents37.0 27.2 35.8 Median age for Two or more races residents33.7 38.3 57.4 Median age for White alone residents52.9 61.6 35.8 Median age for Hispanic or Latino residents35.6 36.3
Owner/renter occupied households by race in Parole
House owners and renters - White residents 5,453 66.5% Owner occupied2,749 33.5% Renter occupiedHouse owners and renters - Black or African American residents 472 69.3% Owner occupied209 30.7% Renter occupiedHouse owners and renters - American Indian / Alaska Native residents 16 100.0% Owner occupiedHouse owners and renters - Asian residents 60 23.8% Owner occupied191 76.2% Renter occupiedHouse owners and renters - Other race residents 35 26.3% Owner occupied99 73.7% Renter occupiedHouse owners and renters - Two or more races residents 78 39.6% Owner occupied120 60.4% Renter occupiedHouse owners and renters - White alone residents 5,462 67.6% Owner occupied2,624 32.4% Renter occupiedHouse owners and renters - Hispanic or Latino residents 100 23.6% Owner occupied323 76.4% Renter occupied
Language usage in Parole
English speakers - Total 89.2% of residents of Parole speak English at home.
4.0% of residents speak Spanish at home 499 68.9% Speak English very well225 31.1% Speak English less than very well6.6% of residents speak other language at home 815 68.3% Speak English very well378 31.7% Speak English less than very well
English speakers - Born in the United States 95.7% of residents of Parole speak English at home.
1.9% of residents speak Spanish at home 183 100.0% Speak English very well2.7% of residents speak other language at home 159 60.7% Speak English very well103 39.3% Speak English less than very well
English speakers - Native, born elsewhere 61.2% of residents of Parole speak English at home.
30.3% of residents speak Spanish at home 93 100.0% Speak English very well9.4% of residents speak other language at home 29 100.0% Speak English very well
English speakers - Foreign-born 35.9% of residents of Parole speak English at home.
11.9% of residents speak Spanish at home 81 40.3% Speak English very well120 59.7% Speak English less than very well48.4% of residents speak other language at home 531 65.0% Speak English very well286 35.0% Speak English less than very well
White (Caucasian) - Speak only English Native:
98.3% (13,737)Foreign-born:
66.3% (360)
White (Caucasian) - Speak another language Native:
1.9% (269)Foreign-born:
40.7% (221)
Black or African American - Speak another language Native:
6.9% (79)Foreign-born:
100.0% (34)
Asian - Speak only English Native:
58.2% (162)Foreign-born:
11.0% (37)
Asian - Speak another language Native:
41.4% (115)Foreign-born:
89.2% (301)
Other race - Speak another language Native:
100.0% (274)Foreign-born:
100.0% (143)
Two or more races - Speak only English Native:
81.6% (393)Foreign-born:
72.1% (127)
Two or more races - Speak another language Native:
17.5% (84)Foreign-born:
47.8% (84)
White alone - Speak only English Native:
98.2% (13,517)Foreign-born:
54.7% (379)
White alone - Speak another language Native:
1.8% (249)Foreign-born:
45.3% (313)
Hispanic or Latino - Speak only English Native:
57.4% (399)Foreign-born:
7.6% (17)
Hispanic or Latino - Speak another language Native:
42.7% (297)Foreign-born:
93.1% (212)
Foreign-born residents in Parole 1,742 residents are foreign born (3.8% Europe , 2.5% Asia , 1.4% Latin America ).
This city:
9.3%Maryland:
15.7%
Marital status for residents in Parole Marital status - White (Caucasian) population 15 years and over
Males 30.5% Never married55.0% Now married0.7% Separated3.1% Widowed10.7% DivorcedFemales 22.9% Never married44.6% Now married1.0% Separated18.5% Widowed13.0% DivorcedWomen who gave birth in the past 12 months Now married:
70.7% (27)Unmarried:
29.3% (11)
Women who did not give birth in the past 12 months Now married:
39.1% (948)Unmarried:
60.9% (1,478)
Marital status - Black or African American population 15 years and over
Males 51.0% Never married27.2% Now married2.2% Separated2.6% Widowed17.1% DivorcedFemales 77.5% Never married7.5% Now married0.0% Separated4.8% Widowed10.3% DivorcedWomen who did not give birth in the past 12 months Now married:
6.1% (26)Unmarried:
93.9% (393)
Marital status - Asian population 15 years and over
Males 24.1% Never married70.8% Now married0.0% Separated0.0% Widowed5.2% DivorcedFemales 27.0% Never married50.6% Now married0.0% Separated9.7% Widowed12.7% DivorcedWomen who did not give birth in the past 12 months Now married:
63.2% (137)Unmarried:
36.8% (80)
Marital status - Other race population 15 years and over
Males 27.4% Never married59.3% Now married0.0% Separated0.0% Widowed13.3% DivorcedFemales 29.8% Never married70.2% Now married0.0% Separated0.0% Widowed0.0% DivorcedWomen who gave birth in the past 12 months Now married:
100.0% (11)Unmarried:
0.0% (0)
Women who did not give birth in the past 12 months Now married:
50.0% (43)Unmarried:
50.0% (43)
Marital status - Two or more races population 15 years and over
Males 65.4% Never married31.6% Now married3.1% Separated0.0% Widowed0.0% DivorcedFemales 10.1% Never married89.9% Now married0.0% Separated0.0% Widowed0.0% DivorcedWomen who did not give birth in the past 12 months Now married:
82.9% (157)Unmarried:
17.1% (33)
Marital status - White alone, not Hispanic / Latino population 15 years and over
Males 31.2% Never married54.0% Now married0.7% Separated3.2% Widowed10.9% DivorcedFemales 22.5% Never married44.6% Now married1.0% Separated18.9% Widowed12.9% DivorcedWomen who gave birth in the past 12 months Now married:
70.7% (28)Unmarried:
29.3% (12)
Women who did not give birth in the past 12 months Now married:
38.3% (886)Unmarried:
61.7% (1,428)
Marital status - Hispanic or Latino population 15 years and over
Males 13.1% Never married83.2% Now married0.0% Separated0.0% Widowed3.7% DivorcedFemales 27.0% Never married63.1% Now married0.0% Separated2.7% Widowed7.1% DivorcedWomen who gave birth in the past 12 months Now married:
100.0% (10)Unmarried:
0.0% (0)
Women who did not give birth in the past 12 months Now married:
58.0% (199)Unmarried:
42.0% (144)
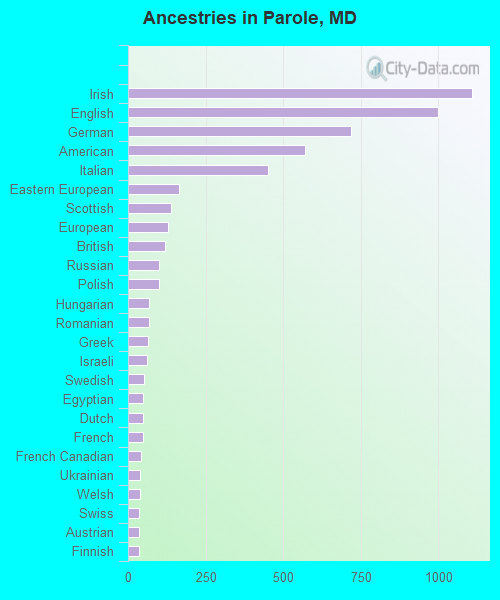
Ancestries in Parole
1,109 14.4% Irish999 12.9% English718 9.3% German571 7.4% American450 5.8% Italian164 2.1% Eastern European138 1.8% Scottish129 1.7% European119 1.5% British101 1.3% Russian101 1.3% Polish69 0.9% Hungarian67 0.9% Romanian64 0.8% Greek61 0.8% Israeli52 0.7% Swedish48 0.6% Egyptian47 0.6% Dutch47 0.6% French42 0.5% French Canadian39 0.5% Ukrainian38 0.5% Welsh36 0.5% Swiss34 0.4% Austrian34 0.4% Finnish33 0.4% Latvian25 0.3% Croatian23 0.3% Northern European22 0.3% Iranian21 0.3% Jamaican18 0.2% Syrian18 0.2% Scotch-Irish16 0.2% Basque16 0.2% African12 0.2% Lebanese11 0.1% Lithuanian8 0.1% Estonian
Children Nativity (place of birth) in Parole
Children under 6 years - Living with two parents Both parents native 285 100.0% NativeBoth parents foreign-born 30 100.0% NativeOne native, one foreign-born parent 100 100.0% NativeChildren under 6 years - Living with one parent Native parent 174 100.0% NativeChildren 6 to 17 years - Living with two parents Both parents native 815 100.0% NativeBoth parents foreign-born 99 82.1% Native21 17.9% Foreign-bornOne native, one foreign-born parent 165 100.0% NativeChildren 6 to 17 years - Living with one parent Native parent 156 100.0% Native
Grandparents responsible for own grandchildren in Parole
Grandparents (30 to 59 years) White / Caucasian 29 100.0% Responsible for grandchildrenWhite alone, not Hispanic / Latino 29 100.0% Responsible for grandchildren
Grandparents (60 years and over) White / Caucasian 24 100.0% Not responsible for grandchildrenWhite alone, not Hispanic / Latino 24 100.0% Not responsible for grandchildren