Races in Palmetto Bay, Florida (FL) Detailed Stats
Data:
Races - White alone (%)
Races - White alone (% change since 2000)
Races - Black alone (%)
Races - Black alone (% change since 2000)
Races - American Indian alone (%)
Races - American Indian alone (% change since 2000)
Races - Asian alone (%)
Races - Asian alone (% change since 2000)
Races - Hispanic (%)
Races - Hispanic (% change since 2000)
Races - Native Hawaiian and Other Pacific Islander alone (%)
Races - Native Hawaiian and Other Pacific Islander alone (% change since 2000)
Races - Two or more races(%)
Races - Two or more races(% change since 2000)
Races - Other race alone (%)
Races - Other race alone (% change since 2000)
Racial diversity
Place of birth - Born in state of residence (%)
Place of birth - Born in state of residence (%) - White
Place of birth - Born in state of residence (%) - Black or African American
Place of birth - Born in state of residence (%) - Asian
Place of birth - Born in state of residence (%) - Hispanic or Latino
Place of birth - Born in state of residence (%) - American Indian and Alaska Native
Place of birth - Born in state of residence (%) - Multirace
Place of birth - Born in state of residence (%) - Other Race
Place of birth - Born in other state (%)
Place of birth - Born in other state (%) - White
Place of birth - Born in other state (%) - Black or African American
Place of birth - Born in other state (%) - Asian
Place of birth - Born in other state (%) - Hispanic or Latino
Place of birth - Born in other state (%) - American Indian and Alaska Native
Place of birth - Born in other state (%) - Multirace
Place of birth - Born in other state (%) - Other Race
Place of birth - Native, outside of US (%)
Place of birth - Native, outside of US (%) - White
Place of birth - Native, outside of US (%) - Black or African American
Place of birth - Native, outside of US (%) - Asian
Place of birth - Native, outside of US (%) - Hispanic or Latino
Place of birth - Native, outside of US (%) - American Indian and Alaska Native
Place of birth - Native, outside of US (%) - Multirace
Place of birth - Native, outside of US (%) - Other Race
Place of birth - Foreign born (%)
Place of birth - Foreign born (%) - White
Place of birth - Foreign born (%) - Black or African American
Place of birth - Foreign born (%) - Asian
Place of birth - Foreign born (%) - Hispanic or Latino
Place of birth - Foreign born (%) - American Indian and Alaska Native
Place of birth - Foreign born (%) - Multirace
Place of birth - Foreign born (%) - Other Race
Residents speaking English at home (%)
Residents speaking English at home - Born in the United States (%)
Residents speaking English at home - Native, born elsewhere (%)
Residents speaking English at home - Foreign born (%)
Residents speaking Spanish at home (%)
Residents speaking Spanish at home - Born in the United States (%)
Residents speaking Spanish at home - Native, born elsewhere (%)
Residents speaking Spanish at home - Foreign born (%)
Residents speaking other language at home (%)
Residents speaking other language at home - Born in the United States (%)
Residents speaking other language at home - Native, born elsewhere (%)
Residents speaking other language at home - Foreign born (%)
Marital status - Never married (%)
Marital status - Now married (%)
Marital status - Separated (%)
Marital status - Widowed (%)
Marital status - Divorced (%)
Ancestries Reported - Arab (%)
Ancestries Reported - Czech (%)
Ancestries Reported - Danish (%)
Ancestries Reported - Dutch (%)
Ancestries Reported - English (%)
Ancestries Reported - French (%)
Ancestries Reported - French Canadian (%)
Ancestries Reported - German (%)
Ancestries Reported - Greek (%)
Ancestries Reported - Hungarian (%)
Ancestries Reported - Irish (%)
Ancestries Reported - Italian (%)
Ancestries Reported - Lithuanian (%)
Ancestries Reported - Norwegian (%)
Ancestries Reported - Polish (%)
Ancestries Reported - Portuguese (%)
Ancestries Reported - Russian (%)
Ancestries Reported - Scotch-Irish (%)
Ancestries Reported - Scottish (%)
Ancestries Reported - Slovak (%)
Ancestries Reported - Subsaharan African (%)
Ancestries Reported - Swedish (%)
Ancestries Reported - Swiss (%)
Ancestries Reported - Ukrainian (%)
Ancestries Reported - United States (%)
Ancestries Reported - Welsh (%)
Ancestries Reported - West Indian (%)
Ancestries Reported - Other (%)
Geographical mobility - Same house 1 year ago (%)
Geographical mobility - Same house 1 year ago (%) - White
Geographical mobility - Same house 1 year ago (%) - Black or African American
Geographical mobility - Same house 1 year ago (%) - Asian
Geographical mobility - Same house 1 year ago (%) - Hispanic or Latino
Geographical mobility - Same house 1 year ago (%) - American Indian and Alaska Native
Geographical mobility - Same house 1 year ago (%) - Multirace
Geographical mobility - Same house 1 year ago (%) - Other Race
Geographical mobility - Moved within same county (%)
Geographical mobility - Moved within same county (%) - White
Geographical mobility - Moved within same county (%) - Black or African American
Geographical mobility - Moved within same county (%) - Asian
Geographical mobility - Moved within same county (%) - Hispanic or Latino
Geographical mobility - Moved within same county (%) - American Indian and Alaska Native
Geographical mobility - Moved within same county (%) - Multirace
Geographical mobility - Moved within same county (%) - Other Race
Geographical mobility - Moved from different county within same state (%)
Geographical mobility - Moved from different county within same state (%) - White
Geographical mobility - Moved from different county within same state (%) - Black or African American
Geographical mobility - Moved from different county within same state (%) - Asian
Geographical mobility - Moved from different county within same state (%) - Hispanic or Latino
Geographical mobility - Moved from different county within same state (%) - American Indian and Alaska Native
Geographical mobility - Moved from different county within same state (%) - Multirace
Geographical mobility - Moved from different county within same state (%) - Other Race
Geographical mobility - Moved from different state (%)
Geographical mobility - Moved from different state (%) - White
Geographical mobility - Moved from different state (%) - Black or African American
Geographical mobility - Moved from different state (%) - Asian
Geographical mobility - Moved from different state (%) - Hispanic or Latino
Geographical mobility - Moved from different state (%) - American Indian and Alaska Native
Geographical mobility - Moved from different state (%) - Multirace
Geographical mobility - Moved from different state (%) - Other Race
Geographical mobility - Moved from abroad (%)
Geographical mobility - Moved from abroad (%) - White
Geographical mobility - Moved from abroad (%) - Black or African American
Geographical mobility - Moved from abroad (%) - Asian
Geographical mobility - Moved from abroad (%) - Hispanic or Latino
Geographical mobility - Moved from abroad (%) - American Indian and Alaska Native
Geographical mobility - Moved from abroad (%) - Multirace
Geographical mobility - Moved from abroad (%) - Other Race
Place of birth for the foreign-born population - Ireland (%)
Place of birth for the foreign-born population - Denmark (%)
Place of birth for the foreign-born population - Norway (%)
Place of birth for the foreign-born population - Sweden (%)
Place of birth for the foreign-born population - United Kingdom (%)
Place of birth for the foreign-born population - England (%)
Place of birth for the foreign-born population - Scotland (%)
Place of birth for the foreign-born population - Other Northern Europe (%)
Place of birth for the foreign-born population - Austria (%)
Place of birth for the foreign-born population - Belgium (%)
Place of birth for the foreign-born population - France (%)
Place of birth for the foreign-born population - Germany (%)
Place of birth for the foreign-born population - Netherlands (%)
Place of birth for the foreign-born population - Switzerland (%)
Place of birth for the foreign-born population - Other Western Europe (%)
Place of birth for the foreign-born population - Greece (%)
Place of birth for the foreign-born population - Italy (%)
Place of birth for the foreign-born population - Portugal (%)
Place of birth for the foreign-born population - Spain (%)
Place of birth for the foreign-born population - Other Southern Europe (%)
Place of birth for the foreign-born population - Albania (%)
Place of birth for the foreign-born population - Belarus (%)
Place of birth for the foreign-born population - Bosnia and Herzegovina (%)
Place of birth for the foreign-born population - Bulgaria (%)
Place of birth for the foreign-born population - Croatia (%)
Place of birth for the foreign-born population - Czechoslovakia (%)
Place of birth for the foreign-born population - Hungary (%)
Place of birth for the foreign-born population - Latvia (%)
Place of birth for the foreign-born population - Lithuania (%)
Place of birth for the foreign-born population - North Macedonia (Macedonia) (%)
Place of birth for the foreign-born population - Moldova (%)
Place of birth for the foreign-born population - Poland (%)
Place of birth for the foreign-born population - Romania (%)
Place of birth for the foreign-born population - Russia (%)
Place of birth for the foreign-born population - Serbia (%)
Place of birth for the foreign-born population - Ukraine (%)
Place of birth for the foreign-born population - Other Eastern Europe (%)
Place of birth for the foreign-born population - China (%)
Place of birth for the foreign-born population - Hong Kong (%)
Place of birth for the foreign-born population - Taiwan (%)
Place of birth for the foreign-born population - Japan (%)
Place of birth for the foreign-born population - Korea (%)
Place of birth for the foreign-born population - Other Eastern Asia (%)
Place of birth for the foreign-born population - Afghanistan (%)
Place of birth for the foreign-born population - Bangladesh (%)
Place of birth for the foreign-born population - India (%)
Place of birth for the foreign-born population - Iran (%)
Place of birth for the foreign-born population - Kazakhstan (%)
Place of birth for the foreign-born population - Nepal (%)
Place of birth for the foreign-born population - Pakistan (%)
Place of birth for the foreign-born population - Sri Lanka (%)
Place of birth for the foreign-born population - Uzbekistan (%)
Place of birth for the foreign-born population - Other South Central Asia (%)
Place of birth for the foreign-born population - Burma (%)
Place of birth for the foreign-born population - Cambodia (%)
Place of birth for the foreign-born population - Indonesia (%)
Place of birth for the foreign-born population - Laos (%)
Place of birth for the foreign-born population - Malaysia (%)
Place of birth for the foreign-born population - Philippines (%)
Place of birth for the foreign-born population - Singapore (%)
Place of birth for the foreign-born population - Thailand (%)
Place of birth for the foreign-born population - Vietnam (%)
Place of birth for the foreign-born population - Other South Eastern Asia (%)
Place of birth for the foreign-born population - Armenia (%)
Place of birth for the foreign-born population - Iraq (%)
Place of birth for the foreign-born population - Israel (%)
Place of birth for the foreign-born population - Jordan (%)
Place of birth for the foreign-born population - Kuwait (%)
Place of birth for the foreign-born population - Lebanon (%)
Place of birth for the foreign-born population - Saudi Arabia (%)
Place of birth for the foreign-born population - Syria (%)
Place of birth for the foreign-born population - Turkey (%)
Place of birth for the foreign-born population - Yemen (%)
Place of birth for the foreign-born population - Other Western Asia (%)
Place of birth for the foreign-born population - Eritrea (%)
Place of birth for the foreign-born population - Ethiopia (%)
Place of birth for the foreign-born population - Kenya (%)
Place of birth for the foreign-born population - Somalia (%)
Place of birth for the foreign-born population - Uganda (%)
Place of birth for the foreign-born population - Zimbabwe (%)
Place of birth for the foreign-born population - Other Eastern Africa (%)
Place of birth for the foreign-born population - Cameroon (%)
Place of birth for the foreign-born population - Congo (%)
Place of birth for the foreign-born population - Democratic Republic of Congo (Zaire) (%)
Place of birth for the foreign-born population - Other Middle Africa (%)
Place of birth for the foreign-born population - Egypt (%)
Place of birth for the foreign-born population - Morocco (%)
Place of birth for the foreign-born population - Sudan (%)
Place of birth for the foreign-born population - Other Northern Africa (%)
Place of birth for the foreign-born population - South Africa (%)
Place of birth for the foreign-born population - Other Southern Africa (%)
Place of birth for the foreign-born population - Cabo Verde (%)
Place of birth for the foreign-born population - Ghana (%)
Place of birth for the foreign-born population - Liberia (%)
Place of birth for the foreign-born population - Nigeria (%)
Place of birth for the foreign-born population - Senegal (%)
Place of birth for the foreign-born population - Sierra Leone (%)
Place of birth for the foreign-born population - Other Western Africa (%)
Place of birth for the foreign-born population - Australia (%)
Place of birth for the foreign-born population - New Zealand (%)
Place of birth for the foreign-born population - Fiji (%)
Place of birth for the foreign-born population - Micronesia (%)
Place of birth for the foreign-born population - Bahamas (%)
Place of birth for the foreign-born population - Barbados (%)
Place of birth for the foreign-born population - Cuba (%)
Place of birth for the foreign-born population - Dominica (%)
Place of birth for the foreign-born population - Dominican Republic (%)
Place of birth for the foreign-born population - Grenada (%)
Place of birth for the foreign-born population - Haiti (%)
Place of birth for the foreign-born population - Jamaica (%)
Place of birth for the foreign-born population - St. Vincent and the Grenadines (%)
Place of birth for the foreign-born population - Trinidad and Tobago (%)
Place of birth for the foreign-born population - West Indies (%)
Place of birth for the foreign-born population - Other Caribbean (%)
Place of birth for the foreign-born population - Belize (%)
Place of birth for the foreign-born population - Costa Rica (%)
Place of birth for the foreign-born population - El Salvador (%)
Place of birth for the foreign-born population - Guatemala (%)
Place of birth for the foreign-born population - Honduras (%)
Place of birth for the foreign-born population - Mexico (%)
Place of birth for the foreign-born population - Nicaragua (%)
Place of birth for the foreign-born population - Panama (%)
Place of birth for the foreign-born population - Other Central America (%)
Place of birth for the foreign-born population - Argentina (%)
Place of birth for the foreign-born population - Bolivia (%)
Place of birth for the foreign-born population - Brazil (%)
Place of birth for the foreign-born population - Chile (%)
Place of birth for the foreign-born population - Colombia (%)
Place of birth for the foreign-born population - Ecuador (%)
Place of birth for the foreign-born population - Guyana (%)
Place of birth for the foreign-born population - Peru (%)
Place of birth for the foreign-born population - Uruguay (%)
Place of birth for the foreign-born population - Venezuela (%)
Place of birth for the foreign-born population - Other South America (%)
Place of birth for the foreign-born population - Canada (%)
Place of birth for the foreign-born population - Other Northern America (%)
Place of birth for the foreign-born population - Other (%)
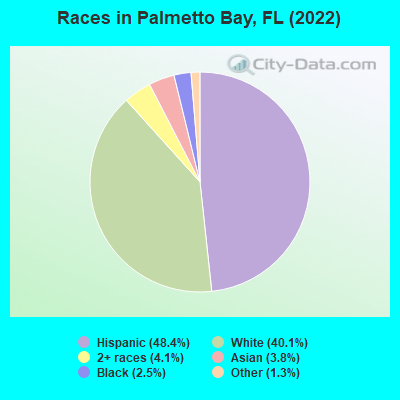
According to 2022 data, the most numerous races in Palmetto Bay, FL are White alone (9,690 residents), Hispanic (11,687 residents), and Black alone (611 residents). 51.2% of Palmetto Bay residents speak English at home.
Race distribution in Palmetto Bay 11,687 48.4% Hispanic 9,690 40.1% White alone 982 4.1% Two or more races 921 3.8% Asian alone 611 2.5% Black alone 305 1.3% Other race alone
2000 2022
10,458,509 65.4% White alone 2,682,715 16.8% Hispanic 2,264,268 14.2% Black alone 261,693 1.6% Asian alone 236,954 1.5% Two or more races 42,358 0.3% American Indian alone 28,994 0.2% Other race alone 6,887 0.04% Native Hawaiian and Other
11,309,403 50.8% White alone 6,025,039 27.1% Hispanic 3,241,015 14.6% Black alone 861,630 3.9% Two or more races 623,692 2.8% Asian alone 152,054 0.7% Other race alone 22,504 0.1% American Indian alone 9,486 0.04% Native Hawaiian and Other
Income and house value in Palmetto Bay Median household income in 2022 $163,975 White non-Hispanic householders$133,090 Two or more races householders$145,391 Hispanic or Latino race householders
Median age by race in Palmetto Bay
38.2 Median age for White residents37.7 38.9 43.1 Median age for Black or African American residents45.9 37.1 42.1 Median age for American Indian / Alaska Native residents35.1 -762,696,213.5 47.0 Median age for Asian residents51.1 45.3 -679,849,340.2 Median age for Native Hawaiian / Pacific Islander residents-858,307,848.3 -443,298,968.6 38.9 Median age for Other race residents27.4 44.9 42.3 Median age for Two or more races residents45.3 41.3 44.9 Median age for White alone residents44.7 45.3 41.0 Median age for Hispanic or Latino residents41.1 41.0
Owner/renter occupied households by race in Palmetto Bay
House owners and renters - White residents 2,754 83.6% Owner occupied541 16.4% Renter occupiedHouse owners and renters - Black or African American residents 149 46.2% Owner occupied173 53.8% Renter occupiedHouse owners and renters - American Indian / Alaska Native residents 76 100.0% Renter occupiedHouse owners and renters - Asian residents 378 96.1% Owner occupied15 3.9% Renter occupiedHouse owners and renters - Other race residents 81 56.4% Owner occupied63 43.6% Renter occupiedHouse owners and renters - Two or more races residents 2,240 71.7% Owner occupied886 28.3% Renter occupiedHouse owners and renters - White alone residents 2,969 88.2% Owner occupied396 11.8% Renter occupiedHouse owners and renters - Hispanic or Latino residents 2,745 69.9% Owner occupied1,184 30.1% Renter occupied
Language usage in Palmetto Bay
English speakers - Total 51.2% of residents of Palmetto Bay speak English at home.
42.3% of residents speak Spanish at home 7,438 77.1% Speak English very well2,212 22.9% Speak English less than very well6.4% of residents speak other language at home 1,243 85.5% Speak English very well210 14.5% Speak English less than very well
English speakers - Born in the United States 73.8% of residents of Palmetto Bay speak English at home.
22.9% of residents speak Spanish at home 1,261 94.9% Speak English very well68 5.1% Speak English less than very well3.0% of residents speak other language at home 176 100.0% Speak English very well
English speakers - Native, born elsewhere 32.1% of residents of Palmetto Bay speak English at home.
65.2% of residents speak Spanish at home 579 81.1% Speak English very well135 18.9% Speak English less than very well3.2% of residents speak other language at home 35 100.0% Speak English very well
English speakers - Foreign-born 18.0% of residents of Palmetto Bay speak English at home.
67.5% of residents speak Spanish at home 2,837 61.6% Speak English very well1,765 38.4% Speak English less than very well14.4% of residents speak other language at home 818 83.1% Speak English very well166 16.9% Speak English less than very well
White (Caucasian) - Speak only English Native:
88.0% (7,904)Foreign-born:
22.3% (307)
White (Caucasian) - Speak another language Native:
23.5% (2,114)Foreign-born:
82.2% (1,130)
Black or African American - Speak only English Native:
82.0% (460)Foreign-born:
64.2% (48)
Black or African American - Speak another language Native:
18.0% (101)Foreign-born:
39.5% (29)
Asian - Speak only English Native:
54.3% (119)Foreign-born:
36.6% (250)
Asian - Speak another language Native:
45.6% (100)Foreign-born:
60.0% (409)
Other race - Speak only English Native:
43.5% (111)Foreign-born:
45.3% (168)
Other race - Speak another language Native:
56.7% (144)Foreign-born:
53.9% (200)
Two or more races - Speak only English Native:
43.2% (1,937)Foreign-born:
10.7% (445)
Two or more races - Speak another language Native:
56.2% (2,519)Foreign-born:
90.2% (3,761)
White alone - Speak only English Native:
90.4% (7,460)Foreign-born:
50.2% (440)
White alone - Speak another language Native:
10.5% (870)Foreign-born:
55.7% (488)
Hispanic or Latino - Speak only English Native:
31.6% (1,988)Foreign-born:
5.0% (243)
Hispanic or Latino - Speak another language Native:
69.0% (4,345)Foreign-born:
95.0% (4,594)
Foreign-born residents in Palmetto Bay
Marital status for residents in Palmetto Bay Marital status - White (Caucasian) population 15 years and over
Males 27.9% Never married60.9% Now married1.1% Separated2.1% Widowed8.0% DivorcedFemales 23.2% Never married61.6% Now married1.0% Separated6.3% Widowed7.9% DivorcedWomen who gave birth in the past 12 months Now married:
94.0% (103)Unmarried:
6.0% (7)
Women who did not give birth in the past 12 months Now married:
52.0% (936)Unmarried:
48.0% (864)
Marital status - Black or African American population 15 years and over
Males 15.6% Never married77.4% Now married0.0% Separated0.3% Widowed6.6% DivorcedFemales 47.6% Never married42.7% Now married0.0% Separated0.0% Widowed9.7% DivorcedWomen who gave birth in the past 12 months Now married:
0.0% (0)Unmarried:
100.0% (8)
Women who did not give birth in the past 12 months Now married:
22.4% (38)Unmarried:
77.6% (132)
Marital status - American Indian / Alaska Native population 15 years and over
Males 2.3% Never married97.7% Now married0.0% Separated0.0% Widowed0.0% DivorcedFemales 50.0% Never married50.0% Now married0.0% Separated0.0% Widowed0.0% DivorcedWomen who did not give birth in the past 12 months Now married:
50.0% (61)Unmarried:
50.0% (61)
Marital status - Asian population 15 years and over
Males 9.7% Never married88.9% Now married0.0% Separated1.3% Widowed0.0% DivorcedFemales 10.9% Never married77.3% Now married0.0% Separated7.5% Widowed4.3% DivorcedWomen who gave birth in the past 12 months Now married:
100.0% (3)Unmarried:
0.0% (0)
Women who did not give birth in the past 12 months Now married:
75.7% (181)Unmarried:
24.3% (58)
Marital status - Other race population 15 years and over
Males 53.5% Never married21.7% Now married7.8% Separated0.0% Widowed17.1% DivorcedFemales 23.0% Never married59.8% Now married9.6% Separated7.7% Widowed0.0% DivorcedWomen who did not give birth in the past 12 months Now married:
61.6% (107)Unmarried:
38.4% (67)
Marital status - Two or more races population 15 years and over
Males 28.8% Never married63.9% Now married1.3% Separated1.8% Widowed4.2% DivorcedFemales 23.2% Never married52.2% Now married1.2% Separated5.4% Widowed18.0% DivorcedWomen who gave birth in the past 12 months Now married:
77.8% (67)Unmarried:
22.2% (19)
Women who did not give birth in the past 12 months Now married:
48.8% (900)Unmarried:
51.2% (943)
Marital status - White alone, not Hispanic / Latino population 15 years and over
Males 22.6% Never married63.1% Now married1.0% Separated2.1% Widowed11.2% DivorcedFemales 20.3% Never married65.1% Now married0.2% Separated7.5% Widowed6.9% DivorcedWomen who gave birth in the past 12 months Now married:
100.0% (135)Unmarried:
0.0% (0)
Women who did not give birth in the past 12 months Now married:
52.2% (893)Unmarried:
47.8% (819)
Marital status - Hispanic or Latino population 15 years and over
Males 31.9% Never married60.4% Now married1.4% Separated2.1% Widowed4.1% DivorcedFemales 26.2% Never married54.2% Now married1.5% Separated5.0% Widowed13.1% DivorcedWomen who gave birth in the past 12 months Now married:
79.5% (91)Unmarried:
20.5% (23)
Women who did not give birth in the past 12 months Now married:
50.2% (1,369)Unmarried:
49.8% (1,360)
Ancestries in Palmetto Bay
954 7.9% American489 4.1% Greek486 4.0% Italian473 3.9% German449 3.7% English446 3.7% Irish137 1.1% Eastern European116 1.0% European115 1.0% Iranian96 0.8% Bulgarian95 0.8% Brazilian89 0.7% African85 0.7% Polish83 0.7% Swedish83 0.7% Russian71 0.6% Scottish63 0.5% Haitian56 0.5% Norwegian55 0.5% Jamaican53 0.4% British50 0.4% French41 0.3% Syrian37 0.3% Canadian30 0.2% Lebanese28 0.2% Ukrainian25 0.2% Austrian24 0.2% Dutch24 0.2% Cypriot23 0.2% French Canadian21 0.2% Swiss21 0.2% Portuguese19 0.2% Guyanese19 0.2% Celtic18 0.1% Romanian13 0.1% Egyptian13 0.1% Jordanian13 0.1% Belgian13 0.1% Hungarian12 0.10% Danish11 0.09% Scotch-Irish10 0.08% Moroccan9 0.07% Palestinian9 0.07% Australian9 0.07% Bermudan8 0.07% Czech6 0.05% Arab
Geographical mobility in Palmetto Bay Same house 1 year ago 7,943 87.2% White (Caucasian)607 89.9% Black or African American248 100.0% American Indian / Alaska Native1,011 100.0% Asian643 93.8% Other race8,311 90.6% Two or more races8,242 87.3% White alone, not Hispanic / Latino10,450 89.6% Hispanic or LatinoMoved within same county 710 7.8% White / Caucasian32 4.7% Black or African American38 5.5% Other race528 5.8% Two or more races853 9.0% White alone, not Hispanic / Latino725 6.2% Hispanic or LatinoMoved within same state 45 0.5% White / Caucasian18 2.6% Black or African American4 0.4% Asian84 0.9% Two or more races18 0.2% White alone, not Hispanic / Latino97 0.8% Hispanic or LatinoMoved from different state 93 1.0% White / Caucasian14 2.1% Black or African American131 1.4% Two or more races73 0.8% White alone, not Hispanic / Latino122 1.0% Hispanic or LatinoMoved from abroad 234 2.6% White29 0.3% Two or more races159 1.7% White alone, not Hispanic / Latino224 1.9% Hispanic or Latino
Children Nativity (place of birth) in Palmetto Bay
Children under 6 years - Living with two parents Both parents native 687 99.9% Native1 0.1% Foreign-bornBoth parents foreign-born 218 82.9% Native45 17.1% Foreign-bornOne native, one foreign-born parent 322 97.4% Native9 2.6% Foreign-bornChildren under 6 years - Living with one parent Native parent 83 100.0% NativeForeign-born parent 64 100.0% NativeChildren 6 to 17 years - Living with two parents Both parents native 2,000 100.0% NativeBoth parents foreign-born 624 73.5% Native225 26.5% Foreign-bornOne native, one foreign-born parent 894 94.0% Native57 6.0% Foreign-bornChildren 6 to 17 years - Living with one parent Native parent 376 100.0% NativeForeign-born parent 256 60.0% Native170 40.0% Foreign-born
Grandparents responsible for own grandchildren in Palmetto Bay
Grandparents (30 to 59 years) White / Caucasian 7 100.0% Not responsible for grandchildrenAsian 25 100.0% Not responsible for grandchildrenHispanic or Latino 11 100.0% Not responsible for grandchildrenGrandparents (60 years and over) White / Caucasian 18 9.9% Responsible for grandchildren165 90.1% Not responsible for grandchildrenHispanic or Latino 110 100.0% Not responsible for grandchildren