Races in Palmer Town, Massachusetts (MA) Detailed Stats
Data:
Races - White alone (%)
Races - White alone (% change since 2000)
Races - Black alone (%)
Races - Black alone (% change since 2000)
Races - American Indian alone (%)
Races - American Indian alone (% change since 2000)
Races - Asian alone (%)
Races - Asian alone (% change since 2000)
Races - Hispanic (%)
Races - Hispanic (% change since 2000)
Races - Native Hawaiian and Other Pacific Islander alone (%)
Races - Native Hawaiian and Other Pacific Islander alone (% change since 2000)
Races - Two or more races(%)
Races - Two or more races(% change since 2000)
Races - Other race alone (%)
Races - Other race alone (% change since 2000)
Racial diversity
Place of birth - Born in state of residence (%)
Place of birth - Born in state of residence (%) - White
Place of birth - Born in state of residence (%) - Black or African American
Place of birth - Born in state of residence (%) - Asian
Place of birth - Born in state of residence (%) - Hispanic or Latino
Place of birth - Born in state of residence (%) - American Indian and Alaska Native
Place of birth - Born in state of residence (%) - Multirace
Place of birth - Born in state of residence (%) - Other Race
Place of birth - Born in other state (%)
Place of birth - Born in other state (%) - White
Place of birth - Born in other state (%) - Black or African American
Place of birth - Born in other state (%) - Asian
Place of birth - Born in other state (%) - Hispanic or Latino
Place of birth - Born in other state (%) - American Indian and Alaska Native
Place of birth - Born in other state (%) - Multirace
Place of birth - Born in other state (%) - Other Race
Place of birth - Native, outside of US (%)
Place of birth - Native, outside of US (%) - White
Place of birth - Native, outside of US (%) - Black or African American
Place of birth - Native, outside of US (%) - Asian
Place of birth - Native, outside of US (%) - Hispanic or Latino
Place of birth - Native, outside of US (%) - American Indian and Alaska Native
Place of birth - Native, outside of US (%) - Multirace
Place of birth - Native, outside of US (%) - Other Race
Place of birth - Foreign born (%)
Place of birth - Foreign born (%) - White
Place of birth - Foreign born (%) - Black or African American
Place of birth - Foreign born (%) - Asian
Place of birth - Foreign born (%) - Hispanic or Latino
Place of birth - Foreign born (%) - American Indian and Alaska Native
Place of birth - Foreign born (%) - Multirace
Place of birth - Foreign born (%) - Other Race
Residents speaking English at home (%)
Residents speaking English at home - Born in the United States (%)
Residents speaking English at home - Native, born elsewhere (%)
Residents speaking English at home - Foreign born (%)
Residents speaking Spanish at home (%)
Residents speaking Spanish at home - Born in the United States (%)
Residents speaking Spanish at home - Native, born elsewhere (%)
Residents speaking Spanish at home - Foreign born (%)
Residents speaking other language at home (%)
Residents speaking other language at home - Born in the United States (%)
Residents speaking other language at home - Native, born elsewhere (%)
Residents speaking other language at home - Foreign born (%)
Marital status - Never married (%)
Marital status - Now married (%)
Marital status - Separated (%)
Marital status - Widowed (%)
Marital status - Divorced (%)
Ancestries Reported - Arab (%)
Ancestries Reported - Czech (%)
Ancestries Reported - Danish (%)
Ancestries Reported - Dutch (%)
Ancestries Reported - English (%)
Ancestries Reported - French (%)
Ancestries Reported - French Canadian (%)
Ancestries Reported - German (%)
Ancestries Reported - Greek (%)
Ancestries Reported - Hungarian (%)
Ancestries Reported - Irish (%)
Ancestries Reported - Italian (%)
Ancestries Reported - Lithuanian (%)
Ancestries Reported - Norwegian (%)
Ancestries Reported - Polish (%)
Ancestries Reported - Portuguese (%)
Ancestries Reported - Russian (%)
Ancestries Reported - Scotch-Irish (%)
Ancestries Reported - Scottish (%)
Ancestries Reported - Slovak (%)
Ancestries Reported - Subsaharan African (%)
Ancestries Reported - Swedish (%)
Ancestries Reported - Swiss (%)
Ancestries Reported - Ukrainian (%)
Ancestries Reported - United States (%)
Ancestries Reported - Welsh (%)
Ancestries Reported - West Indian (%)
Ancestries Reported - Other (%)
Geographical mobility - Same house 1 year ago (%)
Geographical mobility - Same house 1 year ago (%) - White
Geographical mobility - Same house 1 year ago (%) - Black or African American
Geographical mobility - Same house 1 year ago (%) - Asian
Geographical mobility - Same house 1 year ago (%) - Hispanic or Latino
Geographical mobility - Same house 1 year ago (%) - American Indian and Alaska Native
Geographical mobility - Same house 1 year ago (%) - Multirace
Geographical mobility - Same house 1 year ago (%) - Other Race
Geographical mobility - Moved within same county (%)
Geographical mobility - Moved within same county (%) - White
Geographical mobility - Moved within same county (%) - Black or African American
Geographical mobility - Moved within same county (%) - Asian
Geographical mobility - Moved within same county (%) - Hispanic or Latino
Geographical mobility - Moved within same county (%) - American Indian and Alaska Native
Geographical mobility - Moved within same county (%) - Multirace
Geographical mobility - Moved within same county (%) - Other Race
Geographical mobility - Moved from different county within same state (%)
Geographical mobility - Moved from different county within same state (%) - White
Geographical mobility - Moved from different county within same state (%) - Black or African American
Geographical mobility - Moved from different county within same state (%) - Asian
Geographical mobility - Moved from different county within same state (%) - Hispanic or Latino
Geographical mobility - Moved from different county within same state (%) - American Indian and Alaska Native
Geographical mobility - Moved from different county within same state (%) - Multirace
Geographical mobility - Moved from different county within same state (%) - Other Race
Geographical mobility - Moved from different state (%)
Geographical mobility - Moved from different state (%) - White
Geographical mobility - Moved from different state (%) - Black or African American
Geographical mobility - Moved from different state (%) - Asian
Geographical mobility - Moved from different state (%) - Hispanic or Latino
Geographical mobility - Moved from different state (%) - American Indian and Alaska Native
Geographical mobility - Moved from different state (%) - Multirace
Geographical mobility - Moved from different state (%) - Other Race
Geographical mobility - Moved from abroad (%)
Geographical mobility - Moved from abroad (%) - White
Geographical mobility - Moved from abroad (%) - Black or African American
Geographical mobility - Moved from abroad (%) - Asian
Geographical mobility - Moved from abroad (%) - Hispanic or Latino
Geographical mobility - Moved from abroad (%) - American Indian and Alaska Native
Geographical mobility - Moved from abroad (%) - Multirace
Geographical mobility - Moved from abroad (%) - Other Race
Place of birth for the foreign-born population - Ireland (%)
Place of birth for the foreign-born population - Denmark (%)
Place of birth for the foreign-born population - Norway (%)
Place of birth for the foreign-born population - Sweden (%)
Place of birth for the foreign-born population - United Kingdom (%)
Place of birth for the foreign-born population - England (%)
Place of birth for the foreign-born population - Scotland (%)
Place of birth for the foreign-born population - Other Northern Europe (%)
Place of birth for the foreign-born population - Austria (%)
Place of birth for the foreign-born population - Belgium (%)
Place of birth for the foreign-born population - France (%)
Place of birth for the foreign-born population - Germany (%)
Place of birth for the foreign-born population - Netherlands (%)
Place of birth for the foreign-born population - Switzerland (%)
Place of birth for the foreign-born population - Other Western Europe (%)
Place of birth for the foreign-born population - Greece (%)
Place of birth for the foreign-born population - Italy (%)
Place of birth for the foreign-born population - Portugal (%)
Place of birth for the foreign-born population - Spain (%)
Place of birth for the foreign-born population - Other Southern Europe (%)
Place of birth for the foreign-born population - Albania (%)
Place of birth for the foreign-born population - Belarus (%)
Place of birth for the foreign-born population - Bosnia and Herzegovina (%)
Place of birth for the foreign-born population - Bulgaria (%)
Place of birth for the foreign-born population - Croatia (%)
Place of birth for the foreign-born population - Czechoslovakia (%)
Place of birth for the foreign-born population - Hungary (%)
Place of birth for the foreign-born population - Latvia (%)
Place of birth for the foreign-born population - Lithuania (%)
Place of birth for the foreign-born population - North Macedonia (Macedonia) (%)
Place of birth for the foreign-born population - Moldova (%)
Place of birth for the foreign-born population - Poland (%)
Place of birth for the foreign-born population - Romania (%)
Place of birth for the foreign-born population - Russia (%)
Place of birth for the foreign-born population - Serbia (%)
Place of birth for the foreign-born population - Ukraine (%)
Place of birth for the foreign-born population - Other Eastern Europe (%)
Place of birth for the foreign-born population - China (%)
Place of birth for the foreign-born population - Hong Kong (%)
Place of birth for the foreign-born population - Taiwan (%)
Place of birth for the foreign-born population - Japan (%)
Place of birth for the foreign-born population - Korea (%)
Place of birth for the foreign-born population - Other Eastern Asia (%)
Place of birth for the foreign-born population - Afghanistan (%)
Place of birth for the foreign-born population - Bangladesh (%)
Place of birth for the foreign-born population - India (%)
Place of birth for the foreign-born population - Iran (%)
Place of birth for the foreign-born population - Kazakhstan (%)
Place of birth for the foreign-born population - Nepal (%)
Place of birth for the foreign-born population - Pakistan (%)
Place of birth for the foreign-born population - Sri Lanka (%)
Place of birth for the foreign-born population - Uzbekistan (%)
Place of birth for the foreign-born population - Other South Central Asia (%)
Place of birth for the foreign-born population - Burma (%)
Place of birth for the foreign-born population - Cambodia (%)
Place of birth for the foreign-born population - Indonesia (%)
Place of birth for the foreign-born population - Laos (%)
Place of birth for the foreign-born population - Malaysia (%)
Place of birth for the foreign-born population - Philippines (%)
Place of birth for the foreign-born population - Singapore (%)
Place of birth for the foreign-born population - Thailand (%)
Place of birth for the foreign-born population - Vietnam (%)
Place of birth for the foreign-born population - Other South Eastern Asia (%)
Place of birth for the foreign-born population - Armenia (%)
Place of birth for the foreign-born population - Iraq (%)
Place of birth for the foreign-born population - Israel (%)
Place of birth for the foreign-born population - Jordan (%)
Place of birth for the foreign-born population - Kuwait (%)
Place of birth for the foreign-born population - Lebanon (%)
Place of birth for the foreign-born population - Saudi Arabia (%)
Place of birth for the foreign-born population - Syria (%)
Place of birth for the foreign-born population - Turkey (%)
Place of birth for the foreign-born population - Yemen (%)
Place of birth for the foreign-born population - Other Western Asia (%)
Place of birth for the foreign-born population - Eritrea (%)
Place of birth for the foreign-born population - Ethiopia (%)
Place of birth for the foreign-born population - Kenya (%)
Place of birth for the foreign-born population - Somalia (%)
Place of birth for the foreign-born population - Uganda (%)
Place of birth for the foreign-born population - Zimbabwe (%)
Place of birth for the foreign-born population - Other Eastern Africa (%)
Place of birth for the foreign-born population - Cameroon (%)
Place of birth for the foreign-born population - Congo (%)
Place of birth for the foreign-born population - Democratic Republic of Congo (Zaire) (%)
Place of birth for the foreign-born population - Other Middle Africa (%)
Place of birth for the foreign-born population - Egypt (%)
Place of birth for the foreign-born population - Morocco (%)
Place of birth for the foreign-born population - Sudan (%)
Place of birth for the foreign-born population - Other Northern Africa (%)
Place of birth for the foreign-born population - South Africa (%)
Place of birth for the foreign-born population - Other Southern Africa (%)
Place of birth for the foreign-born population - Cabo Verde (%)
Place of birth for the foreign-born population - Ghana (%)
Place of birth for the foreign-born population - Liberia (%)
Place of birth for the foreign-born population - Nigeria (%)
Place of birth for the foreign-born population - Senegal (%)
Place of birth for the foreign-born population - Sierra Leone (%)
Place of birth for the foreign-born population - Other Western Africa (%)
Place of birth for the foreign-born population - Australia (%)
Place of birth for the foreign-born population - New Zealand (%)
Place of birth for the foreign-born population - Fiji (%)
Place of birth for the foreign-born population - Micronesia (%)
Place of birth for the foreign-born population - Bahamas (%)
Place of birth for the foreign-born population - Barbados (%)
Place of birth for the foreign-born population - Cuba (%)
Place of birth for the foreign-born population - Dominica (%)
Place of birth for the foreign-born population - Dominican Republic (%)
Place of birth for the foreign-born population - Grenada (%)
Place of birth for the foreign-born population - Haiti (%)
Place of birth for the foreign-born population - Jamaica (%)
Place of birth for the foreign-born population - St. Vincent and the Grenadines (%)
Place of birth for the foreign-born population - Trinidad and Tobago (%)
Place of birth for the foreign-born population - West Indies (%)
Place of birth for the foreign-born population - Other Caribbean (%)
Place of birth for the foreign-born population - Belize (%)
Place of birth for the foreign-born population - Costa Rica (%)
Place of birth for the foreign-born population - El Salvador (%)
Place of birth for the foreign-born population - Guatemala (%)
Place of birth for the foreign-born population - Honduras (%)
Place of birth for the foreign-born population - Mexico (%)
Place of birth for the foreign-born population - Nicaragua (%)
Place of birth for the foreign-born population - Panama (%)
Place of birth for the foreign-born population - Other Central America (%)
Place of birth for the foreign-born population - Argentina (%)
Place of birth for the foreign-born population - Bolivia (%)
Place of birth for the foreign-born population - Brazil (%)
Place of birth for the foreign-born population - Chile (%)
Place of birth for the foreign-born population - Colombia (%)
Place of birth for the foreign-born population - Ecuador (%)
Place of birth for the foreign-born population - Guyana (%)
Place of birth for the foreign-born population - Peru (%)
Place of birth for the foreign-born population - Uruguay (%)
Place of birth for the foreign-born population - Venezuela (%)
Place of birth for the foreign-born population - Other South America (%)
Place of birth for the foreign-born population - Canada (%)
Place of birth for the foreign-born population - Other Northern America (%)
Place of birth for the foreign-born population - Other (%)
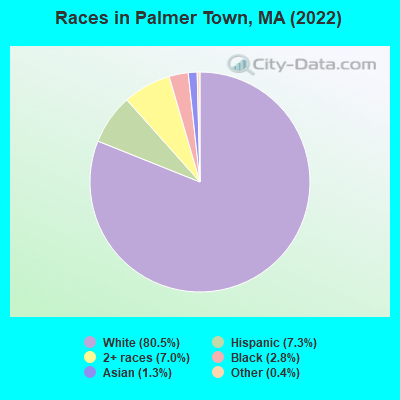
According to 2022 data, the most numerous races in Palmer Town, MA are White alone (9,924 residents), Hispanic (903 residents), and Asian alone (163 residents). 93.1% of Palmer Town residents speak English at home.
Race distribution in Palmer Town 9,924 80.5% White alone 903 7.3% Hispanic 859 7.0% Two or more races 339 2.8% Black alone 163 1.3% Asian alone 47 0.4% Other race alone
2000 2022
5,198,359 81.9% White alone 428,729 6.8% Hispanic 318,329 5.0% Black alone 236,786 3.7% Asian alone 110,338 1.7% Two or more races 43,586 0.7% Other race alone 11,264 0.2% American Indian alone 1,706 0.03% Native Hawaiian and Other
4,676,627 67.0% White alone 911,038 13.0% Hispanic 501,463 7.2% Asian alone 459,740 6.6% Black alone 341,889 4.9% Two or more races 84,403 1.2% Other race alone 5,838 0.08% American Indian alone 976 0.01% Native Hawaiian and Other
Income and house value in Palmer Town Median household income in 2022 $67,023 White non-Hispanic householders$72,747 Black householders$74,631 Two or more races householders$97,096 Hispanic or Latino race householders
Median age by race in Palmer Town
51.9 Median age for White residents55.0 48.4 55.9 Median age for Black or African American residents55.2 43.4 -655,238,094.6 Median age for American Indian / Alaska Native residents-649,474,688.9 -657,223,795.4 24.4 Median age for Asian residents19.8 24.5 -514,227,641.8 Median age for Native Hawaiian / Pacific Islander residents-666,666,666.0 -508,717,948.2 25.8 Median age for Other race residents6.6 25.8 21.1 Median age for Two or more races residents22.6 21.8 49.8 Median age for White alone residents50.4 48.4 28.7 Median age for Hispanic or Latino residents40.0 25.6
Owner/renter occupied households by race in Palmer Town
House owners and renters - White residents 3,275 75.9% Owner occupied1,039 24.1% Renter occupiedHouse owners and renters - Black or African American residents 171 68.7% Owner occupied78 31.3% Renter occupiedHouse owners and renters - Asian residents 14 34.0% Owner occupied28 66.0% Renter occupiedHouse owners and renters - Other race residents 130 75.5% Owner occupied42 24.5% Renter occupiedHouse owners and renters - Two or more races residents 138 44.3% Owner occupied173 55.7% Renter occupiedHouse owners and renters - White alone residents 3,311 71.8% Owner occupied1,301 28.2% Renter occupiedHouse owners and renters - Hispanic or Latino residents 131 52.3% Owner occupied120 47.7% Renter occupied
Language usage in Palmer Town
English speakers - Total 93.1% of residents of Palmer Town speak English at home.
1.9% of residents speak Spanish at home 195 86.3% Speak English very well31 13.7% Speak English less than very well5.3% of residents speak other language at home 418 67.4% Speak English very well202 32.6% Speak English less than very well
English speakers - Born in the United States 96.7% of residents of Palmer Town speak English at home.
3.7% of residents speak other language at home 45 73.8% Speak English very well16 26.2% Speak English less than very well
English speakers - Native, born elsewhere 24.1% of residents of Palmer Town speak English at home.
37.7% of residents speak Spanish at home 149 100.0% Speak English very well51.6% of residents speak other language at home 189 92.6% Speak English very well15 7.4% Speak English less than very well
English speakers - Foreign-born 20.5% of residents of Palmer Town speak English at home.
76.1% of residents speak other language at home 201 60.2% Speak English very well133 39.8% Speak English less than very well
White (Caucasian) - Speak only English Native:
100.0% (8,825)Foreign-born:
17.9% (32)
White (Caucasian) - Speak another language Native:
0.9% (82)Foreign-born:
82.5% (149)
Black or African American - Speak only English Native:
35.1% (99)Foreign-born:
51.4% (26)
Black or African American - Speak another language Native:
54.3% (153)Foreign-born:
48.5% (25)
Asian - Speak only English Native:
80.8% (10)Foreign-born:
17.5% (28)
Asian - Speak another language Native:
26.2% (3)Foreign-born:
82.4% (132)
Two or more races - Speak another language Native:
1.5% (15)Foreign-born:
99.2% (47)
White alone - Speak only English Native:
98.1% (9,199)Foreign-born:
17.4% (34)
White alone - Speak another language Native:
1.5% (137)Foreign-born:
83.3% (163)
Foreign-born residents in Palmer Town
Marital status for residents in Palmer Town Marital status - White (Caucasian) population 15 years and over
Males 30.7% Never married46.2% Now married1.6% Separated5.0% Widowed16.5% DivorcedFemales 24.3% Never married50.2% Now married1.4% Separated6.2% Widowed17.9% DivorcedWomen who gave birth in the past 12 months Now married:
100.0% (196)Unmarried:
0.0% (0)
Women who did not give birth in the past 12 months Now married:
29.7% (477)Unmarried:
70.3% (1,126)
Marital status - Black or African American population 15 years and over
Males 9.6% Never married10.5% Now married0.0% Separated0.0% Widowed79.9% DivorcedFemales 45.3% Never married23.3% Now married0.0% Separated12.8% Widowed18.6% DivorcedWomen who did not give birth in the past 12 months Now married:
33.9% (21)Unmarried:
66.1% (41)
Marital status - Asian population 15 years and over
Males 21.7% Never married78.3% Now married0.0% Separated0.0% Widowed0.0% DivorcedFemales 44.2% Never married55.8% Now married0.0% Separated0.0% Widowed0.0% DivorcedWomen who did not give birth in the past 12 months Now married:
52.8% (39)Unmarried:
47.2% (35)
Marital status - Other race population 15 years and over
Males 73.8% Never married26.2% Now married0.0% Separated0.0% Widowed0.0% DivorcedFemales 24.5% Never married14.7% Now married0.0% Separated24.5% Widowed36.4% DivorcedWomen who gave birth in the past 12 months Now married:
0.0% (0)Unmarried:
100.0% (63)
Women who did not give birth in the past 12 months Now married:
0.0% (0)Unmarried:
100.0% (53)
Marital status - Two or more races population 15 years and over
Males 56.3% Never married20.4% Now married1.6% Separated0.0% Widowed21.7% DivorcedFemales 62.7% Never married28.8% Now married0.0% Separated0.0% Widowed8.6% DivorcedWomen who did not give birth in the past 12 months Now married:
24.7% (97)Unmarried:
75.3% (296)
Marital status - White alone, not Hispanic / Latino population 15 years and over
Males 32.4% Never married44.2% Now married1.3% Separated5.3% Widowed16.9% DivorcedFemales 23.7% Never married50.4% Now married1.5% Separated6.3% Widowed18.1% DivorcedWomen who gave birth in the past 12 months Now married:
100.0% (226)Unmarried:
0.0% (0)
Women who did not give birth in the past 12 months Now married:
29.7% (533)Unmarried:
70.3% (1,260)
Marital status - Hispanic or Latino population 15 years and over
Males 26.8% Never married61.0% Now married5.1% Separated0.0% Widowed7.1% DivorcedFemales 50.9% Never married7.5% Now married0.0% Separated15.4% Widowed26.3% DivorcedWomen who gave birth in the past 12 months Now married:
0.0% (0)Unmarried:
100.0% (48)
Women who did not give birth in the past 12 months Now married:
13.3% (17)Unmarried:
86.7% (112)
Ancestries in Palmer Town
1,710 29.9% American761 13.3% Polish515 9.0% Irish450 7.9% French Canadian322 5.6% English307 5.4% French131 2.3% Portuguese112 2.0% Italian103 1.8% German81 1.4% Scottish53 0.9% Romanian47 0.8% European33 0.6% West Indian24 0.4% Ghanaian16 0.3% Russian15 0.3% Swedish14 0.2% Lebanese8 0.1% Scotch-Irish6 0.1% British6 0.1% Canadian
Children Nativity (place of birth) in Palmer Town
Children under 6 years - Living with two parents Both parents native 325 100.0% NativeChildren under 6 years - Living with one parent Native parent 380 100.0% NativeForeign-born parent 14 100.0% NativeChildren 6 to 17 years - Living with two parents Both parents native 620 100.0% Native0 0.0% Foreign-bornBoth parents foreign-born 12 28.4% Native29 71.6% Foreign-bornOne native, one foreign-born parent 93 100.0% NativeChildren 6 to 17 years - Living with one parent Native parent 644 100.0% Native
Grandparents responsible for own grandchildren in Palmer Town
Grandparents (30 to 59 years) White / Caucasian 15 81.4% Responsible for grandchildren3 18.6% Not responsible for grandchildrenWhite alone, not Hispanic / Latino 24 81.9% Responsible for grandchildren5 18.1% Not responsible for grandchildrenGrandparents (60 years and over) White / Caucasian 22 50.1% Responsible for grandchildren22 49.9% Not responsible for grandchildrenWhite alone, not Hispanic / Latino 21 47.4% Responsible for grandchildren23 52.6% Not responsible for grandchildren