Races in Palm River-East Tampa, Florida (FL) Detailed Stats
Ancestries, Foreign-born residents, place of birth
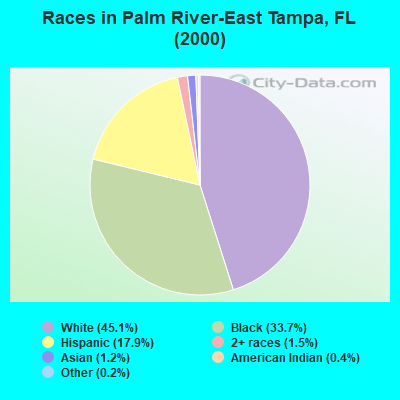
Race distribution in Palm River-East Tampa

- 11,22245.1%White alone
- 8,36833.7%Black alone
- 4,44917.9%Hispanic
- 3811.5%Two or more races
- 2981.2%Asian alone
- 1020.4%American Indian alone
- 400.2%Other race alone
- 60.02%Native Hawaiian and Other
Pacific Islander alone
2000
2022
-
- 10,458,50965.4%White alone
- 2,682,71516.8%Hispanic
- 2,264,26814.2%Black alone
- 261,6931.6%Asian alone
- 236,9541.5%Two or more races
- 42,3580.3%American Indian alone
- 28,9940.2%Other race alone
- 6,8870.04%Native Hawaiian and Other
Pacific Islander alone

-
- 11,309,40350.8%White alone
- 6,025,03927.1%Hispanic
- 3,241,01514.6%Black alone
- 861,6303.9%Two or more races
- 623,6922.8%Asian alone
- 152,0540.7%Other race alone
- 22,5040.1%American Indian alone
- 9,4860.04%Native Hawaiian and Other
Pacific Islander alone

Income and house value in Palm River-East Tampa
- Median household income in 2022
- $77,091White non-Hispanic householders
- $64,756Black householders
- $21,435American Indian and Alaska Native householders
- $98,089Asian householders
- $55,737Some other race householders
- $33,543Two or more races householders
- $66,045Hispanic or Latino race householders
- Median 2022 house value
- $334,526White Non-Hispanic householders
- $255,790Black or African American householders
- $410,864American Indian or Alaska Native householders
- $307,348Asian householders
- $260,586Some other race householders
- $303,351Two or more races householders
- $270,578Hispanic or Latino householders
Household income for White non-Hispanic householders

Household income for Black householders

Household income for American Indian and Alaska Native householders

Household income for Asian householders

Household income for Two or more races householders

Household income for Hispanic or Latino race householders

Zip code: 33619