Races in Palm Coast, Florida (FL) Detailed Stats
Data:
Races - White alone (%)
Races - White alone (% change since 2000)
Races - Black alone (%)
Races - Black alone (% change since 2000)
Races - American Indian alone (%)
Races - American Indian alone (% change since 2000)
Races - Asian alone (%)
Races - Asian alone (% change since 2000)
Races - Hispanic (%)
Races - Hispanic (% change since 2000)
Races - Native Hawaiian and Other Pacific Islander alone (%)
Races - Native Hawaiian and Other Pacific Islander alone (% change since 2000)
Races - Two or more races(%)
Races - Two or more races(% change since 2000)
Races - Other race alone (%)
Races - Other race alone (% change since 2000)
Racial diversity
Place of birth - Born in state of residence (%)
Place of birth - Born in state of residence (%) - White
Place of birth - Born in state of residence (%) - Black or African American
Place of birth - Born in state of residence (%) - Asian
Place of birth - Born in state of residence (%) - Hispanic or Latino
Place of birth - Born in state of residence (%) - American Indian and Alaska Native
Place of birth - Born in state of residence (%) - Multirace
Place of birth - Born in state of residence (%) - Other Race
Place of birth - Born in other state (%)
Place of birth - Born in other state (%) - White
Place of birth - Born in other state (%) - Black or African American
Place of birth - Born in other state (%) - Asian
Place of birth - Born in other state (%) - Hispanic or Latino
Place of birth - Born in other state (%) - American Indian and Alaska Native
Place of birth - Born in other state (%) - Multirace
Place of birth - Born in other state (%) - Other Race
Place of birth - Native, outside of US (%)
Place of birth - Native, outside of US (%) - White
Place of birth - Native, outside of US (%) - Black or African American
Place of birth - Native, outside of US (%) - Asian
Place of birth - Native, outside of US (%) - Hispanic or Latino
Place of birth - Native, outside of US (%) - American Indian and Alaska Native
Place of birth - Native, outside of US (%) - Multirace
Place of birth - Native, outside of US (%) - Other Race
Place of birth - Foreign born (%)
Place of birth - Foreign born (%) - White
Place of birth - Foreign born (%) - Black or African American
Place of birth - Foreign born (%) - Asian
Place of birth - Foreign born (%) - Hispanic or Latino
Place of birth - Foreign born (%) - American Indian and Alaska Native
Place of birth - Foreign born (%) - Multirace
Place of birth - Foreign born (%) - Other Race
Residents speaking English at home (%)
Residents speaking English at home - Born in the United States (%)
Residents speaking English at home - Native, born elsewhere (%)
Residents speaking English at home - Foreign born (%)
Residents speaking Spanish at home (%)
Residents speaking Spanish at home - Born in the United States (%)
Residents speaking Spanish at home - Native, born elsewhere (%)
Residents speaking Spanish at home - Foreign born (%)
Residents speaking other language at home (%)
Residents speaking other language at home - Born in the United States (%)
Residents speaking other language at home - Native, born elsewhere (%)
Residents speaking other language at home - Foreign born (%)
Marital status - Never married (%)
Marital status - Now married (%)
Marital status - Separated (%)
Marital status - Widowed (%)
Marital status - Divorced (%)
Ancestries Reported - Arab (%)
Ancestries Reported - Czech (%)
Ancestries Reported - Danish (%)
Ancestries Reported - Dutch (%)
Ancestries Reported - English (%)
Ancestries Reported - French (%)
Ancestries Reported - French Canadian (%)
Ancestries Reported - German (%)
Ancestries Reported - Greek (%)
Ancestries Reported - Hungarian (%)
Ancestries Reported - Irish (%)
Ancestries Reported - Italian (%)
Ancestries Reported - Lithuanian (%)
Ancestries Reported - Norwegian (%)
Ancestries Reported - Polish (%)
Ancestries Reported - Portuguese (%)
Ancestries Reported - Russian (%)
Ancestries Reported - Scotch-Irish (%)
Ancestries Reported - Scottish (%)
Ancestries Reported - Slovak (%)
Ancestries Reported - Subsaharan African (%)
Ancestries Reported - Swedish (%)
Ancestries Reported - Swiss (%)
Ancestries Reported - Ukrainian (%)
Ancestries Reported - United States (%)
Ancestries Reported - Welsh (%)
Ancestries Reported - West Indian (%)
Ancestries Reported - Other (%)
Geographical mobility - Same house 1 year ago (%)
Geographical mobility - Same house 1 year ago (%) - White
Geographical mobility - Same house 1 year ago (%) - Black or African American
Geographical mobility - Same house 1 year ago (%) - Asian
Geographical mobility - Same house 1 year ago (%) - Hispanic or Latino
Geographical mobility - Same house 1 year ago (%) - American Indian and Alaska Native
Geographical mobility - Same house 1 year ago (%) - Multirace
Geographical mobility - Same house 1 year ago (%) - Other Race
Geographical mobility - Moved within same county (%)
Geographical mobility - Moved within same county (%) - White
Geographical mobility - Moved within same county (%) - Black or African American
Geographical mobility - Moved within same county (%) - Asian
Geographical mobility - Moved within same county (%) - Hispanic or Latino
Geographical mobility - Moved within same county (%) - American Indian and Alaska Native
Geographical mobility - Moved within same county (%) - Multirace
Geographical mobility - Moved within same county (%) - Other Race
Geographical mobility - Moved from different county within same state (%)
Geographical mobility - Moved from different county within same state (%) - White
Geographical mobility - Moved from different county within same state (%) - Black or African American
Geographical mobility - Moved from different county within same state (%) - Asian
Geographical mobility - Moved from different county within same state (%) - Hispanic or Latino
Geographical mobility - Moved from different county within same state (%) - American Indian and Alaska Native
Geographical mobility - Moved from different county within same state (%) - Multirace
Geographical mobility - Moved from different county within same state (%) - Other Race
Geographical mobility - Moved from different state (%)
Geographical mobility - Moved from different state (%) - White
Geographical mobility - Moved from different state (%) - Black or African American
Geographical mobility - Moved from different state (%) - Asian
Geographical mobility - Moved from different state (%) - Hispanic or Latino
Geographical mobility - Moved from different state (%) - American Indian and Alaska Native
Geographical mobility - Moved from different state (%) - Multirace
Geographical mobility - Moved from different state (%) - Other Race
Geographical mobility - Moved from abroad (%)
Geographical mobility - Moved from abroad (%) - White
Geographical mobility - Moved from abroad (%) - Black or African American
Geographical mobility - Moved from abroad (%) - Asian
Geographical mobility - Moved from abroad (%) - Hispanic or Latino
Geographical mobility - Moved from abroad (%) - American Indian and Alaska Native
Geographical mobility - Moved from abroad (%) - Multirace
Geographical mobility - Moved from abroad (%) - Other Race
Place of birth for the foreign-born population - Ireland (%)
Place of birth for the foreign-born population - Denmark (%)
Place of birth for the foreign-born population - Norway (%)
Place of birth for the foreign-born population - Sweden (%)
Place of birth for the foreign-born population - United Kingdom (%)
Place of birth for the foreign-born population - England (%)
Place of birth for the foreign-born population - Scotland (%)
Place of birth for the foreign-born population - Other Northern Europe (%)
Place of birth for the foreign-born population - Austria (%)
Place of birth for the foreign-born population - Belgium (%)
Place of birth for the foreign-born population - France (%)
Place of birth for the foreign-born population - Germany (%)
Place of birth for the foreign-born population - Netherlands (%)
Place of birth for the foreign-born population - Switzerland (%)
Place of birth for the foreign-born population - Other Western Europe (%)
Place of birth for the foreign-born population - Greece (%)
Place of birth for the foreign-born population - Italy (%)
Place of birth for the foreign-born population - Portugal (%)
Place of birth for the foreign-born population - Spain (%)
Place of birth for the foreign-born population - Other Southern Europe (%)
Place of birth for the foreign-born population - Albania (%)
Place of birth for the foreign-born population - Belarus (%)
Place of birth for the foreign-born population - Bosnia and Herzegovina (%)
Place of birth for the foreign-born population - Bulgaria (%)
Place of birth for the foreign-born population - Croatia (%)
Place of birth for the foreign-born population - Czechoslovakia (%)
Place of birth for the foreign-born population - Hungary (%)
Place of birth for the foreign-born population - Latvia (%)
Place of birth for the foreign-born population - Lithuania (%)
Place of birth for the foreign-born population - North Macedonia (Macedonia) (%)
Place of birth for the foreign-born population - Moldova (%)
Place of birth for the foreign-born population - Poland (%)
Place of birth for the foreign-born population - Romania (%)
Place of birth for the foreign-born population - Russia (%)
Place of birth for the foreign-born population - Serbia (%)
Place of birth for the foreign-born population - Ukraine (%)
Place of birth for the foreign-born population - Other Eastern Europe (%)
Place of birth for the foreign-born population - China (%)
Place of birth for the foreign-born population - Hong Kong (%)
Place of birth for the foreign-born population - Taiwan (%)
Place of birth for the foreign-born population - Japan (%)
Place of birth for the foreign-born population - Korea (%)
Place of birth for the foreign-born population - Other Eastern Asia (%)
Place of birth for the foreign-born population - Afghanistan (%)
Place of birth for the foreign-born population - Bangladesh (%)
Place of birth for the foreign-born population - India (%)
Place of birth for the foreign-born population - Iran (%)
Place of birth for the foreign-born population - Kazakhstan (%)
Place of birth for the foreign-born population - Nepal (%)
Place of birth for the foreign-born population - Pakistan (%)
Place of birth for the foreign-born population - Sri Lanka (%)
Place of birth for the foreign-born population - Uzbekistan (%)
Place of birth for the foreign-born population - Other South Central Asia (%)
Place of birth for the foreign-born population - Burma (%)
Place of birth for the foreign-born population - Cambodia (%)
Place of birth for the foreign-born population - Indonesia (%)
Place of birth for the foreign-born population - Laos (%)
Place of birth for the foreign-born population - Malaysia (%)
Place of birth for the foreign-born population - Philippines (%)
Place of birth for the foreign-born population - Singapore (%)
Place of birth for the foreign-born population - Thailand (%)
Place of birth for the foreign-born population - Vietnam (%)
Place of birth for the foreign-born population - Other South Eastern Asia (%)
Place of birth for the foreign-born population - Armenia (%)
Place of birth for the foreign-born population - Iraq (%)
Place of birth for the foreign-born population - Israel (%)
Place of birth for the foreign-born population - Jordan (%)
Place of birth for the foreign-born population - Kuwait (%)
Place of birth for the foreign-born population - Lebanon (%)
Place of birth for the foreign-born population - Saudi Arabia (%)
Place of birth for the foreign-born population - Syria (%)
Place of birth for the foreign-born population - Turkey (%)
Place of birth for the foreign-born population - Yemen (%)
Place of birth for the foreign-born population - Other Western Asia (%)
Place of birth for the foreign-born population - Eritrea (%)
Place of birth for the foreign-born population - Ethiopia (%)
Place of birth for the foreign-born population - Kenya (%)
Place of birth for the foreign-born population - Somalia (%)
Place of birth for the foreign-born population - Uganda (%)
Place of birth for the foreign-born population - Zimbabwe (%)
Place of birth for the foreign-born population - Other Eastern Africa (%)
Place of birth for the foreign-born population - Cameroon (%)
Place of birth for the foreign-born population - Congo (%)
Place of birth for the foreign-born population - Democratic Republic of Congo (Zaire) (%)
Place of birth for the foreign-born population - Other Middle Africa (%)
Place of birth for the foreign-born population - Egypt (%)
Place of birth for the foreign-born population - Morocco (%)
Place of birth for the foreign-born population - Sudan (%)
Place of birth for the foreign-born population - Other Northern Africa (%)
Place of birth for the foreign-born population - South Africa (%)
Place of birth for the foreign-born population - Other Southern Africa (%)
Place of birth for the foreign-born population - Cabo Verde (%)
Place of birth for the foreign-born population - Ghana (%)
Place of birth for the foreign-born population - Liberia (%)
Place of birth for the foreign-born population - Nigeria (%)
Place of birth for the foreign-born population - Senegal (%)
Place of birth for the foreign-born population - Sierra Leone (%)
Place of birth for the foreign-born population - Other Western Africa (%)
Place of birth for the foreign-born population - Australia (%)
Place of birth for the foreign-born population - New Zealand (%)
Place of birth for the foreign-born population - Fiji (%)
Place of birth for the foreign-born population - Micronesia (%)
Place of birth for the foreign-born population - Bahamas (%)
Place of birth for the foreign-born population - Barbados (%)
Place of birth for the foreign-born population - Cuba (%)
Place of birth for the foreign-born population - Dominica (%)
Place of birth for the foreign-born population - Dominican Republic (%)
Place of birth for the foreign-born population - Grenada (%)
Place of birth for the foreign-born population - Haiti (%)
Place of birth for the foreign-born population - Jamaica (%)
Place of birth for the foreign-born population - St. Vincent and the Grenadines (%)
Place of birth for the foreign-born population - Trinidad and Tobago (%)
Place of birth for the foreign-born population - West Indies (%)
Place of birth for the foreign-born population - Other Caribbean (%)
Place of birth for the foreign-born population - Belize (%)
Place of birth for the foreign-born population - Costa Rica (%)
Place of birth for the foreign-born population - El Salvador (%)
Place of birth for the foreign-born population - Guatemala (%)
Place of birth for the foreign-born population - Honduras (%)
Place of birth for the foreign-born population - Mexico (%)
Place of birth for the foreign-born population - Nicaragua (%)
Place of birth for the foreign-born population - Panama (%)
Place of birth for the foreign-born population - Other Central America (%)
Place of birth for the foreign-born population - Argentina (%)
Place of birth for the foreign-born population - Bolivia (%)
Place of birth for the foreign-born population - Brazil (%)
Place of birth for the foreign-born population - Chile (%)
Place of birth for the foreign-born population - Colombia (%)
Place of birth for the foreign-born population - Ecuador (%)
Place of birth for the foreign-born population - Guyana (%)
Place of birth for the foreign-born population - Peru (%)
Place of birth for the foreign-born population - Uruguay (%)
Place of birth for the foreign-born population - Venezuela (%)
Place of birth for the foreign-born population - Other South America (%)
Place of birth for the foreign-born population - Canada (%)
Place of birth for the foreign-born population - Other Northern America (%)
Place of birth for the foreign-born population - Other (%)
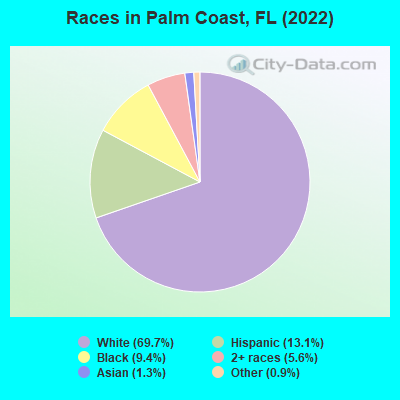
According to 2022 data, the most numerous races in Palm Coast, FL are White alone (68,629 residents), Hispanic (12,892 residents), and Black alone (9,238 residents). 83.0% of Palm Coast residents speak English at home. 14.3% of Palm Coast, FL residents are foreign-born (6.3% born in Latin America, 5.4% born in Europe, 2.4% born in Asia), which is 46.7% less than the foreign-born rate of 21.0% across the entire state of Florida.
Race distribution in Palm Coast
2000 2022
10,458,509 65.4% White alone 2,682,715 16.8% Hispanic 2,264,268 14.2% Black alone 261,693 1.6% Asian alone 236,954 1.5% Two or more races 42,358 0.3% American Indian alone 28,994 0.2% Other race alone 6,887 0.04% Native Hawaiian and Other
11,309,403 50.8% White alone 6,025,039 27.1% Hispanic 3,241,015 14.6% Black alone 861,630 3.9% Two or more races 623,692 2.8% Asian alone 152,054 0.7% Other race alone 22,504 0.1% American Indian alone 9,486 0.04% Native Hawaiian and Other
Income and house value in Palm Coast Median household income in 2022 $71,852 White non-Hispanic householders$57,466 Black householders$54,850 Asian householders$123,125 Some other race householders$61,583 Two or more races householders$58,685 Hispanic or Latino race householdersMedian 2022 house value $345,916 White Non-Hispanic householders$367,903 Black or African American householders$484,034 American Indian or Alaska Native householders $490,228 Asian householders$302,250 Some other race householders$323,619 Two or more races householders$332,909 Hispanic or Latino householders
Median age by race in Palm Coast
55.4 Median age for White residents54.5 57.0 54.6 Median age for Black or African American residents54.9 54.4 -666,666,666.0 Median age for American Indian / Alaska Native residents-666,666,666.0 -666,666,666.0 58.5 Median age for Asian residents-666,666,666.0 56.6 -666,666,666.0 Median age for Native Hawaiian / Pacific Islander residents-666,666,666.0 -666,666,666.0 27.1 Median age for Other race residents28.0 23.9 44.1 Median age for Two or more races residents36.9 45.5 56.9 Median age for White alone residents55.6 58.5 42.5 Median age for Hispanic or Latino residents39.5 44.7
Owner/renter occupied households by race in Palm Coast
House owners and renters - White residents 28,889 86.9% Owner occupied4,357 13.1% Renter occupiedHouse owners and renters - Black or African American residents 2,507 70.0% Owner occupied1,073 30.0% Renter occupiedHouse owners and renters - American Indian / Alaska Native residents 55 100.0% Owner occupiedHouse owners and renters - Asian residents 512 70.6% Owner occupied213 29.4% Renter occupiedHouse owners and renters - Native Hawaiian / Pacific Islander residents 68 100.0% Renter occupiedHouse owners and renters - Other race residents 534 34.4% Owner occupied1,020 65.6% Renter occupiedHouse owners and renters - Two or more races residents 2,862 74.1% Owner occupied1,001 25.9% Renter occupiedHouse owners and renters - White alone residents 28,201 87.8% Owner occupied3,930 12.2% Renter occupiedHouse owners and renters - Hispanic or Latino residents 3,311 71.5% Owner occupied1,322 28.5% Renter occupied
Language usage in Palm Coast
English speakers - Total 83.0% of residents of Palm Coast speak English at home.
9.1% of residents speak Spanish at home 4,685 54.8% Speak English very well3,859 45.2% Speak English less than very well8.0% of residents speak other language at home 3,942 52.4% Speak English very well3,579 47.6% Speak English less than very well
English speakers - Born in the United States 92.7% of residents of Palm Coast speak English at home.
4.7% of residents speak Spanish at home 1,765 62.8% Speak English very well1,047 37.2% Speak English less than very well2.6% of residents speak other language at home 1,103 71.9% Speak English very well432 28.1% Speak English less than very well
English speakers - Native, born elsewhere 47.5% of residents of Palm Coast speak English at home.
47.1% of residents speak Spanish at home 974 80.2% Speak English very well240 19.8% Speak English less than very well5.4% of residents speak other language at home 139 100.0% Speak English less than very well
English speakers - Foreign-born 36.9% of residents of Palm Coast speak English at home.
25.5% of residents speak Spanish at home 1,601 41.4% Speak English very well2,266 58.6% Speak English less than very well37.6% of residents speak other language at home 2,762 48.5% Speak English very well2,938 51.5% Speak English less than very well
White (Caucasian) - Speak only English Native:
95.5% (58,473)Foreign-born:
42.7% (3,425)
White (Caucasian) - Speak another language Native:
4.5% (2,724)Foreign-born:
57.3% (4,594)
Black or African American - Speak only English Native:
96.8% (7,858)Foreign-born:
67.3% (893)
Black or African American - Speak another language Native:
3.1% (248)Foreign-born:
31.3% (415)
Asian - Speak only English Native:
68.7% (508)Foreign-born:
25.1% (436)
Asian - Speak another language Native:
31.6% (234)Foreign-born:
74.8% (1,302)
Other race - Speak only English Native:
22.8% (482)Foreign-born:
16.9% (423)
Other race - Speak another language Native:
77.2% (1,635)Foreign-born:
83.1% (2,079)
Two or more races - Speak only English Native:
72.8% (5,735)Foreign-born:
27.3% (635)
Two or more races - Speak another language Native:
27.2% (2,139)Foreign-born:
72.7% (1,694)
White alone - Speak only English Native:
97.2% (57,318)Foreign-born:
46.0% (3,362)
White alone - Speak another language Native:
2.8% (1,674)Foreign-born:
54.0% (3,944)
Hispanic or Latino - Speak only English Native:
42.6% (3,189)Foreign-born:
12.6% (556)
Hispanic or Latino - Speak another language Native:
57.4% (4,294)Foreign-born:
87.4% (3,867)
Foreign-born residents in Palm Coast 14,055 residents are foreign born (6.3% Latin America , 5.4% Europe , 2.4% Asia ).
This city:
14.3%Florida:
21.1%
Marital status for residents in Palm Coast Marital status - White (Caucasian) population 15 years and over
Males 20.1% Never married65.4% Now married0.0% Separated5.1% Widowed9.4% DivorcedFemales 14.5% Never married57.7% Now married0.2% Separated14.2% Widowed13.3% DivorcedWomen who gave birth in the past 12 months Now married:
100.0% (534)Unmarried:
0.0% (0)
Women who did not give birth in the past 12 months Now married:
52.1% (5,218)Unmarried:
47.9% (4,788)
Marital status - Black or African American population 15 years and over
Males 32.0% Never married48.5% Now married1.9% Separated3.4% Widowed14.2% DivorcedFemales 33.8% Never married40.0% Now married3.2% Separated6.9% Widowed16.1% DivorcedWomen who gave birth in the past 12 months Now married:
29.1% (25)Unmarried:
70.9% (60)
Women who did not give birth in the past 12 months Now married:
46.8% (770)Unmarried:
53.2% (875)
Marital status - American Indian / Alaska Native population 15 years and over
Males 85.7% Never married14.3% Now married0.0% Separated0.0% Widowed0.0% DivorcedFemales 14.5% Never married62.3% Now married0.0% Separated0.0% Widowed23.2% DivorcedWomen who did not give birth in the past 12 months Now married:
23.1% (5)Unmarried:
76.9% (16)
Marital status - Asian population 15 years and over
Males 17.6% Never married62.3% Now married0.0% Separated0.0% Widowed20.1% DivorcedFemales 25.5% Never married60.6% Now married0.0% Separated12.2% Widowed1.7% DivorcedWomen who did not give birth in the past 12 months Now married:
50.6% (330)Unmarried:
49.4% (323)
Marital status - Other race population 15 years and over
Males 34.1% Never married51.6% Now married1.0% Separated0.0% Widowed13.3% DivorcedFemales 23.6% Never married53.9% Now married1.7% Separated13.6% Widowed7.2% DivorcedWomen who did not give birth in the past 12 months Now married:
57.8% (748)Unmarried:
42.2% (546)
Marital status - Two or more races population 15 years and over
Males 32.6% Never married49.1% Now married0.0% Separated0.0% Widowed18.3% DivorcedFemales 23.1% Never married57.3% Now married5.4% Separated3.4% Widowed10.8% DivorcedWomen who gave birth in the past 12 months Now married:
0.0% (0)Unmarried:
100.0% (26)
Women who did not give birth in the past 12 months Now married:
45.6% (962)Unmarried:
54.4% (1,149)
Marital status - White alone, not Hispanic / Latino population 15 years and over
Males 20.0% Never married64.9% Now married0.0% Separated5.3% Widowed9.7% DivorcedFemales 13.4% Never married59.2% Now married0.2% Separated14.8% Widowed12.3% DivorcedWomen who gave birth in the past 12 months Now married:
100.0% (534)Unmarried:
0.0% (0)
Women who did not give birth in the past 12 months Now married:
56.0% (5,138)Unmarried:
44.0% (4,045)
Marital status - Hispanic or Latino population 15 years and over
Males 32.1% Never married62.7% Now married0.0% Separated0.0% Widowed5.2% DivorcedFemales 18.4% Never married60.7% Now married1.6% Separated4.4% Widowed14.8% DivorcedWomen who gave birth in the past 12 months Now married:
48.5% (17)Unmarried:
51.5% (18)
Women who did not give birth in the past 12 months Now married:
47.7% (1,362)Unmarried:
52.3% (1,495)
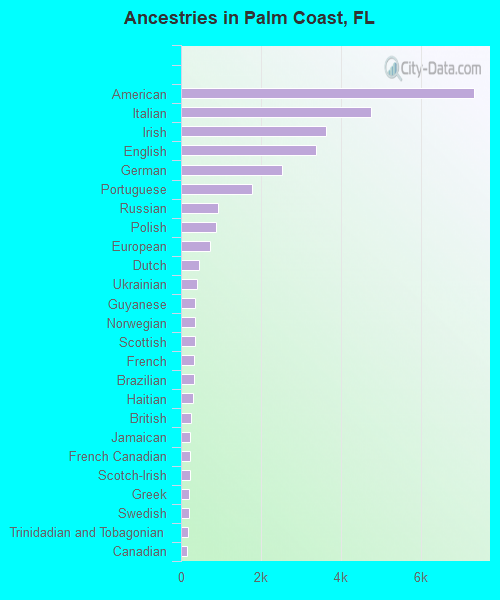
Ancestries in Palm Coast
7,342 15.6% American4,759 10.1% Italian3,640 7.7% Irish3,382 7.2% English2,532 5.4% German1,786 3.8% Portuguese923 2.0% Russian888 1.9% Polish727 1.5% European449 1.0% Dutch390 0.8% Ukrainian362 0.8% Guyanese359 0.8% Norwegian345 0.7% Scottish325 0.7% French316 0.7% Brazilian309 0.7% Haitian245 0.5% British232 0.5% Jamaican229 0.5% French Canadian226 0.5% Scotch-Irish212 0.5% Greek199 0.4% Swedish176 0.4% Trinidadian and Tobagonian162 0.3% Canadian141 0.3% Northern European124 0.3% Slovak107 0.2% Lithuanian85 0.2% Welsh81 0.2% Czech79 0.2% Syrian78 0.2% Yugoslavian75 0.2% African66 0.1% Soviet Union62 0.1% Hungarian56 0.1% Czechoslovakian53 0.1% Eastern European46 0.10% Swiss38 0.08% Albanian36 0.08% Danish35 0.07% Latvian31 0.07% Iranian30 0.06% Pennsylvania German30 0.06% Croatian24 0.05% Armenian24 0.05% Egyptian23 0.05% Scandinavian20 0.04% Cape Verdean19 0.04% Australian17 0.04% Luxembourger15 0.03% Arab14 0.03% Nigerian12 0.03% Turkish11 0.02% West Indian10 0.02% Austrian9 0.02% Belizean7 0.01% Finnish6 0.01% Romanian3 0.01% Slovene
Geographical mobility in Palm Coast Same house 1 year ago 61,825 85.8% White (Caucasian)8,635 90.0% Black or African American175 100.0% American Indian / Alaska Native2,116 84.2% Asian114 100.0% Native Hawaiian / Pacific Islander5,770 92.1% Other race8,988 83.7% Two or more races59,697 87.6% White alone, not Hispanic / Latino9,419 73.1% Hispanic or LatinoMoved within same county 3,004 4.2% White / Caucasian404 4.2% Black or African American18 0.3% Other race895 8.3% Two or more races2,511 3.7% White alone, not Hispanic / Latino1,179 9.1% Hispanic or LatinoMoved within same state 2,412 3.3% White / Caucasian29 0.3% Black or African American122 4.9% Asian72 1.1% Other race1,572 2.3% White alone, not Hispanic / Latino840 6.5% Hispanic or LatinoMoved from different state 4,483 6.2% White / Caucasian555 5.8% Black or African American283 11.2% Asian469 7.5% Other race594 5.5% Two or more races4,040 5.9% White alone, not Hispanic / Latino1,168 9.1% Hispanic or LatinoMoved from abroad 306 0.4% White31 0.3% Black or African American11 0.4% Asian59 0.9% Other race256 2.4% Two or more races306 0.4% White alone, not Hispanic / Latino286 2.2% Hispanic or Latino
Children Nativity (place of birth) in Palm Coast
Children under 6 years - Living with two parents Both parents native 1,657 100.0% NativeBoth parents foreign-born 176 100.0% NativeOne native, one foreign-born parent 484 100.0% NativeChildren under 6 years - Living with one parent Native parent 1,016 99.9% Native1 0.1% Foreign-bornForeign-born parent 179 83.8% Native35 16.2% Foreign-bornChildren 6 to 17 years - Living with two parents Both parents native 6,086 99.6% Native25 0.4% Foreign-bornBoth parents foreign-born 569 75.1% Native188 24.9% Foreign-bornOne native, one foreign-born parent 980 100.0% NativeChildren 6 to 17 years - Living with one parent Native parent 3,125 100.0% NativeForeign-born parent 476 54.3% Native400 45.7% Foreign-born
Place of birth for residents in Palm Coast 6,402 Americas6,036 Latin America5,192 Europe3,062 South America2,281 Asia2,094 Eastern Europe1,958 Caribbean1,790 Southern Europe1,299 South Eastern Asia1,015 Central America728 Western Europe589 South Central Asia424 Northern Europe366 Northern America280 Eastern Asia116 Africa111 Western Asia106 China62 Oceania62 Australia and New Zealand Subregion36 Eastern Africa34 Western Africa29 Northern Africa15 Middle Africa1,286 Portugal893 Colombia781 Philippines764 Russia726 Brazil646 Germany562 Peru534 Cuba528 Guyana493 Poland473 Haiti463 Ukraine389 Jamaica366 Canada347 El Salvador313 Mexico302 Italy282 Trinidad and Tobago260 Kazakhstan228 Thailand219 Vietnam210 United Kingdom187 Dominican Republic174 Guatemala156 Pakistan153 Spain136 Ecuador133 England112 India106 China81 Panama74 Belarus66 Indonesia64 Argentina63 Costa Rica62 Australia55 Barbados51 Korea51 Syria50 Scotland47 Austria47 Greece45 Uruguay45 Venezuela40 Azores Islands34 Lithuania34 France31 Uzbekistan29 Czechoslovakia28 Iran28 Romania25 Moldova22 Nicaragua21 Hungary21 Ireland20 Sierra Leone20 Japan17 Egypt16 Croatia16 Saudi Arabia15 Jordan14 Nigeria14 Georgia12 Turkey12 Belize8 Denmark4 Cambodia
Grandparents responsible for own grandchildren in Palm Coast
Grandparents (30 to 59 years) White / Caucasian 143 43.9% Responsible for grandchildren183 56.1% Not responsible for grandchildrenBlack or African American 102 51.5% Responsible for grandchildren96 48.5% Not responsible for grandchildrenAmerican Indian / Alaska Native 18 100.0% Responsible for grandchildrenAsian 97 49.9% Responsible for grandchildren97 50.1% Not responsible for grandchildrenWhite alone, not Hispanic / Latino 168 49.2% Responsible for grandchildren173 50.8% Not responsible for grandchildrenHispanic or Latino 80 100.0% Not responsible for grandchildrenGrandparents (60 years and over) White / Caucasian 157 34.0% Responsible for grandchildren304 66.0% Not responsible for grandchildrenBlack or African American 26 24.4% Responsible for grandchildren81 75.6% Not responsible for grandchildrenAsian 100 100.0% Not responsible for grandchildrenWhite alone, not Hispanic / Latino 169 47.7% Responsible for grandchildren186 52.3% Not responsible for grandchildrenHispanic or Latino 14 2.0% Responsible for grandchildren664 98.0% Not responsible for grandchildren