Races in Palm Bay, Florida (FL) Detailed Stats
Data:
Races - White alone (%)
Races - White alone (% change since 2000)
Races - Black alone (%)
Races - Black alone (% change since 2000)
Races - American Indian alone (%)
Races - American Indian alone (% change since 2000)
Races - Asian alone (%)
Races - Asian alone (% change since 2000)
Races - Hispanic (%)
Races - Hispanic (% change since 2000)
Races - Native Hawaiian and Other Pacific Islander alone (%)
Races - Native Hawaiian and Other Pacific Islander alone (% change since 2000)
Races - Two or more races(%)
Races - Two or more races(% change since 2000)
Races - Other race alone (%)
Races - Other race alone (% change since 2000)
Racial diversity
Place of birth - Born in state of residence (%)
Place of birth - Born in state of residence (%) - White
Place of birth - Born in state of residence (%) - Black or African American
Place of birth - Born in state of residence (%) - Asian
Place of birth - Born in state of residence (%) - Hispanic or Latino
Place of birth - Born in state of residence (%) - American Indian and Alaska Native
Place of birth - Born in state of residence (%) - Multirace
Place of birth - Born in state of residence (%) - Other Race
Place of birth - Born in other state (%)
Place of birth - Born in other state (%) - White
Place of birth - Born in other state (%) - Black or African American
Place of birth - Born in other state (%) - Asian
Place of birth - Born in other state (%) - Hispanic or Latino
Place of birth - Born in other state (%) - American Indian and Alaska Native
Place of birth - Born in other state (%) - Multirace
Place of birth - Born in other state (%) - Other Race
Place of birth - Native, outside of US (%)
Place of birth - Native, outside of US (%) - White
Place of birth - Native, outside of US (%) - Black or African American
Place of birth - Native, outside of US (%) - Asian
Place of birth - Native, outside of US (%) - Hispanic or Latino
Place of birth - Native, outside of US (%) - American Indian and Alaska Native
Place of birth - Native, outside of US (%) - Multirace
Place of birth - Native, outside of US (%) - Other Race
Place of birth - Foreign born (%)
Place of birth - Foreign born (%) - White
Place of birth - Foreign born (%) - Black or African American
Place of birth - Foreign born (%) - Asian
Place of birth - Foreign born (%) - Hispanic or Latino
Place of birth - Foreign born (%) - American Indian and Alaska Native
Place of birth - Foreign born (%) - Multirace
Place of birth - Foreign born (%) - Other Race
Residents speaking English at home (%)
Residents speaking English at home - Born in the United States (%)
Residents speaking English at home - Native, born elsewhere (%)
Residents speaking English at home - Foreign born (%)
Residents speaking Spanish at home (%)
Residents speaking Spanish at home - Born in the United States (%)
Residents speaking Spanish at home - Native, born elsewhere (%)
Residents speaking Spanish at home - Foreign born (%)
Residents speaking other language at home (%)
Residents speaking other language at home - Born in the United States (%)
Residents speaking other language at home - Native, born elsewhere (%)
Residents speaking other language at home - Foreign born (%)
Marital status - Never married (%)
Marital status - Now married (%)
Marital status - Separated (%)
Marital status - Widowed (%)
Marital status - Divorced (%)
Ancestries Reported - Arab (%)
Ancestries Reported - Czech (%)
Ancestries Reported - Danish (%)
Ancestries Reported - Dutch (%)
Ancestries Reported - English (%)
Ancestries Reported - French (%)
Ancestries Reported - French Canadian (%)
Ancestries Reported - German (%)
Ancestries Reported - Greek (%)
Ancestries Reported - Hungarian (%)
Ancestries Reported - Irish (%)
Ancestries Reported - Italian (%)
Ancestries Reported - Lithuanian (%)
Ancestries Reported - Norwegian (%)
Ancestries Reported - Polish (%)
Ancestries Reported - Portuguese (%)
Ancestries Reported - Russian (%)
Ancestries Reported - Scotch-Irish (%)
Ancestries Reported - Scottish (%)
Ancestries Reported - Slovak (%)
Ancestries Reported - Subsaharan African (%)
Ancestries Reported - Swedish (%)
Ancestries Reported - Swiss (%)
Ancestries Reported - Ukrainian (%)
Ancestries Reported - United States (%)
Ancestries Reported - Welsh (%)
Ancestries Reported - West Indian (%)
Ancestries Reported - Other (%)
Geographical mobility - Same house 1 year ago (%)
Geographical mobility - Same house 1 year ago (%) - White
Geographical mobility - Same house 1 year ago (%) - Black or African American
Geographical mobility - Same house 1 year ago (%) - Asian
Geographical mobility - Same house 1 year ago (%) - Hispanic or Latino
Geographical mobility - Same house 1 year ago (%) - American Indian and Alaska Native
Geographical mobility - Same house 1 year ago (%) - Multirace
Geographical mobility - Same house 1 year ago (%) - Other Race
Geographical mobility - Moved within same county (%)
Geographical mobility - Moved within same county (%) - White
Geographical mobility - Moved within same county (%) - Black or African American
Geographical mobility - Moved within same county (%) - Asian
Geographical mobility - Moved within same county (%) - Hispanic or Latino
Geographical mobility - Moved within same county (%) - American Indian and Alaska Native
Geographical mobility - Moved within same county (%) - Multirace
Geographical mobility - Moved within same county (%) - Other Race
Geographical mobility - Moved from different county within same state (%)
Geographical mobility - Moved from different county within same state (%) - White
Geographical mobility - Moved from different county within same state (%) - Black or African American
Geographical mobility - Moved from different county within same state (%) - Asian
Geographical mobility - Moved from different county within same state (%) - Hispanic or Latino
Geographical mobility - Moved from different county within same state (%) - American Indian and Alaska Native
Geographical mobility - Moved from different county within same state (%) - Multirace
Geographical mobility - Moved from different county within same state (%) - Other Race
Geographical mobility - Moved from different state (%)
Geographical mobility - Moved from different state (%) - White
Geographical mobility - Moved from different state (%) - Black or African American
Geographical mobility - Moved from different state (%) - Asian
Geographical mobility - Moved from different state (%) - Hispanic or Latino
Geographical mobility - Moved from different state (%) - American Indian and Alaska Native
Geographical mobility - Moved from different state (%) - Multirace
Geographical mobility - Moved from different state (%) - Other Race
Geographical mobility - Moved from abroad (%)
Geographical mobility - Moved from abroad (%) - White
Geographical mobility - Moved from abroad (%) - Black or African American
Geographical mobility - Moved from abroad (%) - Asian
Geographical mobility - Moved from abroad (%) - Hispanic or Latino
Geographical mobility - Moved from abroad (%) - American Indian and Alaska Native
Geographical mobility - Moved from abroad (%) - Multirace
Geographical mobility - Moved from abroad (%) - Other Race
Place of birth for the foreign-born population - Ireland (%)
Place of birth for the foreign-born population - Denmark (%)
Place of birth for the foreign-born population - Norway (%)
Place of birth for the foreign-born population - Sweden (%)
Place of birth for the foreign-born population - United Kingdom (%)
Place of birth for the foreign-born population - England (%)
Place of birth for the foreign-born population - Scotland (%)
Place of birth for the foreign-born population - Other Northern Europe (%)
Place of birth for the foreign-born population - Austria (%)
Place of birth for the foreign-born population - Belgium (%)
Place of birth for the foreign-born population - France (%)
Place of birth for the foreign-born population - Germany (%)
Place of birth for the foreign-born population - Netherlands (%)
Place of birth for the foreign-born population - Switzerland (%)
Place of birth for the foreign-born population - Other Western Europe (%)
Place of birth for the foreign-born population - Greece (%)
Place of birth for the foreign-born population - Italy (%)
Place of birth for the foreign-born population - Portugal (%)
Place of birth for the foreign-born population - Spain (%)
Place of birth for the foreign-born population - Other Southern Europe (%)
Place of birth for the foreign-born population - Albania (%)
Place of birth for the foreign-born population - Belarus (%)
Place of birth for the foreign-born population - Bosnia and Herzegovina (%)
Place of birth for the foreign-born population - Bulgaria (%)
Place of birth for the foreign-born population - Croatia (%)
Place of birth for the foreign-born population - Czechoslovakia (%)
Place of birth for the foreign-born population - Hungary (%)
Place of birth for the foreign-born population - Latvia (%)
Place of birth for the foreign-born population - Lithuania (%)
Place of birth for the foreign-born population - North Macedonia (Macedonia) (%)
Place of birth for the foreign-born population - Moldova (%)
Place of birth for the foreign-born population - Poland (%)
Place of birth for the foreign-born population - Romania (%)
Place of birth for the foreign-born population - Russia (%)
Place of birth for the foreign-born population - Serbia (%)
Place of birth for the foreign-born population - Ukraine (%)
Place of birth for the foreign-born population - Other Eastern Europe (%)
Place of birth for the foreign-born population - China (%)
Place of birth for the foreign-born population - Hong Kong (%)
Place of birth for the foreign-born population - Taiwan (%)
Place of birth for the foreign-born population - Japan (%)
Place of birth for the foreign-born population - Korea (%)
Place of birth for the foreign-born population - Other Eastern Asia (%)
Place of birth for the foreign-born population - Afghanistan (%)
Place of birth for the foreign-born population - Bangladesh (%)
Place of birth for the foreign-born population - India (%)
Place of birth for the foreign-born population - Iran (%)
Place of birth for the foreign-born population - Kazakhstan (%)
Place of birth for the foreign-born population - Nepal (%)
Place of birth for the foreign-born population - Pakistan (%)
Place of birth for the foreign-born population - Sri Lanka (%)
Place of birth for the foreign-born population - Uzbekistan (%)
Place of birth for the foreign-born population - Other South Central Asia (%)
Place of birth for the foreign-born population - Burma (%)
Place of birth for the foreign-born population - Cambodia (%)
Place of birth for the foreign-born population - Indonesia (%)
Place of birth for the foreign-born population - Laos (%)
Place of birth for the foreign-born population - Malaysia (%)
Place of birth for the foreign-born population - Philippines (%)
Place of birth for the foreign-born population - Singapore (%)
Place of birth for the foreign-born population - Thailand (%)
Place of birth for the foreign-born population - Vietnam (%)
Place of birth for the foreign-born population - Other South Eastern Asia (%)
Place of birth for the foreign-born population - Armenia (%)
Place of birth for the foreign-born population - Iraq (%)
Place of birth for the foreign-born population - Israel (%)
Place of birth for the foreign-born population - Jordan (%)
Place of birth for the foreign-born population - Kuwait (%)
Place of birth for the foreign-born population - Lebanon (%)
Place of birth for the foreign-born population - Saudi Arabia (%)
Place of birth for the foreign-born population - Syria (%)
Place of birth for the foreign-born population - Turkey (%)
Place of birth for the foreign-born population - Yemen (%)
Place of birth for the foreign-born population - Other Western Asia (%)
Place of birth for the foreign-born population - Eritrea (%)
Place of birth for the foreign-born population - Ethiopia (%)
Place of birth for the foreign-born population - Kenya (%)
Place of birth for the foreign-born population - Somalia (%)
Place of birth for the foreign-born population - Uganda (%)
Place of birth for the foreign-born population - Zimbabwe (%)
Place of birth for the foreign-born population - Other Eastern Africa (%)
Place of birth for the foreign-born population - Cameroon (%)
Place of birth for the foreign-born population - Congo (%)
Place of birth for the foreign-born population - Democratic Republic of Congo (Zaire) (%)
Place of birth for the foreign-born population - Other Middle Africa (%)
Place of birth for the foreign-born population - Egypt (%)
Place of birth for the foreign-born population - Morocco (%)
Place of birth for the foreign-born population - Sudan (%)
Place of birth for the foreign-born population - Other Northern Africa (%)
Place of birth for the foreign-born population - South Africa (%)
Place of birth for the foreign-born population - Other Southern Africa (%)
Place of birth for the foreign-born population - Cabo Verde (%)
Place of birth for the foreign-born population - Ghana (%)
Place of birth for the foreign-born population - Liberia (%)
Place of birth for the foreign-born population - Nigeria (%)
Place of birth for the foreign-born population - Senegal (%)
Place of birth for the foreign-born population - Sierra Leone (%)
Place of birth for the foreign-born population - Other Western Africa (%)
Place of birth for the foreign-born population - Australia (%)
Place of birth for the foreign-born population - New Zealand (%)
Place of birth for the foreign-born population - Fiji (%)
Place of birth for the foreign-born population - Micronesia (%)
Place of birth for the foreign-born population - Bahamas (%)
Place of birth for the foreign-born population - Barbados (%)
Place of birth for the foreign-born population - Cuba (%)
Place of birth for the foreign-born population - Dominica (%)
Place of birth for the foreign-born population - Dominican Republic (%)
Place of birth for the foreign-born population - Grenada (%)
Place of birth for the foreign-born population - Haiti (%)
Place of birth for the foreign-born population - Jamaica (%)
Place of birth for the foreign-born population - St. Vincent and the Grenadines (%)
Place of birth for the foreign-born population - Trinidad and Tobago (%)
Place of birth for the foreign-born population - West Indies (%)
Place of birth for the foreign-born population - Other Caribbean (%)
Place of birth for the foreign-born population - Belize (%)
Place of birth for the foreign-born population - Costa Rica (%)
Place of birth for the foreign-born population - El Salvador (%)
Place of birth for the foreign-born population - Guatemala (%)
Place of birth for the foreign-born population - Honduras (%)
Place of birth for the foreign-born population - Mexico (%)
Place of birth for the foreign-born population - Nicaragua (%)
Place of birth for the foreign-born population - Panama (%)
Place of birth for the foreign-born population - Other Central America (%)
Place of birth for the foreign-born population - Argentina (%)
Place of birth for the foreign-born population - Bolivia (%)
Place of birth for the foreign-born population - Brazil (%)
Place of birth for the foreign-born population - Chile (%)
Place of birth for the foreign-born population - Colombia (%)
Place of birth for the foreign-born population - Ecuador (%)
Place of birth for the foreign-born population - Guyana (%)
Place of birth for the foreign-born population - Peru (%)
Place of birth for the foreign-born population - Uruguay (%)
Place of birth for the foreign-born population - Venezuela (%)
Place of birth for the foreign-born population - Other South America (%)
Place of birth for the foreign-born population - Canada (%)
Place of birth for the foreign-born population - Other Northern America (%)
Place of birth for the foreign-born population - Other (%)
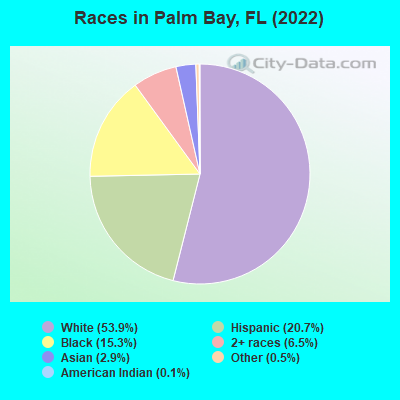
According to 2022 data, the most numerous races in Palm Bay, FL are White alone (69,653 residents), Hispanic (26,803 residents), and Black alone (19,805 residents). 82.3% of Palm Bay residents speak English at home. 14.4% of Palm Bay, FL residents are foreign-born (10.9% born in Latin America), which is 45.6% less than the foreign-born rate of 21.0% across the entire state of Florida.
Race distribution in Palm Bay
2000 2022
60,549 76.2% White alone 8,634 10.9% Black alone 6,850 8.6% Hispanic 1,586 2.0% Two or more races 1,325 1.7% Asian alone 241 0.3% American Indian alone 196 0.2% Other race alone 32 0.04% Native Hawaiian and Other
69,653 53.9% White alone 26,803 20.7% Hispanic 19,805 15.3% Black alone 8,465 6.5% Two or more races 3,723 2.9% Asian alone 659 0.5% Other race alone 138 0.1% American Indian alone
2000 2022
10,458,509 65.4% White alone 2,682,715 16.8% Hispanic 2,264,268 14.2% Black alone 261,693 1.6% Asian alone 236,954 1.5% Two or more races 42,358 0.3% American Indian alone 28,994 0.2% Other race alone 6,887 0.04% Native Hawaiian and Other
11,309,403 50.8% White alone 6,025,039 27.1% Hispanic 3,241,015 14.6% Black alone 861,630 3.9% Two or more races 623,692 2.8% Asian alone 152,054 0.7% Other race alone 22,504 0.1% American Indian alone 9,486 0.04% Native Hawaiian and Other
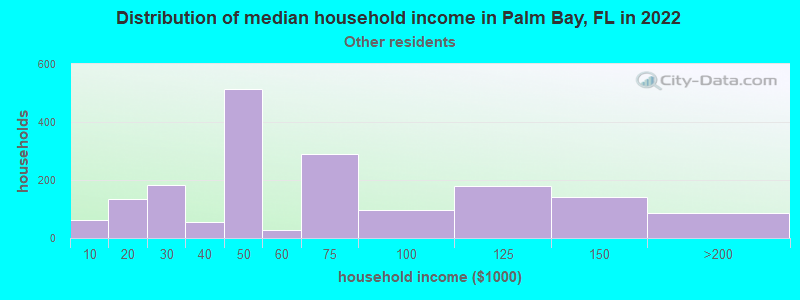
Income and house value in Palm Bay Median household income in 2022 $72,747 White non-Hispanic householders$54,437 Black householders$97,787 Asian householders$57,689 Some other race householders$80,867 Two or more races householders$78,011 Hispanic or Latino race householdersMedian 2022 house value $287,761 White Non-Hispanic householders$311,555 Black or African American householders$278,838 American Indian or Alaska Native householders $313,042 Asian householders$305,235 Some other race householders$289,992 Two or more races householders$295,568 Hispanic or Latino householders
Median age by race in Palm Bay
44.6 Median age for White residents43.9 45.8 37.3 Median age for Black or African American residents32.3 37.6 42.2 Median age for American Indian / Alaska Native residents35.8 41.9 58.5 Median age for Asian residents56.4 61.8 -666,666,666.0 Median age for Native Hawaiian / Pacific Islander residents-666,666,666.0 -666,666,666.0 44.9 Median age for Other race residents48.1 39.7 31.4 Median age for Two or more races residents34.2 28.6 46.1 Median age for White alone residents45.8 46.4 37.2 Median age for Hispanic or Latino residents34.9 38.2
Owner/renter occupied households by race in Palm Bay
House owners and renters - White residents 23,136 80.6% Owner occupied5,553 19.4% Renter occupiedHouse owners and renters - Black or African American residents 4,532 67.1% Owner occupied2,227 32.9% Renter occupiedHouse owners and renters - American Indian / Alaska Native residents 11 15.3% Owner occupied62 84.7% Renter occupiedHouse owners and renters - Asian residents 664 87.6% Owner occupied94 12.4% Renter occupiedHouse owners and renters - Other race residents 1,394 63.3% Owner occupied807 36.7% Renter occupiedHouse owners and renters - Two or more races residents 4,493 86.5% Owner occupied702 13.5% Renter occupiedHouse owners and renters - White alone residents 21,523 80.8% Owner occupied5,116 19.2% Renter occupiedHouse owners and renters - Hispanic or Latino residents 6,528 79.4% Owner occupied1,690 20.6% Renter occupied
Language usage in Palm Bay
English speakers - Total 82.3% of residents of Palm Bay speak English at home.
12.6% of residents speak Spanish at home 9,230 60.4% Speak English very well6,054 39.6% Speak English less than very well5.2% of residents speak other language at home 4,324 69.0% Speak English very well1,943 31.0% Speak English less than very well
English speakers - Born in the United States 92.1% of residents of Palm Bay speak English at home.
7.5% of residents speak Spanish at home 3,760 83.6% Speak English very well740 16.4% Speak English less than very well0.4% of residents speak other language at home 252 100.0% Speak English very well
English speakers - Native, born elsewhere 43.6% of residents of Palm Bay speak English at home.
53.9% of residents speak Spanish at home 1,586 52.4% Speak English very well1,439 47.6% Speak English less than very well2.5% of residents speak other language at home 98 69.0% Speak English very well44 31.0% Speak English less than very well
English speakers - Foreign-born 34.2% of residents of Palm Bay speak English at home.
33.7% of residents speak Spanish at home 2,770 44.8% Speak English very well3,412 55.2% Speak English less than very well32.0% of residents speak other language at home 3,974 67.7% Speak English very well1,899 32.3% Speak English less than very well
White (Caucasian) - Speak only English Native:
95.4% (68,293)Foreign-born:
40.0% (850)
White (Caucasian) - Speak another language Native:
4.6% (3,321)Foreign-born:
60.0% (1,277)
Black or African American - Speak only English Native:
98.1% (11,683)Foreign-born:
54.0% (3,794)
Black or African American - Speak another language Native:
1.9% (229)Foreign-born:
46.0% (3,231)
American Indian / Alaska Native - Speak another language Native:
56.5% (135)Foreign-born:
100.0% (169)
Asian - Speak only English Native:
81.9% (481)Foreign-born:
22.4% (706)
Asian - Speak another language Native:
18.1% (106)Foreign-born:
77.6% (2,451)
Other race - Speak only English Native:
49.2% (1,866)Foreign-born:
5.7% (100)
Other race - Speak another language Native:
50.8% (1,923)Foreign-born:
94.3% (1,667)
Two or more races - Speak only English Native:
75.8% (11,060)Foreign-born:
23.1% (826)
Two or more races - Speak another language Native:
24.2% (3,537)Foreign-born:
76.9% (2,752)
White alone - Speak only English Native:
99.2% (62,273)Foreign-born:
55.3% (1,038)
White alone - Speak another language Native:
1.0% (600)Foreign-born:
44.6% (838)
Hispanic or Latino - Speak only English Native:
52.7% (9,524)Foreign-born:
10.9% (709)
Hispanic or Latino - Speak another language Native:
47.3% (8,542)Foreign-born:
89.1% (5,783)
Foreign-born residents in Palm Bay 18,097 residents are foreign born (10.9% Latin America ).
This city:
14.4%Florida:
21.1%
Marital status for residents in Palm Bay Marital status - White (Caucasian) population 15 years and over
Males 31.2% Never married51.5% Now married1.2% Separated2.4% Widowed13.7% DivorcedFemales 27.2% Never married51.1% Now married0.0% Separated8.2% Widowed13.6% DivorcedWomen who gave birth in the past 12 months Now married:
37.9% (278)Unmarried:
62.1% (456)
Women who did not give birth in the past 12 months Now married:
41.5% (6,226)Unmarried:
58.5% (8,768)
Marital status - Black or African American population 15 years and over
Males 44.2% Never married47.5% Now married2.0% Separated0.0% Widowed6.4% DivorcedFemales 29.8% Never married37.2% Now married0.0% Separated14.4% Widowed18.5% DivorcedWomen who gave birth in the past 12 months Now married:
39.9% (193)Unmarried:
60.1% (291)
Women who did not give birth in the past 12 months Now married:
36.2% (1,501)Unmarried:
63.8% (2,650)
Marital status - American Indian / Alaska Native population 15 years and over
Males 36.9% Never married63.1% Now married0.0% Separated0.0% Widowed0.0% DivorcedFemales 32.3% Never married37.6% Now married30.1% Separated0.0% Widowed0.0% DivorcedWomen who did not give birth in the past 12 months Now married:
39.3% (36)Unmarried:
60.7% (56)
Marital status - Asian population 15 years and over
Males 31.0% Never married51.3% Now married0.0% Separated1.0% Widowed16.8% DivorcedFemales 19.1% Never married63.6% Now married0.5% Separated9.8% Widowed7.1% DivorcedWomen who gave birth in the past 12 months Now married:
100.0% (52)Unmarried:
0.0% (0)
Women who did not give birth in the past 12 months Now married:
51.9% (277)Unmarried:
48.1% (256)
Marital status - Other race population 15 years and over
Males 39.7% Never married30.8% Now married0.0% Separated5.1% Widowed24.4% DivorcedFemales 29.2% Never married24.6% Now married0.0% Separated3.0% Widowed43.2% DivorcedWomen who did not give birth in the past 12 months Now married:
39.4% (585)Unmarried:
60.6% (902)
Marital status - Two or more races population 15 years and over
Males 40.7% Never married44.8% Now married1.3% Separated0.0% Widowed13.2% DivorcedFemales 47.6% Never married34.1% Now married2.1% Separated9.0% Widowed7.3% DivorcedWomen who gave birth in the past 12 months Now married:
50.0% (65)Unmarried:
50.0% (65)
Women who did not give birth in the past 12 months Now married:
29.1% (1,685)Unmarried:
70.9% (4,107)
Marital status - White alone, not Hispanic / Latino population 15 years and over
Males 30.3% Never married50.5% Now married1.1% Separated2.7% Widowed15.4% DivorcedFemales 25.6% Never married51.2% Now married0.0% Separated8.7% Widowed14.5% DivorcedWomen who gave birth in the past 12 months Now married:
37.9% (278)Unmarried:
62.1% (456)
Women who did not give birth in the past 12 months Now married:
44.4% (6,106)Unmarried:
55.6% (7,644)
Marital status - Hispanic or Latino population 15 years and over
Males 37.6% Never married48.9% Now married0.6% Separated1.3% Widowed11.6% DivorcedFemales 35.8% Never married43.6% Now married0.0% Separated9.0% Widowed11.6% DivorcedWomen who gave birth in the past 12 months Now married:
59.1% (43)Unmarried:
40.9% (30)
Women who did not give birth in the past 12 months Now married:
39.7% (2,175)Unmarried:
60.3% (3,298)
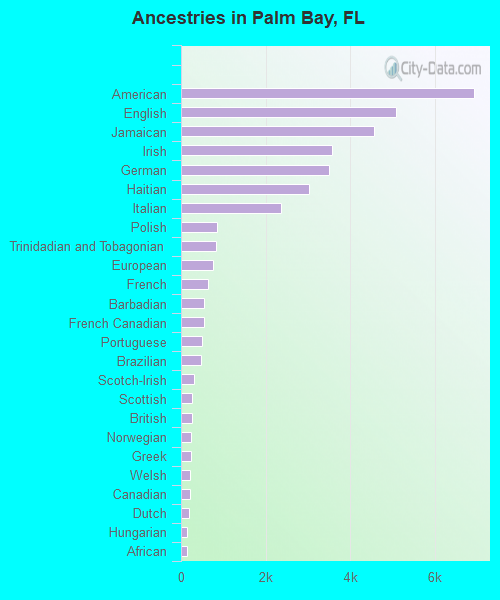
Ancestries in Palm Bay
6,934 11.7% American5,076 8.6% English4,564 7.7% Jamaican3,580 6.0% Irish3,503 5.9% German3,023 5.1% Haitian2,356 4.0% Italian849 1.4% Polish819 1.4% Trinidadian and Tobagonian751 1.3% European644 1.1% French553 0.9% Barbadian538 0.9% French Canadian497 0.8% Portuguese484 0.8% Brazilian312 0.5% Scotch-Irish258 0.4% Scottish254 0.4% British238 0.4% Norwegian226 0.4% Greek218 0.4% Welsh202 0.3% Canadian182 0.3% Dutch150 0.3% Hungarian147 0.2% African146 0.2% West Indian129 0.2% Swedish123 0.2% Albanian115 0.2% Ukrainian109 0.2% Ghanaian107 0.2% British West Indian100 0.2% Moroccan98 0.2% Cape Verdean93 0.2% Lebanese92 0.2% Eastern European77 0.1% Scandinavian64 0.1% Cajun62 0.1% Belizean56 0.09% Czechoslovakian53 0.09% South African46 0.08% Belgian43 0.07% Romanian37 0.06% Austrian36 0.06% Finnish35 0.06% Czech33 0.06% Lithuanian33 0.06% Yugoslavian32 0.05% Danish32 0.05% Arab30 0.05% Armenian30 0.05% U.S. Virgin Islander29 0.05% Syrian27 0.05% Egyptian27 0.05% Nigerian26 0.04% Swiss25 0.04% Northern European23 0.04% Russian18 0.03% Pennsylvania German17 0.03% Celtic15 0.03% Slavic9 0.02% Slovak8 0.01% Slovene7 0.01% Iraqi5 0.01% Croatian
Geographical mobility in Palm Bay Same house 1 year ago 71,058 91.2% White (Caucasian)20,841 91.7% Black or African American92 20.9% American Indian / Alaska Native2,308 84.7% Asian10 100.0% Native Hawaiian / Pacific Islander5,833 99.2% Other race18,568 89.4% Two or more races63,393 91.6% White alone, not Hispanic / Latino21,652 89.3% Hispanic or LatinoMoved within same county 4,189 5.4% White / Caucasian1,079 4.7% Black or African American176 40.2% American Indian / Alaska Native210 7.7% Asian203 3.4% Other race1,409 6.8% Two or more races3,778 5.5% White alone, not Hispanic / Latino1,701 7.0% Hispanic or LatinoMoved within same state 420 0.5% White / Caucasian494 2.2% Black or African American85 1.4% Other race255 1.2% Two or more races420 0.6% White alone, not Hispanic / Latino269 1.1% Hispanic or LatinoMoved from different state 1,877 2.4% White / Caucasian505 2.2% Black or African American59 13.4% American Indian / Alaska Native129 4.7% Asian85 1.4% Other race390 1.9% Two or more races1,236 1.8% White alone, not Hispanic / Latino330 1.4% Hispanic or LatinoMoved from abroad 345 0.4% White116 0.5% Black or African American59 13.4% American Indian / Alaska Native33 1.2% Asian108 0.5% Two or more races345 0.5% White alone, not Hispanic / Latino304 1.3% Hispanic or Latino
Children Nativity (place of birth) in Palm Bay
Children under 6 years - Living with two parents Both parents native 3,082 100.0% NativeBoth parents foreign-born 710 100.0% NativeOne native, one foreign-born parent 1,036 100.0% NativeChildren under 6 years - Living with one parent Native parent 2,837 100.0% NativeForeign-born parent 292 81.8% Native65 18.2% Foreign-bornChildren 6 to 17 years - Living with two parents Both parents native 7,841 100.0% NativeBoth parents foreign-born 1,276 77.8% Native364 22.2% Foreign-bornOne native, one foreign-born parent 1,159 100.0% NativeChildren 6 to 17 years - Living with one parent Native parent 4,652 100.0% NativeForeign-born parent 1,635 59.1% Native1,130 40.9% Foreign-born
Place of birth for residents in Palm Bay 14,118 Americas13,903 Latin America10,554 Caribbean1,795 Asia1,790 South America1,604 Europe1,558 Central America954 South Eastern Asia851 Northern Europe539 Africa508 Eastern Asia388 Western Africa378 China296 Western Europe256 Southern Europe215 Northern America199 Eastern Europe167 South Central Asia165 Western Asia106 Northern Africa38 Oceania38 Australia and New Zealand Subregion30 Southern Africa13 Eastern Africa4,352 Jamaica2,251 Haiti1,313 Cuba1,085 Trinidad and Tobago1,049 Dominican Republic680 Philippines663 Colombia596 Brazil527 Mexico355 England349 China305 United Kingdom293 Ghana281 El Salvador242 Germany223 Grenada223 Guatemala215 Canada204 Costa Rica203 Guyana161 Spain157 Vietnam143 Barbados115 Venezuela110 Thailand109 Ireland106 Panama103 India95 Italy92 Honduras86 Morocco85 Chile81 Belize81 Korea73 Peru62 Poland56 Cabo Verde54 Iraq50 Lebanon49 Bahamas49 Japan44 Hungary42 Nicaragua42 Albania41 Bangladesh38 Australia37 Nigeria34 France33 Argentina31 St. Vincent and the Grenadines31 Russia30 South Africa28 Scotland28 Taiwan23 Pakistan21 West Indies20 Belgium20 Egypt18 Czechoslovakia15 Denmark13 Ethiopia10 Ecuador5 Indonesia
Grandparents responsible for own grandchildren in Palm Bay
Grandparents (30 to 59 years) White / Caucasian 478 41.0% Responsible for grandchildren687 59.0% Not responsible for grandchildrenBlack or African American 19 15.8% Responsible for grandchildren102 84.2% Not responsible for grandchildrenOther race 10 100.0% Responsible for grandchildrenTwo or more races 40 12.8% Responsible for grandchildren272 87.2% Not responsible for grandchildrenWhite alone, not Hispanic / Latino 68 10.6% Responsible for grandchildren577 89.4% Not responsible for grandchildrenHispanic or Latino 251 33.2% Responsible for grandchildren504 66.8% Not responsible for grandchildrenGrandparents (60 years and over) White / Caucasian 848 69.5% Responsible for grandchildren372 30.5% Not responsible for grandchildrenBlack or African American 216 46.2% Responsible for grandchildren252 53.8% Not responsible for grandchildrenOther race 384 100.0% Not responsible for grandchildrenTwo or more races 166 45.7% Responsible for grandchildren198 54.3% Not responsible for grandchildrenWhite alone, not Hispanic / Latino 614 77.6% Responsible for grandchildren177 22.4% Not responsible for grandchildrenHispanic or Latino 429 52.2% Responsible for grandchildren393 47.8% Not responsible for grandchildren