Races in Overlea, Maryland (MD) Detailed Stats
Data:
Races - White alone (%)
Races - White alone (% change since 2000)
Races - Black alone (%)
Races - Black alone (% change since 2000)
Races - American Indian alone (%)
Races - American Indian alone (% change since 2000)
Races - Asian alone (%)
Races - Asian alone (% change since 2000)
Races - Hispanic (%)
Races - Hispanic (% change since 2000)
Races - Native Hawaiian and Other Pacific Islander alone (%)
Races - Native Hawaiian and Other Pacific Islander alone (% change since 2000)
Races - Two or more races(%)
Races - Two or more races(% change since 2000)
Races - Other race alone (%)
Races - Other race alone (% change since 2000)
Racial diversity
Place of birth - Born in state of residence (%)
Place of birth - Born in state of residence (%) - White
Place of birth - Born in state of residence (%) - Black or African American
Place of birth - Born in state of residence (%) - Asian
Place of birth - Born in state of residence (%) - Hispanic or Latino
Place of birth - Born in state of residence (%) - American Indian and Alaska Native
Place of birth - Born in state of residence (%) - Multirace
Place of birth - Born in state of residence (%) - Other Race
Place of birth - Born in other state (%)
Place of birth - Born in other state (%) - White
Place of birth - Born in other state (%) - Black or African American
Place of birth - Born in other state (%) - Asian
Place of birth - Born in other state (%) - Hispanic or Latino
Place of birth - Born in other state (%) - American Indian and Alaska Native
Place of birth - Born in other state (%) - Multirace
Place of birth - Born in other state (%) - Other Race
Place of birth - Native, outside of US (%)
Place of birth - Native, outside of US (%) - White
Place of birth - Native, outside of US (%) - Black or African American
Place of birth - Native, outside of US (%) - Asian
Place of birth - Native, outside of US (%) - Hispanic or Latino
Place of birth - Native, outside of US (%) - American Indian and Alaska Native
Place of birth - Native, outside of US (%) - Multirace
Place of birth - Native, outside of US (%) - Other Race
Place of birth - Foreign born (%)
Place of birth - Foreign born (%) - White
Place of birth - Foreign born (%) - Black or African American
Place of birth - Foreign born (%) - Asian
Place of birth - Foreign born (%) - Hispanic or Latino
Place of birth - Foreign born (%) - American Indian and Alaska Native
Place of birth - Foreign born (%) - Multirace
Place of birth - Foreign born (%) - Other Race
Residents speaking English at home (%)
Residents speaking English at home - Born in the United States (%)
Residents speaking English at home - Native, born elsewhere (%)
Residents speaking English at home - Foreign born (%)
Residents speaking Spanish at home (%)
Residents speaking Spanish at home - Born in the United States (%)
Residents speaking Spanish at home - Native, born elsewhere (%)
Residents speaking Spanish at home - Foreign born (%)
Residents speaking other language at home (%)
Residents speaking other language at home - Born in the United States (%)
Residents speaking other language at home - Native, born elsewhere (%)
Residents speaking other language at home - Foreign born (%)
Marital status - Never married (%)
Marital status - Now married (%)
Marital status - Separated (%)
Marital status - Widowed (%)
Marital status - Divorced (%)
Ancestries Reported - Arab (%)
Ancestries Reported - Czech (%)
Ancestries Reported - Danish (%)
Ancestries Reported - Dutch (%)
Ancestries Reported - English (%)
Ancestries Reported - French (%)
Ancestries Reported - French Canadian (%)
Ancestries Reported - German (%)
Ancestries Reported - Greek (%)
Ancestries Reported - Hungarian (%)
Ancestries Reported - Irish (%)
Ancestries Reported - Italian (%)
Ancestries Reported - Lithuanian (%)
Ancestries Reported - Norwegian (%)
Ancestries Reported - Polish (%)
Ancestries Reported - Portuguese (%)
Ancestries Reported - Russian (%)
Ancestries Reported - Scotch-Irish (%)
Ancestries Reported - Scottish (%)
Ancestries Reported - Slovak (%)
Ancestries Reported - Subsaharan African (%)
Ancestries Reported - Swedish (%)
Ancestries Reported - Swiss (%)
Ancestries Reported - Ukrainian (%)
Ancestries Reported - United States (%)
Ancestries Reported - Welsh (%)
Ancestries Reported - West Indian (%)
Ancestries Reported - Other (%)
Geographical mobility - Same house 1 year ago (%)
Geographical mobility - Same house 1 year ago (%) - White
Geographical mobility - Same house 1 year ago (%) - Black or African American
Geographical mobility - Same house 1 year ago (%) - Asian
Geographical mobility - Same house 1 year ago (%) - Hispanic or Latino
Geographical mobility - Same house 1 year ago (%) - American Indian and Alaska Native
Geographical mobility - Same house 1 year ago (%) - Multirace
Geographical mobility - Same house 1 year ago (%) - Other Race
Geographical mobility - Moved within same county (%)
Geographical mobility - Moved within same county (%) - White
Geographical mobility - Moved within same county (%) - Black or African American
Geographical mobility - Moved within same county (%) - Asian
Geographical mobility - Moved within same county (%) - Hispanic or Latino
Geographical mobility - Moved within same county (%) - American Indian and Alaska Native
Geographical mobility - Moved within same county (%) - Multirace
Geographical mobility - Moved within same county (%) - Other Race
Geographical mobility - Moved from different county within same state (%)
Geographical mobility - Moved from different county within same state (%) - White
Geographical mobility - Moved from different county within same state (%) - Black or African American
Geographical mobility - Moved from different county within same state (%) - Asian
Geographical mobility - Moved from different county within same state (%) - Hispanic or Latino
Geographical mobility - Moved from different county within same state (%) - American Indian and Alaska Native
Geographical mobility - Moved from different county within same state (%) - Multirace
Geographical mobility - Moved from different county within same state (%) - Other Race
Geographical mobility - Moved from different state (%)
Geographical mobility - Moved from different state (%) - White
Geographical mobility - Moved from different state (%) - Black or African American
Geographical mobility - Moved from different state (%) - Asian
Geographical mobility - Moved from different state (%) - Hispanic or Latino
Geographical mobility - Moved from different state (%) - American Indian and Alaska Native
Geographical mobility - Moved from different state (%) - Multirace
Geographical mobility - Moved from different state (%) - Other Race
Geographical mobility - Moved from abroad (%)
Geographical mobility - Moved from abroad (%) - White
Geographical mobility - Moved from abroad (%) - Black or African American
Geographical mobility - Moved from abroad (%) - Asian
Geographical mobility - Moved from abroad (%) - Hispanic or Latino
Geographical mobility - Moved from abroad (%) - American Indian and Alaska Native
Geographical mobility - Moved from abroad (%) - Multirace
Geographical mobility - Moved from abroad (%) - Other Race
Place of birth for the foreign-born population - Ireland (%)
Place of birth for the foreign-born population - Denmark (%)
Place of birth for the foreign-born population - Norway (%)
Place of birth for the foreign-born population - Sweden (%)
Place of birth for the foreign-born population - United Kingdom (%)
Place of birth for the foreign-born population - England (%)
Place of birth for the foreign-born population - Scotland (%)
Place of birth for the foreign-born population - Other Northern Europe (%)
Place of birth for the foreign-born population - Austria (%)
Place of birth for the foreign-born population - Belgium (%)
Place of birth for the foreign-born population - France (%)
Place of birth for the foreign-born population - Germany (%)
Place of birth for the foreign-born population - Netherlands (%)
Place of birth for the foreign-born population - Switzerland (%)
Place of birth for the foreign-born population - Other Western Europe (%)
Place of birth for the foreign-born population - Greece (%)
Place of birth for the foreign-born population - Italy (%)
Place of birth for the foreign-born population - Portugal (%)
Place of birth for the foreign-born population - Spain (%)
Place of birth for the foreign-born population - Other Southern Europe (%)
Place of birth for the foreign-born population - Albania (%)
Place of birth for the foreign-born population - Belarus (%)
Place of birth for the foreign-born population - Bosnia and Herzegovina (%)
Place of birth for the foreign-born population - Bulgaria (%)
Place of birth for the foreign-born population - Croatia (%)
Place of birth for the foreign-born population - Czechoslovakia (%)
Place of birth for the foreign-born population - Hungary (%)
Place of birth for the foreign-born population - Latvia (%)
Place of birth for the foreign-born population - Lithuania (%)
Place of birth for the foreign-born population - North Macedonia (Macedonia) (%)
Place of birth for the foreign-born population - Moldova (%)
Place of birth for the foreign-born population - Poland (%)
Place of birth for the foreign-born population - Romania (%)
Place of birth for the foreign-born population - Russia (%)
Place of birth for the foreign-born population - Serbia (%)
Place of birth for the foreign-born population - Ukraine (%)
Place of birth for the foreign-born population - Other Eastern Europe (%)
Place of birth for the foreign-born population - China (%)
Place of birth for the foreign-born population - Hong Kong (%)
Place of birth for the foreign-born population - Taiwan (%)
Place of birth for the foreign-born population - Japan (%)
Place of birth for the foreign-born population - Korea (%)
Place of birth for the foreign-born population - Other Eastern Asia (%)
Place of birth for the foreign-born population - Afghanistan (%)
Place of birth for the foreign-born population - Bangladesh (%)
Place of birth for the foreign-born population - India (%)
Place of birth for the foreign-born population - Iran (%)
Place of birth for the foreign-born population - Kazakhstan (%)
Place of birth for the foreign-born population - Nepal (%)
Place of birth for the foreign-born population - Pakistan (%)
Place of birth for the foreign-born population - Sri Lanka (%)
Place of birth for the foreign-born population - Uzbekistan (%)
Place of birth for the foreign-born population - Other South Central Asia (%)
Place of birth for the foreign-born population - Burma (%)
Place of birth for the foreign-born population - Cambodia (%)
Place of birth for the foreign-born population - Indonesia (%)
Place of birth for the foreign-born population - Laos (%)
Place of birth for the foreign-born population - Malaysia (%)
Place of birth for the foreign-born population - Philippines (%)
Place of birth for the foreign-born population - Singapore (%)
Place of birth for the foreign-born population - Thailand (%)
Place of birth for the foreign-born population - Vietnam (%)
Place of birth for the foreign-born population - Other South Eastern Asia (%)
Place of birth for the foreign-born population - Armenia (%)
Place of birth for the foreign-born population - Iraq (%)
Place of birth for the foreign-born population - Israel (%)
Place of birth for the foreign-born population - Jordan (%)
Place of birth for the foreign-born population - Kuwait (%)
Place of birth for the foreign-born population - Lebanon (%)
Place of birth for the foreign-born population - Saudi Arabia (%)
Place of birth for the foreign-born population - Syria (%)
Place of birth for the foreign-born population - Turkey (%)
Place of birth for the foreign-born population - Yemen (%)
Place of birth for the foreign-born population - Other Western Asia (%)
Place of birth for the foreign-born population - Eritrea (%)
Place of birth for the foreign-born population - Ethiopia (%)
Place of birth for the foreign-born population - Kenya (%)
Place of birth for the foreign-born population - Somalia (%)
Place of birth for the foreign-born population - Uganda (%)
Place of birth for the foreign-born population - Zimbabwe (%)
Place of birth for the foreign-born population - Other Eastern Africa (%)
Place of birth for the foreign-born population - Cameroon (%)
Place of birth for the foreign-born population - Congo (%)
Place of birth for the foreign-born population - Democratic Republic of Congo (Zaire) (%)
Place of birth for the foreign-born population - Other Middle Africa (%)
Place of birth for the foreign-born population - Egypt (%)
Place of birth for the foreign-born population - Morocco (%)
Place of birth for the foreign-born population - Sudan (%)
Place of birth for the foreign-born population - Other Northern Africa (%)
Place of birth for the foreign-born population - South Africa (%)
Place of birth for the foreign-born population - Other Southern Africa (%)
Place of birth for the foreign-born population - Cabo Verde (%)
Place of birth for the foreign-born population - Ghana (%)
Place of birth for the foreign-born population - Liberia (%)
Place of birth for the foreign-born population - Nigeria (%)
Place of birth for the foreign-born population - Senegal (%)
Place of birth for the foreign-born population - Sierra Leone (%)
Place of birth for the foreign-born population - Other Western Africa (%)
Place of birth for the foreign-born population - Australia (%)
Place of birth for the foreign-born population - New Zealand (%)
Place of birth for the foreign-born population - Fiji (%)
Place of birth for the foreign-born population - Micronesia (%)
Place of birth for the foreign-born population - Bahamas (%)
Place of birth for the foreign-born population - Barbados (%)
Place of birth for the foreign-born population - Cuba (%)
Place of birth for the foreign-born population - Dominica (%)
Place of birth for the foreign-born population - Dominican Republic (%)
Place of birth for the foreign-born population - Grenada (%)
Place of birth for the foreign-born population - Haiti (%)
Place of birth for the foreign-born population - Jamaica (%)
Place of birth for the foreign-born population - St. Vincent and the Grenadines (%)
Place of birth for the foreign-born population - Trinidad and Tobago (%)
Place of birth for the foreign-born population - West Indies (%)
Place of birth for the foreign-born population - Other Caribbean (%)
Place of birth for the foreign-born population - Belize (%)
Place of birth for the foreign-born population - Costa Rica (%)
Place of birth for the foreign-born population - El Salvador (%)
Place of birth for the foreign-born population - Guatemala (%)
Place of birth for the foreign-born population - Honduras (%)
Place of birth for the foreign-born population - Mexico (%)
Place of birth for the foreign-born population - Nicaragua (%)
Place of birth for the foreign-born population - Panama (%)
Place of birth for the foreign-born population - Other Central America (%)
Place of birth for the foreign-born population - Argentina (%)
Place of birth for the foreign-born population - Bolivia (%)
Place of birth for the foreign-born population - Brazil (%)
Place of birth for the foreign-born population - Chile (%)
Place of birth for the foreign-born population - Colombia (%)
Place of birth for the foreign-born population - Ecuador (%)
Place of birth for the foreign-born population - Guyana (%)
Place of birth for the foreign-born population - Peru (%)
Place of birth for the foreign-born population - Uruguay (%)
Place of birth for the foreign-born population - Venezuela (%)
Place of birth for the foreign-born population - Other South America (%)
Place of birth for the foreign-born population - Canada (%)
Place of birth for the foreign-born population - Other Northern America (%)
Place of birth for the foreign-born population - Other (%)
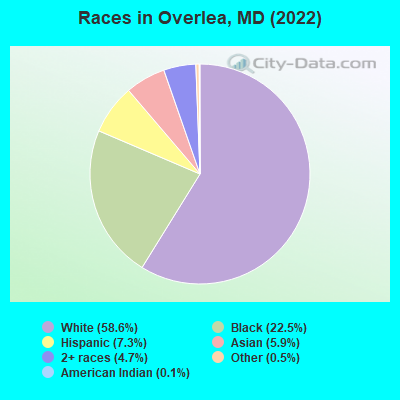
According to 2022 data, the most numerous races in Overlea, MD are White alone (7,457 residents), Black alone (2,859 residents), and Hispanic (924 residents). 88.1% of Overlea residents speak English at home. 10.5% of Overlea, MD residents are foreign-born (4.4% born in Asia, 2.5% born in Africa, 2.5% born in Latin America), which is 51.7% less than the foreign-born rate of 16.0% across the entire state of Maryland.
Race distribution in Overlea
2000 2022
3,286,547 62.1% White alone 1,464,735 27.7% Black alone 227,916 4.3% Hispanic 209,738 4.0% Asian alone 82,946 1.6% Two or more races 13,312 0.3% American Indian alone 9,379 0.2% Other race alone 1,913 0.04% Native Hawaiian and Other
2,906,492 47.1% White alone 1,800,914 29.2% Black alone 705,842 11.4% Hispanic 401,818 6.5% Asian alone 291,317 4.7% Two or more races 46,930 0.8% Other race alone 8,930 0.1% American Indian alone 2,417 0.04% Native Hawaiian and Other
Income and house value in Overlea Median household income in 2022 $67,799 White non-Hispanic householders$84,324 Black householders$83,537 Asian householders$109,471 Some other race householders$165,199 Two or more races householders$78,627 Hispanic or Latino race householdersMedian 2022 house value $248,606 White Non-Hispanic householders$207,442 Black or African American householders $225,480 Asian householders$260,169 Some other race householders$142,688 Two or more races householders$310,122 Hispanic or Latino householders
Median age by race in Overlea
47.2 Median age for White residents45.4 49.1 35.0 Median age for Black or African American residents35.4 34.5 -768,041,236.3 Median age for American Indian / Alaska Native residents-867,632,849.4 -677,419,354.2 30.3 Median age for Asian residents34.6 29.1 -1,541,125,539.6 Median age for Native Hawaiian / Pacific Islander residents-790,901,136.6 -760,942,760.2 31.2 Median age for Other race residents35.5 30.3 40.8 Median age for Two or more races residents42.4 38.5 46.9 Median age for White alone residents44.9 50.0 31.4 Median age for Hispanic or Latino residents31.5 31.1
Owner/renter occupied households by race in Overlea
House owners and renters - White residents 2,940 80.5% Owner occupied711 19.5% Renter occupiedHouse owners and renters - Black or African American residents 694 63.7% Owner occupied395 36.3% Renter occupiedHouse owners and renters - American Indian / Alaska Native residents 38 73.1% Owner occupied14 26.9% Renter occupiedHouse owners and renters - Asian residents 124 41.8% Owner occupied172 58.2% Renter occupiedHouse owners and renters - Other race residents 234 94.0% Owner occupied15 6.0% Renter occupiedHouse owners and renters - Two or more races residents 234 84.6% Owner occupied42 15.4% Renter occupiedHouse owners and renters - White alone residents 2,918 81.0% Owner occupied683 19.0% Renter occupiedHouse owners and renters - Hispanic or Latino residents 307 73.8% Owner occupied109 26.2% Renter occupied
Language usage in Overlea
English speakers - Total 88.1% of residents of Overlea speak English at home.
4.0% of residents speak Spanish at home 61 12.8% Speak English very well417 87.2% Speak English less than very well8.4% of residents speak other language at home 552 54.4% Speak English very well463 45.6% Speak English less than very well
All residents speak only English at home
English speakers - Native, born elsewhere 91.6% of residents of Overlea speak English at home.
1.9% of residents speak Spanish at home 4 100.0% Speak English very well10.7% of residents speak other language at home 16 69.6% Speak English very well7 30.4% Speak English less than very well
English speakers - Foreign-born 16.7% of residents of Overlea speak English at home.
22.7% of residents speak Spanish at home 22 7.3% Speak English very well280 92.7% Speak English less than very well61.1% of residents speak other language at home 404 49.6% Speak English very well411 50.4% Speak English less than very well
White (Caucasian) - Speak only English Native:
100.0% (7,120)Foreign-born:
60.2% (46)
White (Caucasian) - Speak another language Native:
0.4% (32)Foreign-born:
43.0% (33)
Black or African American - Speak only English Native:
97.9% (2,287)Foreign-born:
10.3% (35)
Black or African American - Speak another language Native:
2.2% (51)Foreign-born:
78.1% (266)
American Indian / Alaska Native - Speak another language Native:
100.0% (25)Foreign-born:
100.0% (18)
Asian - Speak only English Native:
36.0% (65)Foreign-born:
16.5% (86)
Asian - Speak another language Native:
63.8% (115)Foreign-born:
83.9% (437)
Other race - Speak another language Native:
49.7% (181)Foreign-born:
100.0% (347)
Two or more races - Speak only English Native:
100.0% (609)Foreign-born:
46.2% (59)
Two or more races - Speak another language Native:
3.4% (21)Foreign-born:
55.8% (71)
White alone - Speak only English Native:
99.9% (7,097)Foreign-born:
48.6% (37)
White alone - Speak another language Native:
0.4% (32)Foreign-born:
50.2% (39)
Hispanic or Latino - Speak only English Native:
71.6% (352)Foreign-born:
4.5% (14)
Hispanic or Latino - Speak another language Native:
32.2% (158)Foreign-born:
95.5% (294)
Foreign-born residents in Overlea 1,342 residents are foreign born (4.4% Asia , 2.5% Africa , 2.5% Latin America ).
This city:
10.5%Maryland:
15.7%
Marital status for residents in Overlea Marital status - White (Caucasian) population 15 years and over
Males 32.9% Never married52.3% Now married2.4% Separated2.3% Widowed10.1% DivorcedFemales 30.9% Never married36.7% Now married3.3% Separated10.7% Widowed18.3% DivorcedWomen who gave birth in the past 12 months Now married:
100.0% (58)Unmarried:
0.0% (0)
Women who did not give birth in the past 12 months Now married:
32.0% (559)Unmarried:
68.0% (1,188)
Marital status - Black or African American population 15 years and over
Males 44.3% Never married42.4% Now married1.2% Separated6.2% Widowed5.9% DivorcedFemales 41.8% Never married27.9% Now married6.5% Separated13.5% Widowed10.4% DivorcedWomen who gave birth in the past 12 months Now married:
0.0% (0)Unmarried:
100.0% (65)
Women who did not give birth in the past 12 months Now married:
40.2% (279)Unmarried:
59.8% (414)
Marital status - American Indian / Alaska Native population 15 years and over
Males 0.0% Never married100.0% Now married0.0% Separated0.0% Widowed0.0% DivorcedFemales 0.0% Never married0.0% Now married0.0% Separated100.0% Widowed0.0% DivorcedMarital status - Asian population 15 years and over
Males 27.4% Never married72.6% Now married0.0% Separated0.0% Widowed0.0% DivorcedFemales 32.6% Never married57.9% Now married0.0% Separated0.7% Widowed8.8% DivorcedWomen who gave birth in the past 12 months Now married:
100.0% (28)Unmarried:
0.0% (0)
Women who did not give birth in the past 12 months Now married:
58.2% (106)Unmarried:
41.8% (76)
Marital status - Other race population 15 years and over
Males 10.9% Never married46.9% Now married0.0% Separated0.0% Widowed42.2% DivorcedFemales 63.4% Never married25.9% Now married0.0% Separated10.7% Widowed0.0% DivorcedWomen who did not give birth in the past 12 months Now married:
23.1% (62)Unmarried:
76.9% (205)
Marital status - Two or more races population 15 years and over
Males 28.6% Never married21.2% Now married14.9% Separated0.0% Widowed35.3% DivorcedFemales 43.2% Never married36.4% Now married8.5% Separated11.4% Widowed0.6% DivorcedWomen who did not give birth in the past 12 months Now married:
43.8% (76)Unmarried:
56.2% (98)
Marital status - White alone, not Hispanic / Latino population 15 years and over
Males 33.4% Never married51.7% Now married2.5% Separated2.3% Widowed10.2% DivorcedFemales 31.2% Never married37.1% Now married3.4% Separated10.8% Widowed17.5% DivorcedWomen who gave birth in the past 12 months Now married:
100.0% (58)Unmarried:
0.0% (0)
Women who did not give birth in the past 12 months Now married:
32.6% (563)Unmarried:
67.4% (1,163)
Marital status - Hispanic or Latino population 15 years and over
Males 13.5% Never married46.0% Now married15.9% Separated0.0% Widowed24.6% DivorcedFemales 49.2% Never married22.8% Now married0.0% Separated11.9% Widowed16.1% DivorcedWomen who did not give birth in the past 12 months Now married:
24.2% (64)Unmarried:
75.8% (201)
Ancestries in Overlea
860 15.2% German326 5.8% English324 5.7% Nigerian250 4.4% American237 4.2% Italian203 3.6% Polish177 3.1% Irish150 2.7% Ethiopian127 2.2% European117 2.1% Eastern European90 1.6% African48 0.8% Greek40 0.7% Arab36 0.6% French30 0.5% Sudanese21 0.4% Scottish21 0.4% Slavic16 0.3% Ghanaian14 0.2% Lithuanian13 0.2% Swiss12 0.2% Dutch7 0.1% British7 0.1% Norwegian6 0.1% Russian5 0.09% Iranian
Children Nativity (place of birth) in Overlea
Children under 6 years - Living with two parents Both parents native 355 100.0% NativeBoth parents foreign-born 63 100.0% NativeOne native, one foreign-born parent 51 100.0% NativeChildren under 6 years - Living with one parent Native parent 96 100.0% NativeForeign-born parent 160 100.0% NativeChildren 6 to 17 years - Living with two parents Both parents native 481 100.0% NativeBoth parents foreign-born 337 86.2% Native54 13.8% Foreign-bornOne native, one foreign-born parent 64 100.0% NativeChildren 6 to 17 years - Living with one parent Native parent 599 100.0% NativeForeign-born parent 25 50.5% Native24 49.5% Foreign-born
Grandparents responsible for own grandchildren in Overlea
Grandparents (30 to 59 years) White / Caucasian 7 15.2% Responsible for grandchildren39 84.8% Not responsible for grandchildrenAsian 6 100.0% Not responsible for grandchildrenWhite alone, not Hispanic / Latino 7 15.6% Responsible for grandchildren38 84.4% Not responsible for grandchildrenGrandparents (60 years and over) White / Caucasian 56 36.5% Responsible for grandchildren97 63.5% Not responsible for grandchildrenWhite alone, not Hispanic / Latino 57 35.8% Responsible for grandchildren102 64.2% Not responsible for grandchildren