Races in Ossining, New York (NY) Detailed Stats
Data:
Races - White alone (%)
Races - White alone (% change since 2000)
Races - Black alone (%)
Races - Black alone (% change since 2000)
Races - American Indian alone (%)
Races - American Indian alone (% change since 2000)
Races - Asian alone (%)
Races - Asian alone (% change since 2000)
Races - Hispanic (%)
Races - Hispanic (% change since 2000)
Races - Native Hawaiian and Other Pacific Islander alone (%)
Races - Native Hawaiian and Other Pacific Islander alone (% change since 2000)
Races - Two or more races(%)
Races - Two or more races(% change since 2000)
Races - Other race alone (%)
Races - Other race alone (% change since 2000)
Racial diversity
Place of birth - Born in state of residence (%)
Place of birth - Born in state of residence (%) - White
Place of birth - Born in state of residence (%) - Black or African American
Place of birth - Born in state of residence (%) - Asian
Place of birth - Born in state of residence (%) - Hispanic or Latino
Place of birth - Born in state of residence (%) - American Indian and Alaska Native
Place of birth - Born in state of residence (%) - Multirace
Place of birth - Born in state of residence (%) - Other Race
Place of birth - Born in other state (%)
Place of birth - Born in other state (%) - White
Place of birth - Born in other state (%) - Black or African American
Place of birth - Born in other state (%) - Asian
Place of birth - Born in other state (%) - Hispanic or Latino
Place of birth - Born in other state (%) - American Indian and Alaska Native
Place of birth - Born in other state (%) - Multirace
Place of birth - Born in other state (%) - Other Race
Place of birth - Native, outside of US (%)
Place of birth - Native, outside of US (%) - White
Place of birth - Native, outside of US (%) - Black or African American
Place of birth - Native, outside of US (%) - Asian
Place of birth - Native, outside of US (%) - Hispanic or Latino
Place of birth - Native, outside of US (%) - American Indian and Alaska Native
Place of birth - Native, outside of US (%) - Multirace
Place of birth - Native, outside of US (%) - Other Race
Place of birth - Foreign born (%)
Place of birth - Foreign born (%) - White
Place of birth - Foreign born (%) - Black or African American
Place of birth - Foreign born (%) - Asian
Place of birth - Foreign born (%) - Hispanic or Latino
Place of birth - Foreign born (%) - American Indian and Alaska Native
Place of birth - Foreign born (%) - Multirace
Place of birth - Foreign born (%) - Other Race
Residents speaking English at home (%)
Residents speaking English at home - Born in the United States (%)
Residents speaking English at home - Native, born elsewhere (%)
Residents speaking English at home - Foreign born (%)
Residents speaking Spanish at home (%)
Residents speaking Spanish at home - Born in the United States (%)
Residents speaking Spanish at home - Native, born elsewhere (%)
Residents speaking Spanish at home - Foreign born (%)
Residents speaking other language at home (%)
Residents speaking other language at home - Born in the United States (%)
Residents speaking other language at home - Native, born elsewhere (%)
Residents speaking other language at home - Foreign born (%)
Marital status - Never married (%)
Marital status - Now married (%)
Marital status - Separated (%)
Marital status - Widowed (%)
Marital status - Divorced (%)
Ancestries Reported - Arab (%)
Ancestries Reported - Czech (%)
Ancestries Reported - Danish (%)
Ancestries Reported - Dutch (%)
Ancestries Reported - English (%)
Ancestries Reported - French (%)
Ancestries Reported - French Canadian (%)
Ancestries Reported - German (%)
Ancestries Reported - Greek (%)
Ancestries Reported - Hungarian (%)
Ancestries Reported - Irish (%)
Ancestries Reported - Italian (%)
Ancestries Reported - Lithuanian (%)
Ancestries Reported - Norwegian (%)
Ancestries Reported - Polish (%)
Ancestries Reported - Portuguese (%)
Ancestries Reported - Russian (%)
Ancestries Reported - Scotch-Irish (%)
Ancestries Reported - Scottish (%)
Ancestries Reported - Slovak (%)
Ancestries Reported - Subsaharan African (%)
Ancestries Reported - Swedish (%)
Ancestries Reported - Swiss (%)
Ancestries Reported - Ukrainian (%)
Ancestries Reported - United States (%)
Ancestries Reported - Welsh (%)
Ancestries Reported - West Indian (%)
Ancestries Reported - Other (%)
Geographical mobility - Same house 1 year ago (%)
Geographical mobility - Same house 1 year ago (%) - White
Geographical mobility - Same house 1 year ago (%) - Black or African American
Geographical mobility - Same house 1 year ago (%) - Asian
Geographical mobility - Same house 1 year ago (%) - Hispanic or Latino
Geographical mobility - Same house 1 year ago (%) - American Indian and Alaska Native
Geographical mobility - Same house 1 year ago (%) - Multirace
Geographical mobility - Same house 1 year ago (%) - Other Race
Geographical mobility - Moved within same county (%)
Geographical mobility - Moved within same county (%) - White
Geographical mobility - Moved within same county (%) - Black or African American
Geographical mobility - Moved within same county (%) - Asian
Geographical mobility - Moved within same county (%) - Hispanic or Latino
Geographical mobility - Moved within same county (%) - American Indian and Alaska Native
Geographical mobility - Moved within same county (%) - Multirace
Geographical mobility - Moved within same county (%) - Other Race
Geographical mobility - Moved from different county within same state (%)
Geographical mobility - Moved from different county within same state (%) - White
Geographical mobility - Moved from different county within same state (%) - Black or African American
Geographical mobility - Moved from different county within same state (%) - Asian
Geographical mobility - Moved from different county within same state (%) - Hispanic or Latino
Geographical mobility - Moved from different county within same state (%) - American Indian and Alaska Native
Geographical mobility - Moved from different county within same state (%) - Multirace
Geographical mobility - Moved from different county within same state (%) - Other Race
Geographical mobility - Moved from different state (%)
Geographical mobility - Moved from different state (%) - White
Geographical mobility - Moved from different state (%) - Black or African American
Geographical mobility - Moved from different state (%) - Asian
Geographical mobility - Moved from different state (%) - Hispanic or Latino
Geographical mobility - Moved from different state (%) - American Indian and Alaska Native
Geographical mobility - Moved from different state (%) - Multirace
Geographical mobility - Moved from different state (%) - Other Race
Geographical mobility - Moved from abroad (%)
Geographical mobility - Moved from abroad (%) - White
Geographical mobility - Moved from abroad (%) - Black or African American
Geographical mobility - Moved from abroad (%) - Asian
Geographical mobility - Moved from abroad (%) - Hispanic or Latino
Geographical mobility - Moved from abroad (%) - American Indian and Alaska Native
Geographical mobility - Moved from abroad (%) - Multirace
Geographical mobility - Moved from abroad (%) - Other Race
Place of birth for the foreign-born population - Ireland (%)
Place of birth for the foreign-born population - Denmark (%)
Place of birth for the foreign-born population - Norway (%)
Place of birth for the foreign-born population - Sweden (%)
Place of birth for the foreign-born population - United Kingdom (%)
Place of birth for the foreign-born population - England (%)
Place of birth for the foreign-born population - Scotland (%)
Place of birth for the foreign-born population - Other Northern Europe (%)
Place of birth for the foreign-born population - Austria (%)
Place of birth for the foreign-born population - Belgium (%)
Place of birth for the foreign-born population - France (%)
Place of birth for the foreign-born population - Germany (%)
Place of birth for the foreign-born population - Netherlands (%)
Place of birth for the foreign-born population - Switzerland (%)
Place of birth for the foreign-born population - Other Western Europe (%)
Place of birth for the foreign-born population - Greece (%)
Place of birth for the foreign-born population - Italy (%)
Place of birth for the foreign-born population - Portugal (%)
Place of birth for the foreign-born population - Spain (%)
Place of birth for the foreign-born population - Other Southern Europe (%)
Place of birth for the foreign-born population - Albania (%)
Place of birth for the foreign-born population - Belarus (%)
Place of birth for the foreign-born population - Bosnia and Herzegovina (%)
Place of birth for the foreign-born population - Bulgaria (%)
Place of birth for the foreign-born population - Croatia (%)
Place of birth for the foreign-born population - Czechoslovakia (%)
Place of birth for the foreign-born population - Hungary (%)
Place of birth for the foreign-born population - Latvia (%)
Place of birth for the foreign-born population - Lithuania (%)
Place of birth for the foreign-born population - North Macedonia (Macedonia) (%)
Place of birth for the foreign-born population - Moldova (%)
Place of birth for the foreign-born population - Poland (%)
Place of birth for the foreign-born population - Romania (%)
Place of birth for the foreign-born population - Russia (%)
Place of birth for the foreign-born population - Serbia (%)
Place of birth for the foreign-born population - Ukraine (%)
Place of birth for the foreign-born population - Other Eastern Europe (%)
Place of birth for the foreign-born population - China (%)
Place of birth for the foreign-born population - Hong Kong (%)
Place of birth for the foreign-born population - Taiwan (%)
Place of birth for the foreign-born population - Japan (%)
Place of birth for the foreign-born population - Korea (%)
Place of birth for the foreign-born population - Other Eastern Asia (%)
Place of birth for the foreign-born population - Afghanistan (%)
Place of birth for the foreign-born population - Bangladesh (%)
Place of birth for the foreign-born population - India (%)
Place of birth for the foreign-born population - Iran (%)
Place of birth for the foreign-born population - Kazakhstan (%)
Place of birth for the foreign-born population - Nepal (%)
Place of birth for the foreign-born population - Pakistan (%)
Place of birth for the foreign-born population - Sri Lanka (%)
Place of birth for the foreign-born population - Uzbekistan (%)
Place of birth for the foreign-born population - Other South Central Asia (%)
Place of birth for the foreign-born population - Burma (%)
Place of birth for the foreign-born population - Cambodia (%)
Place of birth for the foreign-born population - Indonesia (%)
Place of birth for the foreign-born population - Laos (%)
Place of birth for the foreign-born population - Malaysia (%)
Place of birth for the foreign-born population - Philippines (%)
Place of birth for the foreign-born population - Singapore (%)
Place of birth for the foreign-born population - Thailand (%)
Place of birth for the foreign-born population - Vietnam (%)
Place of birth for the foreign-born population - Other South Eastern Asia (%)
Place of birth for the foreign-born population - Armenia (%)
Place of birth for the foreign-born population - Iraq (%)
Place of birth for the foreign-born population - Israel (%)
Place of birth for the foreign-born population - Jordan (%)
Place of birth for the foreign-born population - Kuwait (%)
Place of birth for the foreign-born population - Lebanon (%)
Place of birth for the foreign-born population - Saudi Arabia (%)
Place of birth for the foreign-born population - Syria (%)
Place of birth for the foreign-born population - Turkey (%)
Place of birth for the foreign-born population - Yemen (%)
Place of birth for the foreign-born population - Other Western Asia (%)
Place of birth for the foreign-born population - Eritrea (%)
Place of birth for the foreign-born population - Ethiopia (%)
Place of birth for the foreign-born population - Kenya (%)
Place of birth for the foreign-born population - Somalia (%)
Place of birth for the foreign-born population - Uganda (%)
Place of birth for the foreign-born population - Zimbabwe (%)
Place of birth for the foreign-born population - Other Eastern Africa (%)
Place of birth for the foreign-born population - Cameroon (%)
Place of birth for the foreign-born population - Congo (%)
Place of birth for the foreign-born population - Democratic Republic of Congo (Zaire) (%)
Place of birth for the foreign-born population - Other Middle Africa (%)
Place of birth for the foreign-born population - Egypt (%)
Place of birth for the foreign-born population - Morocco (%)
Place of birth for the foreign-born population - Sudan (%)
Place of birth for the foreign-born population - Other Northern Africa (%)
Place of birth for the foreign-born population - South Africa (%)
Place of birth for the foreign-born population - Other Southern Africa (%)
Place of birth for the foreign-born population - Cabo Verde (%)
Place of birth for the foreign-born population - Ghana (%)
Place of birth for the foreign-born population - Liberia (%)
Place of birth for the foreign-born population - Nigeria (%)
Place of birth for the foreign-born population - Senegal (%)
Place of birth for the foreign-born population - Sierra Leone (%)
Place of birth for the foreign-born population - Other Western Africa (%)
Place of birth for the foreign-born population - Australia (%)
Place of birth for the foreign-born population - New Zealand (%)
Place of birth for the foreign-born population - Fiji (%)
Place of birth for the foreign-born population - Micronesia (%)
Place of birth for the foreign-born population - Bahamas (%)
Place of birth for the foreign-born population - Barbados (%)
Place of birth for the foreign-born population - Cuba (%)
Place of birth for the foreign-born population - Dominica (%)
Place of birth for the foreign-born population - Dominican Republic (%)
Place of birth for the foreign-born population - Grenada (%)
Place of birth for the foreign-born population - Haiti (%)
Place of birth for the foreign-born population - Jamaica (%)
Place of birth for the foreign-born population - St. Vincent and the Grenadines (%)
Place of birth for the foreign-born population - Trinidad and Tobago (%)
Place of birth for the foreign-born population - West Indies (%)
Place of birth for the foreign-born population - Other Caribbean (%)
Place of birth for the foreign-born population - Belize (%)
Place of birth for the foreign-born population - Costa Rica (%)
Place of birth for the foreign-born population - El Salvador (%)
Place of birth for the foreign-born population - Guatemala (%)
Place of birth for the foreign-born population - Honduras (%)
Place of birth for the foreign-born population - Mexico (%)
Place of birth for the foreign-born population - Nicaragua (%)
Place of birth for the foreign-born population - Panama (%)
Place of birth for the foreign-born population - Other Central America (%)
Place of birth for the foreign-born population - Argentina (%)
Place of birth for the foreign-born population - Bolivia (%)
Place of birth for the foreign-born population - Brazil (%)
Place of birth for the foreign-born population - Chile (%)
Place of birth for the foreign-born population - Colombia (%)
Place of birth for the foreign-born population - Ecuador (%)
Place of birth for the foreign-born population - Guyana (%)
Place of birth for the foreign-born population - Peru (%)
Place of birth for the foreign-born population - Uruguay (%)
Place of birth for the foreign-born population - Venezuela (%)
Place of birth for the foreign-born population - Other South America (%)
Place of birth for the foreign-born population - Canada (%)
Place of birth for the foreign-born population - Other Northern America (%)
Place of birth for the foreign-born population - Other (%)
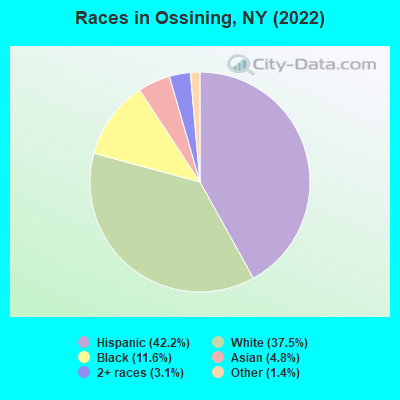
According to 2022 data, the most numerous races in Ossining, NY are White alone (10,089 residents), Hispanic (11,346 residents), and Black alone (3,120 residents). 53.2% of Ossining residents speak English at home. 32.9% of Ossining, NY residents are foreign-born (23.7% born in Latin America, 5.2% born in Europe, 3.6% born in Asia), which is 33.2% greater than the foreign-born rate of 22.0% across the entire state of New York.
Race distribution in Ossining
2000 2022
11,760,981 62.0% White alone 2,867,583 15.1% Hispanic 2,812,623 14.8% Black alone 1,035,926 5.5% Asian alone 366,116 1.9% Two or more races 75,499 0.4% Other race alone 52,499 0.3% American Indian alone 5,230 0.03% Native Hawaiian and Other
10,408,933 52.9% White alone 3,867,299 19.7% Hispanic 2,633,840 13.4% Black alone 1,776,286 9.0% Asian alone 732,670 3.7% Two or more races 216,110 1.1% Other race alone 35,082 0.2% American Indian alone 6,931 0.04% Native Hawaiian and Other
Income and house value in Ossining Median household income in 2022 $109,657 White non-Hispanic householders$79,412 Black householders$168,310 Asian householders$73,079 Some other race householders$74,780 Two or more races householders$73,555 Hispanic or Latino race householdersMedian 2022 house value $468,419 White Non-Hispanic householders$377,489 Black or African American householders $439,566 Asian householders$410,714 Some other race householders$462,080 Two or more races householders$431,916 Hispanic or Latino householders
Median age by race in Ossining
48.7 Median age for White residents49.2 48.4 38.7 Median age for Black or African American residents40.5 37.8 -641,441,440.8 Median age for American Indian / Alaska Native residents-664,804,468.6 -554,999,999.4 37.5 Median age for Asian residents36.1 38.8 -487,992,314.6 Median age for Native Hawaiian / Pacific Islander residents-477,502,295.2 -666,666,666.0 32.9 Median age for Other race residents33.2 32.5 48.2 Median age for Two or more races residents42.7 52.0 50.3 Median age for White alone residents49.4 52.8 35.8 Median age for Hispanic or Latino residents33.6 37.4
Owner/renter occupied households by race in Ossining
House owners and renters - White residents 3,806 68.3% Owner occupied1,765 31.7% Renter occupiedHouse owners and renters - Black or African American residents 310 38.8% Owner occupied488 61.2% Renter occupiedHouse owners and renters - American Indian / Alaska Native residents 42 100.0% Renter occupiedHouse owners and renters - Asian residents 296 65.1% Owner occupied159 34.9% Renter occupiedHouse owners and renters - Other race residents 557 28.3% Owner occupied1,414 71.7% Renter occupiedHouse owners and renters - Two or more races residents 450 40.7% Owner occupied656 59.3% Renter occupiedHouse owners and renters - White alone residents 3,450 69.9% Owner occupied1,489 30.1% Renter occupiedHouse owners and renters - Hispanic or Latino residents 1,175 34.1% Owner occupied2,269 65.9% Renter occupied
Language usage in Ossining
English speakers - Total 53.2% of residents of Ossining speak English at home.
37.9% of residents speak Spanish at home 4,629 47.8% Speak English very well5,058 52.2% Speak English less than very well9.4% of residents speak other language at home 1,585 65.9% Speak English very well819 34.1% Speak English less than very well
English speakers - Born in the United States 92.1% of residents of Ossining speak English at home.
5.7% of residents speak Spanish at home 119 100.0% Speak English very well2.9% of residents speak other language at home 49 80.3% Speak English very well12 19.7% Speak English less than very well
English speakers - Native, born elsewhere 27.6% of residents of Ossining speak English at home.
77.1% of residents speak Spanish at home 493 62.5% Speak English very well296 37.5% Speak English less than very well1.9% of residents speak other language at home 13 68.4% Speak English very well6 31.6% Speak English less than very well
English speakers - Foreign-born 15.1% of residents of Ossining speak English at home.
62.3% of residents speak Spanish at home 1,295 23.2% Speak English very well4,290 76.8% Speak English less than very well21.0% of residents speak other language at home 1,154 61.4% Speak English very well724 38.6% Speak English less than very well
White (Caucasian) - Speak only English Native:
86.8% (8,189)Foreign-born:
23.3% (494)
White (Caucasian) - Speak another language Native:
12.0% (1,132)Foreign-born:
72.0% (1,527)
Black or African American - Speak only English Native:
100.0% (2,117)Foreign-born:
68.9% (452)
Black or African American - Speak another language Native:
0.8% (17)Foreign-born:
31.4% (206)
Asian - Speak only English Native:
58.9% (224)Foreign-born:
13.8% (116)
Asian - Speak another language Native:
41.1% (157)Foreign-born:
85.9% (725)
Other race - Speak only English Native:
15.7% (503)Foreign-born:
3.6% (124)
Other race - Speak another language Native:
86.4% (2,778)Foreign-born:
94.5% (3,274)
Two or more races - Speak only English Native:
69.3% (1,230)Foreign-born:
8.9% (172)
Two or more races - Speak another language Native:
31.1% (551)Foreign-born:
91.4% (1,766)
White alone - Speak only English Native:
92.1% (7,747)Foreign-born:
36.7% (500)
White alone - Speak another language Native:
7.8% (655)Foreign-born:
62.8% (855)
Hispanic or Latino - Speak only English Native:
24.6% (1,192)Foreign-born:
3.9% (231)
Hispanic or Latino - Speak another language Native:
76.9% (3,734)Foreign-born:
95.3% (5,639)
Foreign-born residents in Ossining 8,851 residents are foreign born (23.7% Latin America , 5.2% Europe , 3.6% Asia ).
This city:
32.9%New York:
22.6%
Marital status for residents in Ossining Marital status - White (Caucasian) population 15 years and over
Males 30.1% Never married57.7% Now married1.9% Separated1.0% Widowed9.3% DivorcedFemales 32.2% Never married46.5% Now married0.7% Separated8.0% Widowed12.7% DivorcedWomen who gave birth in the past 12 months Now married:
88.0% (65)Unmarried:
12.0% (9)
Women who did not give birth in the past 12 months Now married:
40.2% (1,041)Unmarried:
59.8% (1,552)
Marital status - Black or African American population 15 years and over
Males 63.9% Never married25.6% Now married4.1% Separated0.5% Widowed5.8% DivorcedFemales 44.7% Never married20.0% Now married8.9% Separated12.8% Widowed13.6% DivorcedWomen who gave birth in the past 12 months Now married:
100.0% (59)Unmarried:
0.0% (0)
Women who did not give birth in the past 12 months Now married:
22.9% (134)Unmarried:
77.1% (449)
Marital status - American Indian / Alaska Native population 15 years and over
Males 100.0% Never married0.0% Now married0.0% Separated0.0% Widowed0.0% DivorcedFemales 100.0% Never married0.0% Now married0.0% Separated0.0% Widowed0.0% DivorcedWomen who did not give birth in the past 12 months Now married:
0.0% (0)Unmarried:
100.0% (67)
Marital status - Asian population 15 years and over
Males 45.1% Never married54.9% Now married0.0% Separated0.0% Widowed0.0% DivorcedFemales 20.1% Never married72.1% Now married0.0% Separated5.1% Widowed2.8% DivorcedWomen who did not give birth in the past 12 months Now married:
67.0% (231)Unmarried:
33.0% (114)
Marital status - Other race population 15 years and over
Males 51.2% Never married38.0% Now married4.5% Separated0.5% Widowed5.8% DivorcedFemales 39.7% Never married34.2% Now married3.4% Separated2.7% Widowed20.0% DivorcedWomen who gave birth in the past 12 months Now married:
0.0% (0)Unmarried:
100.0% (34)
Women who did not give birth in the past 12 months Now married:
39.1% (794)Unmarried:
60.9% (1,239)
Marital status - Two or more races population 15 years and over
Males 27.2% Never married65.2% Now married5.3% Separated0.0% Widowed2.4% DivorcedFemales 21.8% Never married64.5% Now married0.0% Separated0.9% Widowed12.9% DivorcedWomen who did not give birth in the past 12 months Now married:
61.1% (391)Unmarried:
38.9% (249)
Marital status - White alone, not Hispanic / Latino population 15 years and over
Males 26.7% Never married60.8% Now married2.4% Separated1.3% Widowed8.9% DivorcedFemales 27.1% Never married50.5% Now married0.9% Separated9.1% Widowed12.5% DivorcedWomen who gave birth in the past 12 months Now married:
88.0% (69)Unmarried:
12.0% (9)
Women who did not give birth in the past 12 months Now married:
48.1% (895)Unmarried:
51.9% (964)
Marital status - Hispanic or Latino population 15 years and over
Males 44.5% Never married44.8% Now married3.8% Separated0.1% Widowed6.7% DivorcedFemales 38.8% Never married37.9% Now married1.8% Separated3.9% Widowed17.5% DivorcedWomen who gave birth in the past 12 months Now married:
0.0% (0)Unmarried:
100.0% (30)
Women who did not give birth in the past 12 months Now married:
38.8% (1,242)Unmarried:
61.2% (1,960)
Ancestries in Ossining
1,266 8.5% Italian584 3.9% Irish553 3.7% American501 3.4% Jamaican430 2.9% European307 2.1% German200 1.3% Albanian180 1.2% Hungarian168 1.1% Polish152 1.0% Portuguese144 1.0% Greek128 0.9% Haitian121 0.8% English113 0.8% Iranian93 0.6% Slovak88 0.6% Norwegian86 0.6% Russian74 0.5% French67 0.5% New Zealander56 0.4% African36 0.2% Trinidadian and Tobagonian34 0.2% Eastern European30 0.2% Guyanese29 0.2% Ukrainian27 0.2% French Canadian25 0.2% Swedish24 0.2% Jordanian23 0.2% Armenian16 0.1% Ghanaian15 0.1% Croatian15 0.1% Northern European13 0.09% Scottish12 0.08% Austrian12 0.08% Dutch11 0.07% Palestinian11 0.07% West Indian9 0.06% Syrian8 0.05% Danish7 0.05% Nigerian3 0.02% Barbadian2 0.01% Scandinavian
Geographical mobility in Ossining Same house 1 year ago 10,389 86.9% White (Caucasian)2,432 77.7% Black or African American33 35.0% American Indian / Alaska Native1,226 93.6% Asian5,836 83.6% Other race3,587 92.8% Two or more races9,051 90.1% White alone, not Hispanic / Latino9,158 81.1% Hispanic or LatinoMoved within same county 1,048 8.8% White / Caucasian251 8.0% Black or African American22 1.6% Asian273 3.9% Other race52 1.4% Two or more races645 6.4% White alone, not Hispanic / Latino988 8.7% Hispanic or LatinoMoved within same state 396 3.3% White / Caucasian316 10.1% Black or African American17 1.3% Asian674 9.7% Other race40 1.0% Two or more races223 2.2% White alone, not Hispanic / Latino878 7.8% Hispanic or LatinoMoved from different state 15 0.1% White / Caucasian36 1.2% Black or African American20 1.5% Asian110 1.6% Other race17 0.2% White alone, not Hispanic / Latino146 1.3% Hispanic or LatinoMoved from abroad 90 0.8% White43 46.0% American Indian / Alaska Native159 2.3% Other race46 1.2% Two or more races115 1.1% White alone, not Hispanic / Latino262 2.3% Hispanic or Latino
Children Nativity (place of birth) in Ossining
Children under 6 years - Living with two parents Both parents native 421 99.8% Native1 0.2% Foreign-bornBoth parents foreign-born 332 87.8% Native46 12.2% Foreign-bornOne native, one foreign-born parent 195 100.0% NativeChildren under 6 years - Living with one parent Native parent 246 100.0% NativeForeign-born parent 230 100.0% NativeChildren 6 to 17 years - Living with two parents Both parents native 727 100.0% NativeBoth parents foreign-born 1,070 93.6% Native73 6.4% Foreign-bornOne native, one foreign-born parent 700 100.0% NativeChildren 6 to 17 years - Living with one parent Native parent 223 100.0% NativeForeign-born parent 500 60.6% Native325 39.4% Foreign-born
Grandparents responsible for own grandchildren in Ossining
Grandparents (30 to 59 years) Other race 128 100.0% Not responsible for grandchildrenTwo or more races 87 100.0% Not responsible for grandchildrenHispanic or Latino 130 100.0% Not responsible for grandchildrenGrandparents (60 years and over) Other race 51 49.9% Responsible for grandchildren52 50.1% Not responsible for grandchildrenTwo or more races 31 41.3% Responsible for grandchildren44 58.7% Not responsible for grandchildrenHispanic or Latino 101 41.1% Responsible for grandchildren144 58.9% Not responsible for grandchildren