Races in Ormond Beach, Florida (FL) Detailed Stats
Data:
Races - White alone (%)
Races - White alone (% change since 2000)
Races - Black alone (%)
Races - Black alone (% change since 2000)
Races - American Indian alone (%)
Races - American Indian alone (% change since 2000)
Races - Asian alone (%)
Races - Asian alone (% change since 2000)
Races - Hispanic (%)
Races - Hispanic (% change since 2000)
Races - Native Hawaiian and Other Pacific Islander alone (%)
Races - Native Hawaiian and Other Pacific Islander alone (% change since 2000)
Races - Two or more races(%)
Races - Two or more races(% change since 2000)
Races - Other race alone (%)
Races - Other race alone (% change since 2000)
Racial diversity
Place of birth - Born in state of residence (%)
Place of birth - Born in state of residence (%) - White
Place of birth - Born in state of residence (%) - Black or African American
Place of birth - Born in state of residence (%) - Asian
Place of birth - Born in state of residence (%) - Hispanic or Latino
Place of birth - Born in state of residence (%) - American Indian and Alaska Native
Place of birth - Born in state of residence (%) - Multirace
Place of birth - Born in state of residence (%) - Other Race
Place of birth - Born in other state (%)
Place of birth - Born in other state (%) - White
Place of birth - Born in other state (%) - Black or African American
Place of birth - Born in other state (%) - Asian
Place of birth - Born in other state (%) - Hispanic or Latino
Place of birth - Born in other state (%) - American Indian and Alaska Native
Place of birth - Born in other state (%) - Multirace
Place of birth - Born in other state (%) - Other Race
Place of birth - Native, outside of US (%)
Place of birth - Native, outside of US (%) - White
Place of birth - Native, outside of US (%) - Black or African American
Place of birth - Native, outside of US (%) - Asian
Place of birth - Native, outside of US (%) - Hispanic or Latino
Place of birth - Native, outside of US (%) - American Indian and Alaska Native
Place of birth - Native, outside of US (%) - Multirace
Place of birth - Native, outside of US (%) - Other Race
Place of birth - Foreign born (%)
Place of birth - Foreign born (%) - White
Place of birth - Foreign born (%) - Black or African American
Place of birth - Foreign born (%) - Asian
Place of birth - Foreign born (%) - Hispanic or Latino
Place of birth - Foreign born (%) - American Indian and Alaska Native
Place of birth - Foreign born (%) - Multirace
Place of birth - Foreign born (%) - Other Race
Residents speaking English at home (%)
Residents speaking English at home - Born in the United States (%)
Residents speaking English at home - Native, born elsewhere (%)
Residents speaking English at home - Foreign born (%)
Residents speaking Spanish at home (%)
Residents speaking Spanish at home - Born in the United States (%)
Residents speaking Spanish at home - Native, born elsewhere (%)
Residents speaking Spanish at home - Foreign born (%)
Residents speaking other language at home (%)
Residents speaking other language at home - Born in the United States (%)
Residents speaking other language at home - Native, born elsewhere (%)
Residents speaking other language at home - Foreign born (%)
Marital status - Never married (%)
Marital status - Now married (%)
Marital status - Separated (%)
Marital status - Widowed (%)
Marital status - Divorced (%)
Ancestries Reported - Arab (%)
Ancestries Reported - Czech (%)
Ancestries Reported - Danish (%)
Ancestries Reported - Dutch (%)
Ancestries Reported - English (%)
Ancestries Reported - French (%)
Ancestries Reported - French Canadian (%)
Ancestries Reported - German (%)
Ancestries Reported - Greek (%)
Ancestries Reported - Hungarian (%)
Ancestries Reported - Irish (%)
Ancestries Reported - Italian (%)
Ancestries Reported - Lithuanian (%)
Ancestries Reported - Norwegian (%)
Ancestries Reported - Polish (%)
Ancestries Reported - Portuguese (%)
Ancestries Reported - Russian (%)
Ancestries Reported - Scotch-Irish (%)
Ancestries Reported - Scottish (%)
Ancestries Reported - Slovak (%)
Ancestries Reported - Subsaharan African (%)
Ancestries Reported - Swedish (%)
Ancestries Reported - Swiss (%)
Ancestries Reported - Ukrainian (%)
Ancestries Reported - United States (%)
Ancestries Reported - Welsh (%)
Ancestries Reported - West Indian (%)
Ancestries Reported - Other (%)
Geographical mobility - Same house 1 year ago (%)
Geographical mobility - Same house 1 year ago (%) - White
Geographical mobility - Same house 1 year ago (%) - Black or African American
Geographical mobility - Same house 1 year ago (%) - Asian
Geographical mobility - Same house 1 year ago (%) - Hispanic or Latino
Geographical mobility - Same house 1 year ago (%) - American Indian and Alaska Native
Geographical mobility - Same house 1 year ago (%) - Multirace
Geographical mobility - Same house 1 year ago (%) - Other Race
Geographical mobility - Moved within same county (%)
Geographical mobility - Moved within same county (%) - White
Geographical mobility - Moved within same county (%) - Black or African American
Geographical mobility - Moved within same county (%) - Asian
Geographical mobility - Moved within same county (%) - Hispanic or Latino
Geographical mobility - Moved within same county (%) - American Indian and Alaska Native
Geographical mobility - Moved within same county (%) - Multirace
Geographical mobility - Moved within same county (%) - Other Race
Geographical mobility - Moved from different county within same state (%)
Geographical mobility - Moved from different county within same state (%) - White
Geographical mobility - Moved from different county within same state (%) - Black or African American
Geographical mobility - Moved from different county within same state (%) - Asian
Geographical mobility - Moved from different county within same state (%) - Hispanic or Latino
Geographical mobility - Moved from different county within same state (%) - American Indian and Alaska Native
Geographical mobility - Moved from different county within same state (%) - Multirace
Geographical mobility - Moved from different county within same state (%) - Other Race
Geographical mobility - Moved from different state (%)
Geographical mobility - Moved from different state (%) - White
Geographical mobility - Moved from different state (%) - Black or African American
Geographical mobility - Moved from different state (%) - Asian
Geographical mobility - Moved from different state (%) - Hispanic or Latino
Geographical mobility - Moved from different state (%) - American Indian and Alaska Native
Geographical mobility - Moved from different state (%) - Multirace
Geographical mobility - Moved from different state (%) - Other Race
Geographical mobility - Moved from abroad (%)
Geographical mobility - Moved from abroad (%) - White
Geographical mobility - Moved from abroad (%) - Black or African American
Geographical mobility - Moved from abroad (%) - Asian
Geographical mobility - Moved from abroad (%) - Hispanic or Latino
Geographical mobility - Moved from abroad (%) - American Indian and Alaska Native
Geographical mobility - Moved from abroad (%) - Multirace
Geographical mobility - Moved from abroad (%) - Other Race
Place of birth for the foreign-born population - Ireland (%)
Place of birth for the foreign-born population - Denmark (%)
Place of birth for the foreign-born population - Norway (%)
Place of birth for the foreign-born population - Sweden (%)
Place of birth for the foreign-born population - United Kingdom (%)
Place of birth for the foreign-born population - England (%)
Place of birth for the foreign-born population - Scotland (%)
Place of birth for the foreign-born population - Other Northern Europe (%)
Place of birth for the foreign-born population - Austria (%)
Place of birth for the foreign-born population - Belgium (%)
Place of birth for the foreign-born population - France (%)
Place of birth for the foreign-born population - Germany (%)
Place of birth for the foreign-born population - Netherlands (%)
Place of birth for the foreign-born population - Switzerland (%)
Place of birth for the foreign-born population - Other Western Europe (%)
Place of birth for the foreign-born population - Greece (%)
Place of birth for the foreign-born population - Italy (%)
Place of birth for the foreign-born population - Portugal (%)
Place of birth for the foreign-born population - Spain (%)
Place of birth for the foreign-born population - Other Southern Europe (%)
Place of birth for the foreign-born population - Albania (%)
Place of birth for the foreign-born population - Belarus (%)
Place of birth for the foreign-born population - Bosnia and Herzegovina (%)
Place of birth for the foreign-born population - Bulgaria (%)
Place of birth for the foreign-born population - Croatia (%)
Place of birth for the foreign-born population - Czechoslovakia (%)
Place of birth for the foreign-born population - Hungary (%)
Place of birth for the foreign-born population - Latvia (%)
Place of birth for the foreign-born population - Lithuania (%)
Place of birth for the foreign-born population - North Macedonia (Macedonia) (%)
Place of birth for the foreign-born population - Moldova (%)
Place of birth for the foreign-born population - Poland (%)
Place of birth for the foreign-born population - Romania (%)
Place of birth for the foreign-born population - Russia (%)
Place of birth for the foreign-born population - Serbia (%)
Place of birth for the foreign-born population - Ukraine (%)
Place of birth for the foreign-born population - Other Eastern Europe (%)
Place of birth for the foreign-born population - China (%)
Place of birth for the foreign-born population - Hong Kong (%)
Place of birth for the foreign-born population - Taiwan (%)
Place of birth for the foreign-born population - Japan (%)
Place of birth for the foreign-born population - Korea (%)
Place of birth for the foreign-born population - Other Eastern Asia (%)
Place of birth for the foreign-born population - Afghanistan (%)
Place of birth for the foreign-born population - Bangladesh (%)
Place of birth for the foreign-born population - India (%)
Place of birth for the foreign-born population - Iran (%)
Place of birth for the foreign-born population - Kazakhstan (%)
Place of birth for the foreign-born population - Nepal (%)
Place of birth for the foreign-born population - Pakistan (%)
Place of birth for the foreign-born population - Sri Lanka (%)
Place of birth for the foreign-born population - Uzbekistan (%)
Place of birth for the foreign-born population - Other South Central Asia (%)
Place of birth for the foreign-born population - Burma (%)
Place of birth for the foreign-born population - Cambodia (%)
Place of birth for the foreign-born population - Indonesia (%)
Place of birth for the foreign-born population - Laos (%)
Place of birth for the foreign-born population - Malaysia (%)
Place of birth for the foreign-born population - Philippines (%)
Place of birth for the foreign-born population - Singapore (%)
Place of birth for the foreign-born population - Thailand (%)
Place of birth for the foreign-born population - Vietnam (%)
Place of birth for the foreign-born population - Other South Eastern Asia (%)
Place of birth for the foreign-born population - Armenia (%)
Place of birth for the foreign-born population - Iraq (%)
Place of birth for the foreign-born population - Israel (%)
Place of birth for the foreign-born population - Jordan (%)
Place of birth for the foreign-born population - Kuwait (%)
Place of birth for the foreign-born population - Lebanon (%)
Place of birth for the foreign-born population - Saudi Arabia (%)
Place of birth for the foreign-born population - Syria (%)
Place of birth for the foreign-born population - Turkey (%)
Place of birth for the foreign-born population - Yemen (%)
Place of birth for the foreign-born population - Other Western Asia (%)
Place of birth for the foreign-born population - Eritrea (%)
Place of birth for the foreign-born population - Ethiopia (%)
Place of birth for the foreign-born population - Kenya (%)
Place of birth for the foreign-born population - Somalia (%)
Place of birth for the foreign-born population - Uganda (%)
Place of birth for the foreign-born population - Zimbabwe (%)
Place of birth for the foreign-born population - Other Eastern Africa (%)
Place of birth for the foreign-born population - Cameroon (%)
Place of birth for the foreign-born population - Congo (%)
Place of birth for the foreign-born population - Democratic Republic of Congo (Zaire) (%)
Place of birth for the foreign-born population - Other Middle Africa (%)
Place of birth for the foreign-born population - Egypt (%)
Place of birth for the foreign-born population - Morocco (%)
Place of birth for the foreign-born population - Sudan (%)
Place of birth for the foreign-born population - Other Northern Africa (%)
Place of birth for the foreign-born population - South Africa (%)
Place of birth for the foreign-born population - Other Southern Africa (%)
Place of birth for the foreign-born population - Cabo Verde (%)
Place of birth for the foreign-born population - Ghana (%)
Place of birth for the foreign-born population - Liberia (%)
Place of birth for the foreign-born population - Nigeria (%)
Place of birth for the foreign-born population - Senegal (%)
Place of birth for the foreign-born population - Sierra Leone (%)
Place of birth for the foreign-born population - Other Western Africa (%)
Place of birth for the foreign-born population - Australia (%)
Place of birth for the foreign-born population - New Zealand (%)
Place of birth for the foreign-born population - Fiji (%)
Place of birth for the foreign-born population - Micronesia (%)
Place of birth for the foreign-born population - Bahamas (%)
Place of birth for the foreign-born population - Barbados (%)
Place of birth for the foreign-born population - Cuba (%)
Place of birth for the foreign-born population - Dominica (%)
Place of birth for the foreign-born population - Dominican Republic (%)
Place of birth for the foreign-born population - Grenada (%)
Place of birth for the foreign-born population - Haiti (%)
Place of birth for the foreign-born population - Jamaica (%)
Place of birth for the foreign-born population - St. Vincent and the Grenadines (%)
Place of birth for the foreign-born population - Trinidad and Tobago (%)
Place of birth for the foreign-born population - West Indies (%)
Place of birth for the foreign-born population - Other Caribbean (%)
Place of birth for the foreign-born population - Belize (%)
Place of birth for the foreign-born population - Costa Rica (%)
Place of birth for the foreign-born population - El Salvador (%)
Place of birth for the foreign-born population - Guatemala (%)
Place of birth for the foreign-born population - Honduras (%)
Place of birth for the foreign-born population - Mexico (%)
Place of birth for the foreign-born population - Nicaragua (%)
Place of birth for the foreign-born population - Panama (%)
Place of birth for the foreign-born population - Other Central America (%)
Place of birth for the foreign-born population - Argentina (%)
Place of birth for the foreign-born population - Bolivia (%)
Place of birth for the foreign-born population - Brazil (%)
Place of birth for the foreign-born population - Chile (%)
Place of birth for the foreign-born population - Colombia (%)
Place of birth for the foreign-born population - Ecuador (%)
Place of birth for the foreign-born population - Guyana (%)
Place of birth for the foreign-born population - Peru (%)
Place of birth for the foreign-born population - Uruguay (%)
Place of birth for the foreign-born population - Venezuela (%)
Place of birth for the foreign-born population - Other South America (%)
Place of birth for the foreign-born population - Canada (%)
Place of birth for the foreign-born population - Other Northern America (%)
Place of birth for the foreign-born population - Other (%)
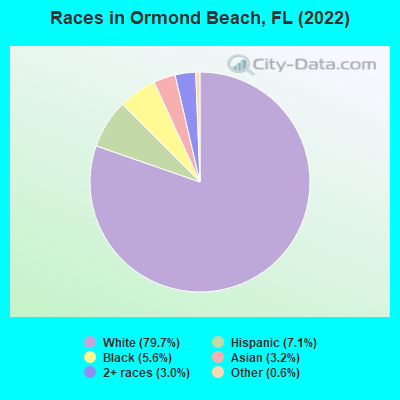
According to 2022 data, the most numerous races in Ormond Beach, FL are White alone (35,657 residents), Hispanic (3,177 residents), and Black alone (2,507 residents). 91.4% of Ormond Beach residents speak English at home. 7.3% of Ormond Beach, FL residents are foreign-born (2.2% born in Latin America, 1.8% born in Asia, 1.7% born in Europe), which is 188.9% less than the foreign-born rate of 21.0% across the entire state of Florida.
Race distribution in Ormond Beach
2000 2022
10,458,509 65.4% White alone 2,682,715 16.8% Hispanic 2,264,268 14.2% Black alone 261,693 1.6% Asian alone 236,954 1.5% Two or more races 42,358 0.3% American Indian alone 28,994 0.2% Other race alone 6,887 0.04% Native Hawaiian and Other
11,309,403 50.8% White alone 6,025,039 27.1% Hispanic 3,241,015 14.6% Black alone 861,630 3.9% Two or more races 623,692 2.8% Asian alone 152,054 0.7% Other race alone 22,504 0.1% American Indian alone 9,486 0.04% Native Hawaiian and Other
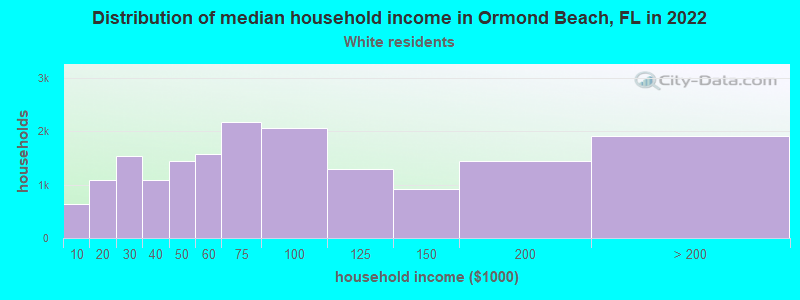
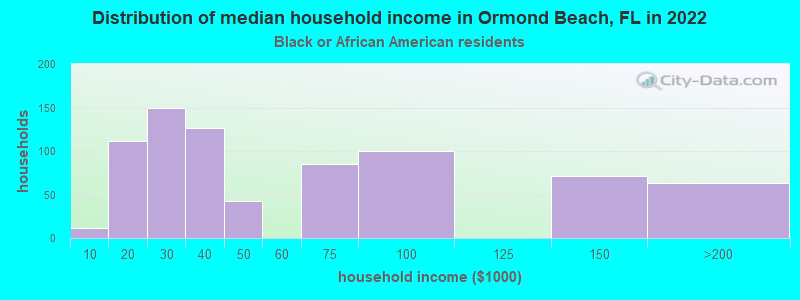
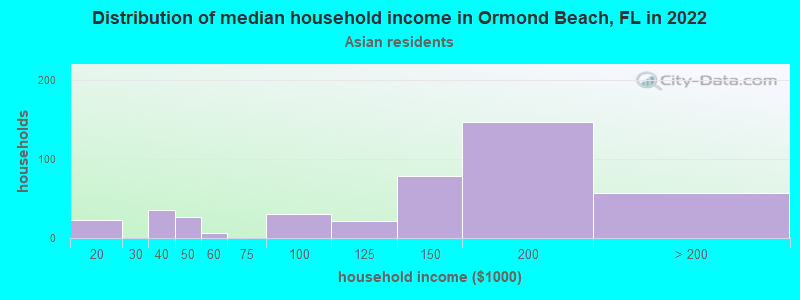
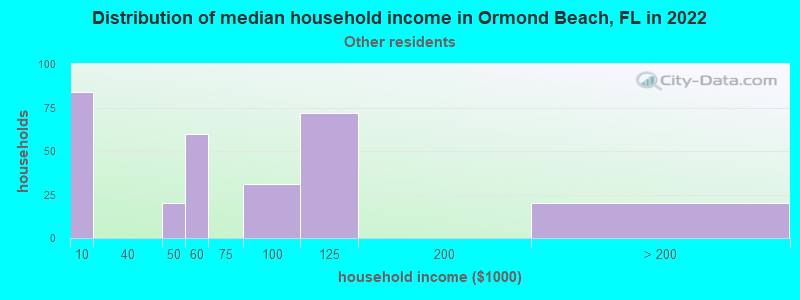
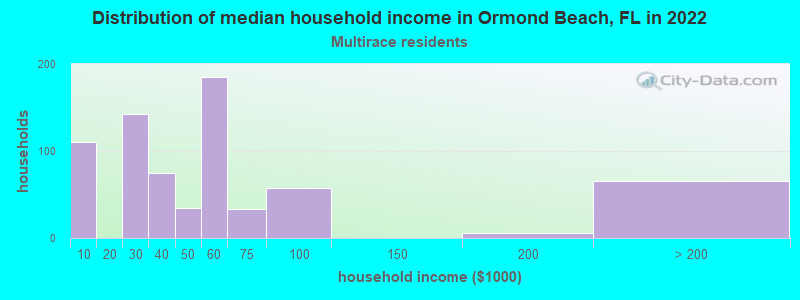
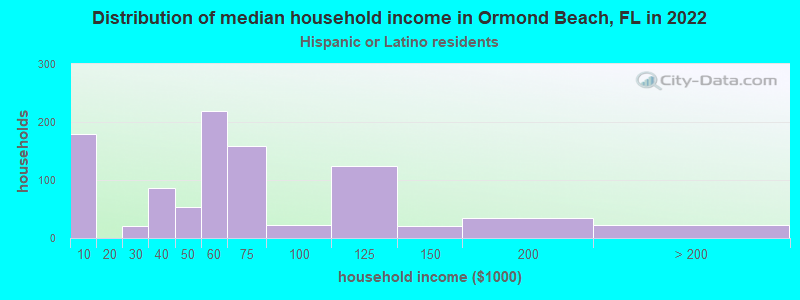
Income and house value in Ormond Beach Median household income in 2022 $67,458 White non-Hispanic householders$40,242 Black householders$185,790 Asian householders$34,109 Two or more races householders$57,043 Hispanic or Latino race householdersMedian 2022 house value $391,190 White Non-Hispanic householders$317,753 Black or African American householders $706,119 Asian householders$397,192 Native Hawaiian and other Pacific Islander householders$330,110 Two or more races householders$352,000 Hispanic or Latino householders
Median age by race in Ormond Beach
55.6 Median age for White residents53.2 58.5 30.4 Median age for Black or African American residents16.8 50.2 32.8 Median age for American Indian / Alaska Native residents-455,981,940.9 30.4 43.8 Median age for Asian residents45.7 47.0 -668,922,729.2 Median age for Native Hawaiian / Pacific Islander residents-668,922,729.2 -443,298,968.6 33.2 Median age for Other race residents20.7 33.5 31.0 Median age for Two or more races residents24.8 36.9 55.8 Median age for White alone residents53.6 58.6 28.5 Median age for Hispanic or Latino residents25.0 31.8
Owner/renter occupied households by race in Ormond Beach
House owners and renters - White residents 13,647 80.1% Owner occupied3,386 19.9% Renter occupiedHouse owners and renters - Black or African American residents 224 30.9% Owner occupied500 69.1% Renter occupiedHouse owners and renters - American Indian / Alaska Native residents 16 100.0% Owner occupiedHouse owners and renters - Asian residents 459 95.9% Owner occupied20 4.1% Renter occupiedHouse owners and renters - Other race residents 255 88.4% Owner occupied33 11.6% Renter occupiedHouse owners and renters - Two or more races residents 302 38.3% Owner occupied486 61.7% Renter occupiedHouse owners and renters - White alone residents 13,735 80.8% Owner occupied3,270 19.2% Renter occupiedHouse owners and renters - Hispanic or Latino residents 479 53.9% Owner occupied410 46.1% Renter occupied
Language usage in Ormond Beach
English speakers - Total 91.4% of residents of Ormond Beach speak English at home.
3.7% of residents speak Spanish at home 1,111 70.9% Speak English very well457 29.1% Speak English less than very well4.9% of residents speak other language at home 1,672 80.8% Speak English very well397 19.2% Speak English less than very well
English speakers - Born in the United States 96.7% of residents of Ormond Beach speak English at home.
1.5% of residents speak Spanish at home 378 98.2% Speak English very well7 1.8% Speak English less than very well1.9% of residents speak other language at home 485 97.8% Speak English very well11 2.2% Speak English less than very well
English speakers - Native, born elsewhere 45.2% of residents of Ormond Beach speak English at home.
47.0% of residents speak Spanish at home 299 68.3% Speak English very well139 31.7% Speak English less than very well4.7% of residents speak other language at home 35 79.5% Speak English very well9 20.5% Speak English less than very well
English speakers - Foreign-born 38.5% of residents of Ormond Beach speak English at home.
16.5% of residents speak Spanish at home 302 61.4% Speak English very well190 38.6% Speak English less than very well46.4% of residents speak other language at home 984 71.0% Speak English very well401 29.0% Speak English less than very well
White (Caucasian) - Speak only English Native:
98.8% (32,572)Foreign-born:
71.1% (937)
White (Caucasian) - Speak another language Native:
2.0% (654)Foreign-born:
38.1% (502)
Black or African American - Speak only English Native:
98.4% (1,856)Foreign-born:
30.4% (78)
Black or African American - Speak another language Native:
0.6% (12)Foreign-born:
61.3% (158)
Asian - Speak only English Native:
54.5% (293)Foreign-born:
3.7% (28)
Asian - Speak another language Native:
49.4% (266)Foreign-born:
100.0% (754)
Other race - Speak only English Native:
57.2% (356)Foreign-born:
20.4% (50)
Other race - Speak another language Native:
47.9% (298)Foreign-born:
81.1% (199)
Two or more races - Speak only English Native:
84.2% (1,318)Foreign-born:
34.3% (135)
Two or more races - Speak another language Native:
12.1% (189)Foreign-born:
63.5% (249)
White alone - Speak only English Native:
98.1% (32,117)Foreign-born:
70.5% (930)
White alone - Speak another language Native:
1.9% (624)Foreign-born:
33.5% (442)
Hispanic or Latino - Speak only English Native:
60.2% (1,181)Foreign-born:
24.3% (160)
Hispanic or Latino - Speak another language Native:
42.8% (840)Foreign-born:
76.6% (504)
Foreign-born residents in Ormond Beach 3,251 residents are foreign born (2.2% Latin America , 1.8% Asia , 1.7% Europe ).
This city:
7.3%Florida:
21.1%
Marital status for residents in Ormond Beach Marital status - White (Caucasian) population 15 years and over
Males 24.5% Never married57.5% Now married0.9% Separated5.8% Widowed11.4% DivorcedFemales 18.0% Never married48.1% Now married0.5% Separated16.0% Widowed17.4% DivorcedWomen who gave birth in the past 12 months Now married:
60.7% (135)Unmarried:
39.3% (87)
Women who did not give birth in the past 12 months Now married:
46.5% (2,554)Unmarried:
53.5% (2,940)
Marital status - Black or African American population 15 years and over
Males 46.5% Never married35.4% Now married1.3% Separated0.5% Widowed16.3% DivorcedFemales 32.9% Never married24.5% Now married8.9% Separated6.6% Widowed27.0% DivorcedWomen who gave birth in the past 12 months Now married:
100.0% (16)Unmarried:
0.0% (0)
Women who did not give birth in the past 12 months Now married:
28.3% (124)Unmarried:
71.7% (315)
Marital status - Asian population 15 years and over
Males 15.2% Never married81.2% Now married3.1% Separated0.0% Widowed0.5% DivorcedFemales 33.9% Never married56.4% Now married0.0% Separated8.6% Widowed1.2% DivorcedWomen who gave birth in the past 12 months Now married:
100.0% (4)Unmarried:
0.0% (0)
Women who did not give birth in the past 12 months Now married:
45.1% (163)Unmarried:
54.9% (198)
Marital status - Other race population 15 years and over
Males 35.7% Never married42.9% Now married0.0% Separated0.0% Widowed21.4% DivorcedFemales 7.3% Never married63.3% Now married0.0% Separated9.7% Widowed19.7% DivorcedWomen who gave birth in the past 12 months Now married:
100.0% (69)Unmarried:
0.0% (0)
Women who did not give birth in the past 12 months Now married:
60.4% (122)Unmarried:
39.6% (80)
Marital status - Two or more races population 15 years and over
Males 51.5% Never married26.6% Now married0.0% Separated7.0% Widowed14.9% DivorcedFemales 35.2% Never married25.2% Now married9.0% Separated2.9% Widowed27.7% DivorcedWomen who gave birth in the past 12 months Now married:
100.0% (43)Unmarried:
0.0% (0)
Women who did not give birth in the past 12 months Now married:
19.0% (105)Unmarried:
81.0% (446)
Marital status - White alone, not Hispanic / Latino population 15 years and over
Males 22.8% Never married58.9% Now married0.9% Separated6.1% Widowed11.3% DivorcedFemales 17.3% Never married48.5% Now married0.5% Separated16.2% Widowed17.5% DivorcedWomen who gave birth in the past 12 months Now married:
78.7% (124)Unmarried:
21.3% (34)
Women who did not give birth in the past 12 months Now married:
46.7% (2,576)Unmarried:
53.3% (2,942)
Marital status - Hispanic or Latino population 15 years and over
Males 57.2% Never married30.9% Now married0.0% Separated0.0% Widowed11.9% DivorcedFemales 30.1% Never married45.1% Now married3.2% Separated5.9% Widowed15.7% DivorcedWomen who gave birth in the past 12 months Now married:
52.5% (71)Unmarried:
47.5% (64)
Women who did not give birth in the past 12 months Now married:
42.9% (266)Unmarried:
57.1% (354)
Ancestries in Ormond Beach
3,565 16.9% English2,963 14.0% Italian2,364 11.2% Irish2,287 10.8% American1,790 8.5% German347 1.6% European325 1.5% Polish319 1.5% Scottish299 1.4% Scandinavian202 1.0% French161 0.8% Norwegian160 0.8% Scotch-Irish148 0.7% Czech126 0.6% French Canadian112 0.5% Greek97 0.5% Hungarian92 0.4% Portuguese89 0.4% British88 0.4% Canadian80 0.4% Ukrainian70 0.3% Brazilian69 0.3% Jamaican65 0.3% Lithuanian61 0.3% Iranian57 0.3% Dutch53 0.3% Welsh47 0.2% Czechoslovakian45 0.2% Slovak39 0.2% Egyptian31 0.1% Haitian28 0.1% Austrian28 0.1% Slavic27 0.1% Lebanese27 0.1% Russian26 0.1% Danish23 0.1% Eastern European22 0.1% Northern European22 0.1% African20 0.09% Yugoslavian19 0.09% Arab19 0.09% Swiss16 0.08% South African16 0.08% Syrian16 0.08% Swedish16 0.08% Palestinian15 0.07% Moroccan12 0.06% Turkish9 0.04% Belgian7 0.03% Armenian7 0.03% Slovene7 0.03% Croatian6 0.03% Finnish4 0.02% Guyanese
Geographical mobility in Ormond Beach Same house 1 year ago 32,379 90.2% White (Caucasian)2,309 90.5% Black or African American49 100.0% American Indian / Alaska Native1,489 100.0% Asian16 100.0% Native Hawaiian / Pacific Islander688 73.1% Other race1,928 86.7% Two or more races32,064 90.3% White alone, not Hispanic / Latino2,368 78.2% Hispanic or LatinoMoved within same county 1,492 4.2% White / Caucasian137 5.4% Black or African American19 1.3% Asian174 18.4% Other race157 7.0% Two or more races1,324 3.7% White alone, not Hispanic / Latino362 12.0% Hispanic or LatinoMoved within same state 806 2.2% White / Caucasian126 4.9% Black or African American20 1.4% Asian34 3.6% Other race52 2.4% Two or more races786 2.2% White alone, not Hispanic / Latino169 5.6% Hispanic or LatinoMoved from different state 1,198 3.3% White / Caucasian7 0.3% Black or African American11 0.7% Asian44 4.7% Other race5 0.2% Two or more races1,264 3.6% White alone, not Hispanic / Latino49 1.6% Hispanic or LatinoMoved from abroad 30 0.1% White16 0.7% Two or more races43 0.1% White alone, not Hispanic / Latino34 1.1% Hispanic or Latino
Children Nativity (place of birth) in Ormond Beach
Children under 6 years - Living with two parents Both parents native 1,643 100.0% Native0 0.0% Foreign-bornBoth parents foreign-born 46 100.0% NativeOne native, one foreign-born parent 298 91.7% Native27 8.3% Foreign-bornChildren under 6 years - Living with one parent Native parent 769 100.0% NativeForeign-born parent 18 100.0% NativeChildren 6 to 17 years - Living with two parents Both parents native 2,356 99.8% Native4 0.2% Foreign-bornBoth parents foreign-born 90 66.0% Native46 34.0% Foreign-bornOne native, one foreign-born parent 185 100.0% NativeChildren 6 to 17 years - Living with one parent Native parent 1,536 100.0% NativeForeign-born parent 89 53.0% Native79 47.0% Foreign-born
Grandparents responsible for own grandchildren in Ormond Beach
Grandparents (30 to 59 years) White / Caucasian 89 58.7% Responsible for grandchildren62 41.3% Not responsible for grandchildrenBlack or African American 29 100.0% Not responsible for grandchildrenOther race 34 46.0% Responsible for grandchildren40 54.0% Not responsible for grandchildrenWhite alone, not Hispanic / Latino 91 57.2% Responsible for grandchildren69 42.8% Not responsible for grandchildrenHispanic or Latino 12 26.9% Responsible for grandchildren32 73.1% Not responsible for grandchildrenGrandparents (60 years and over) White / Caucasian 97 25.0% Responsible for grandchildren289 75.0% Not responsible for grandchildrenBlack or African American 13 15.3% Responsible for grandchildren75 84.7% Not responsible for grandchildrenOther race 37 57.6% Responsible for grandchildren27 42.4% Not responsible for grandchildrenWhite alone, not Hispanic / Latino 96 25.4% Responsible for grandchildren281 74.6% Not responsible for grandchildren