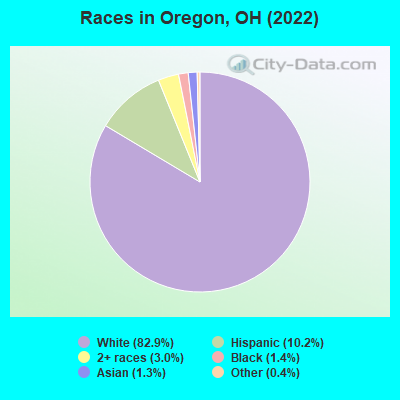
Races in Oregon, Ohio (OH) Detailed Stats
Data:
Races - White alone (%)
Races - White alone (% change since 2000)
Races - Black alone (%)
Races - Black alone (% change since 2000)
Races - American Indian alone (%)
Races - American Indian alone (% change since 2000)
Races - Asian alone (%)
Races - Asian alone (% change since 2000)
Races - Hispanic (%)
Races - Hispanic (% change since 2000)
Races - Native Hawaiian and Other Pacific Islander alone (%)
Races - Native Hawaiian and Other Pacific Islander alone (% change since 2000)
Races - Two or more races(%)
Races - Two or more races(% change since 2000)
Races - Other race alone (%)
Races - Other race alone (% change since 2000)
Racial diversity
Place of birth - Born in state of residence (%)
Place of birth - Born in state of residence (%) - White
Place of birth - Born in state of residence (%) - Black or African American
Place of birth - Born in state of residence (%) - Asian
Place of birth - Born in state of residence (%) - Hispanic or Latino
Place of birth - Born in state of residence (%) - American Indian and Alaska Native
Place of birth - Born in state of residence (%) - Multirace
Place of birth - Born in state of residence (%) - Other Race
Place of birth - Born in other state (%)
Place of birth - Born in other state (%) - White
Place of birth - Born in other state (%) - Black or African American
Place of birth - Born in other state (%) - Asian
Place of birth - Born in other state (%) - Hispanic or Latino
Place of birth - Born in other state (%) - American Indian and Alaska Native
Place of birth - Born in other state (%) - Multirace
Place of birth - Born in other state (%) - Other Race
Place of birth - Native, outside of US (%)
Place of birth - Native, outside of US (%) - White
Place of birth - Native, outside of US (%) - Black or African American
Place of birth - Native, outside of US (%) - Asian
Place of birth - Native, outside of US (%) - Hispanic or Latino
Place of birth - Native, outside of US (%) - American Indian and Alaska Native
Place of birth - Native, outside of US (%) - Multirace
Place of birth - Native, outside of US (%) - Other Race
Place of birth - Foreign born (%)
Place of birth - Foreign born (%) - White
Place of birth - Foreign born (%) - Black or African American
Place of birth - Foreign born (%) - Asian
Place of birth - Foreign born (%) - Hispanic or Latino
Place of birth - Foreign born (%) - American Indian and Alaska Native
Place of birth - Foreign born (%) - Multirace
Place of birth - Foreign born (%) - Other Race
Residents speaking English at home (%)
Residents speaking English at home - Born in the United States (%)
Residents speaking English at home - Native, born elsewhere (%)
Residents speaking English at home - Foreign born (%)
Residents speaking Spanish at home (%)
Residents speaking Spanish at home - Born in the United States (%)
Residents speaking Spanish at home - Native, born elsewhere (%)
Residents speaking Spanish at home - Foreign born (%)
Residents speaking other language at home (%)
Residents speaking other language at home - Born in the United States (%)
Residents speaking other language at home - Native, born elsewhere (%)
Residents speaking other language at home - Foreign born (%)
Marital status - Never married (%)
Marital status - Now married (%)
Marital status - Separated (%)
Marital status - Widowed (%)
Marital status - Divorced (%)
Ancestries Reported - Arab (%)
Ancestries Reported - Czech (%)
Ancestries Reported - Danish (%)
Ancestries Reported - Dutch (%)
Ancestries Reported - English (%)
Ancestries Reported - French (%)
Ancestries Reported - French Canadian (%)
Ancestries Reported - German (%)
Ancestries Reported - Greek (%)
Ancestries Reported - Hungarian (%)
Ancestries Reported - Irish (%)
Ancestries Reported - Italian (%)
Ancestries Reported - Lithuanian (%)
Ancestries Reported - Norwegian (%)
Ancestries Reported - Polish (%)
Ancestries Reported - Portuguese (%)
Ancestries Reported - Russian (%)
Ancestries Reported - Scotch-Irish (%)
Ancestries Reported - Scottish (%)
Ancestries Reported - Slovak (%)
Ancestries Reported - Subsaharan African (%)
Ancestries Reported - Swedish (%)
Ancestries Reported - Swiss (%)
Ancestries Reported - Ukrainian (%)
Ancestries Reported - United States (%)
Ancestries Reported - Welsh (%)
Ancestries Reported - West Indian (%)
Ancestries Reported - Other (%)
Geographical mobility - Same house 1 year ago (%)
Geographical mobility - Same house 1 year ago (%) - White
Geographical mobility - Same house 1 year ago (%) - Black or African American
Geographical mobility - Same house 1 year ago (%) - Asian
Geographical mobility - Same house 1 year ago (%) - Hispanic or Latino
Geographical mobility - Same house 1 year ago (%) - American Indian and Alaska Native
Geographical mobility - Same house 1 year ago (%) - Multirace
Geographical mobility - Same house 1 year ago (%) - Other Race
Geographical mobility - Moved within same county (%)
Geographical mobility - Moved within same county (%) - White
Geographical mobility - Moved within same county (%) - Black or African American
Geographical mobility - Moved within same county (%) - Asian
Geographical mobility - Moved within same county (%) - Hispanic or Latino
Geographical mobility - Moved within same county (%) - American Indian and Alaska Native
Geographical mobility - Moved within same county (%) - Multirace
Geographical mobility - Moved within same county (%) - Other Race
Geographical mobility - Moved from different county within same state (%)
Geographical mobility - Moved from different county within same state (%) - White
Geographical mobility - Moved from different county within same state (%) - Black or African American
Geographical mobility - Moved from different county within same state (%) - Asian
Geographical mobility - Moved from different county within same state (%) - Hispanic or Latino
Geographical mobility - Moved from different county within same state (%) - American Indian and Alaska Native
Geographical mobility - Moved from different county within same state (%) - Multirace
Geographical mobility - Moved from different county within same state (%) - Other Race
Geographical mobility - Moved from different state (%)
Geographical mobility - Moved from different state (%) - White
Geographical mobility - Moved from different state (%) - Black or African American
Geographical mobility - Moved from different state (%) - Asian
Geographical mobility - Moved from different state (%) - Hispanic or Latino
Geographical mobility - Moved from different state (%) - American Indian and Alaska Native
Geographical mobility - Moved from different state (%) - Multirace
Geographical mobility - Moved from different state (%) - Other Race
Geographical mobility - Moved from abroad (%)
Geographical mobility - Moved from abroad (%) - White
Geographical mobility - Moved from abroad (%) - Black or African American
Geographical mobility - Moved from abroad (%) - Asian
Geographical mobility - Moved from abroad (%) - Hispanic or Latino
Geographical mobility - Moved from abroad (%) - American Indian and Alaska Native
Geographical mobility - Moved from abroad (%) - Multirace
Geographical mobility - Moved from abroad (%) - Other Race
Place of birth for the foreign-born population - Ireland (%)
Place of birth for the foreign-born population - Denmark (%)
Place of birth for the foreign-born population - Norway (%)
Place of birth for the foreign-born population - Sweden (%)
Place of birth for the foreign-born population - United Kingdom (%)
Place of birth for the foreign-born population - England (%)
Place of birth for the foreign-born population - Scotland (%)
Place of birth for the foreign-born population - Other Northern Europe (%)
Place of birth for the foreign-born population - Austria (%)
Place of birth for the foreign-born population - Belgium (%)
Place of birth for the foreign-born population - France (%)
Place of birth for the foreign-born population - Germany (%)
Place of birth for the foreign-born population - Netherlands (%)
Place of birth for the foreign-born population - Switzerland (%)
Place of birth for the foreign-born population - Other Western Europe (%)
Place of birth for the foreign-born population - Greece (%)
Place of birth for the foreign-born population - Italy (%)
Place of birth for the foreign-born population - Portugal (%)
Place of birth for the foreign-born population - Spain (%)
Place of birth for the foreign-born population - Other Southern Europe (%)
Place of birth for the foreign-born population - Albania (%)
Place of birth for the foreign-born population - Belarus (%)
Place of birth for the foreign-born population - Bosnia and Herzegovina (%)
Place of birth for the foreign-born population - Bulgaria (%)
Place of birth for the foreign-born population - Croatia (%)
Place of birth for the foreign-born population - Czechoslovakia (%)
Place of birth for the foreign-born population - Hungary (%)
Place of birth for the foreign-born population - Latvia (%)
Place of birth for the foreign-born population - Lithuania (%)
Place of birth for the foreign-born population - North Macedonia (Macedonia) (%)
Place of birth for the foreign-born population - Moldova (%)
Place of birth for the foreign-born population - Poland (%)
Place of birth for the foreign-born population - Romania (%)
Place of birth for the foreign-born population - Russia (%)
Place of birth for the foreign-born population - Serbia (%)
Place of birth for the foreign-born population - Ukraine (%)
Place of birth for the foreign-born population - Other Eastern Europe (%)
Place of birth for the foreign-born population - China (%)
Place of birth for the foreign-born population - Hong Kong (%)
Place of birth for the foreign-born population - Taiwan (%)
Place of birth for the foreign-born population - Japan (%)
Place of birth for the foreign-born population - Korea (%)
Place of birth for the foreign-born population - Other Eastern Asia (%)
Place of birth for the foreign-born population - Afghanistan (%)
Place of birth for the foreign-born population - Bangladesh (%)
Place of birth for the foreign-born population - India (%)
Place of birth for the foreign-born population - Iran (%)
Place of birth for the foreign-born population - Kazakhstan (%)
Place of birth for the foreign-born population - Nepal (%)
Place of birth for the foreign-born population - Pakistan (%)
Place of birth for the foreign-born population - Sri Lanka (%)
Place of birth for the foreign-born population - Uzbekistan (%)
Place of birth for the foreign-born population - Other South Central Asia (%)
Place of birth for the foreign-born population - Burma (%)
Place of birth for the foreign-born population - Cambodia (%)
Place of birth for the foreign-born population - Indonesia (%)
Place of birth for the foreign-born population - Laos (%)
Place of birth for the foreign-born population - Malaysia (%)
Place of birth for the foreign-born population - Philippines (%)
Place of birth for the foreign-born population - Singapore (%)
Place of birth for the foreign-born population - Thailand (%)
Place of birth for the foreign-born population - Vietnam (%)
Place of birth for the foreign-born population - Other South Eastern Asia (%)
Place of birth for the foreign-born population - Armenia (%)
Place of birth for the foreign-born population - Iraq (%)
Place of birth for the foreign-born population - Israel (%)
Place of birth for the foreign-born population - Jordan (%)
Place of birth for the foreign-born population - Kuwait (%)
Place of birth for the foreign-born population - Lebanon (%)
Place of birth for the foreign-born population - Saudi Arabia (%)
Place of birth for the foreign-born population - Syria (%)
Place of birth for the foreign-born population - Turkey (%)
Place of birth for the foreign-born population - Yemen (%)
Place of birth for the foreign-born population - Other Western Asia (%)
Place of birth for the foreign-born population - Eritrea (%)
Place of birth for the foreign-born population - Ethiopia (%)
Place of birth for the foreign-born population - Kenya (%)
Place of birth for the foreign-born population - Somalia (%)
Place of birth for the foreign-born population - Uganda (%)
Place of birth for the foreign-born population - Zimbabwe (%)
Place of birth for the foreign-born population - Other Eastern Africa (%)
Place of birth for the foreign-born population - Cameroon (%)
Place of birth for the foreign-born population - Congo (%)
Place of birth for the foreign-born population - Democratic Republic of Congo (Zaire) (%)
Place of birth for the foreign-born population - Other Middle Africa (%)
Place of birth for the foreign-born population - Egypt (%)
Place of birth for the foreign-born population - Morocco (%)
Place of birth for the foreign-born population - Sudan (%)
Place of birth for the foreign-born population - Other Northern Africa (%)
Place of birth for the foreign-born population - South Africa (%)
Place of birth for the foreign-born population - Other Southern Africa (%)
Place of birth for the foreign-born population - Cabo Verde (%)
Place of birth for the foreign-born population - Ghana (%)
Place of birth for the foreign-born population - Liberia (%)
Place of birth for the foreign-born population - Nigeria (%)
Place of birth for the foreign-born population - Senegal (%)
Place of birth for the foreign-born population - Sierra Leone (%)
Place of birth for the foreign-born population - Other Western Africa (%)
Place of birth for the foreign-born population - Australia (%)
Place of birth for the foreign-born population - New Zealand (%)
Place of birth for the foreign-born population - Fiji (%)
Place of birth for the foreign-born population - Micronesia (%)
Place of birth for the foreign-born population - Bahamas (%)
Place of birth for the foreign-born population - Barbados (%)
Place of birth for the foreign-born population - Cuba (%)
Place of birth for the foreign-born population - Dominica (%)
Place of birth for the foreign-born population - Dominican Republic (%)
Place of birth for the foreign-born population - Grenada (%)
Place of birth for the foreign-born population - Haiti (%)
Place of birth for the foreign-born population - Jamaica (%)
Place of birth for the foreign-born population - St. Vincent and the Grenadines (%)
Place of birth for the foreign-born population - Trinidad and Tobago (%)
Place of birth for the foreign-born population - West Indies (%)
Place of birth for the foreign-born population - Other Caribbean (%)
Place of birth for the foreign-born population - Belize (%)
Place of birth for the foreign-born population - Costa Rica (%)
Place of birth for the foreign-born population - El Salvador (%)
Place of birth for the foreign-born population - Guatemala (%)
Place of birth for the foreign-born population - Honduras (%)
Place of birth for the foreign-born population - Mexico (%)
Place of birth for the foreign-born population - Nicaragua (%)
Place of birth for the foreign-born population - Panama (%)
Place of birth for the foreign-born population - Other Central America (%)
Place of birth for the foreign-born population - Argentina (%)
Place of birth for the foreign-born population - Bolivia (%)
Place of birth for the foreign-born population - Brazil (%)
Place of birth for the foreign-born population - Chile (%)
Place of birth for the foreign-born population - Colombia (%)
Place of birth for the foreign-born population - Ecuador (%)
Place of birth for the foreign-born population - Guyana (%)
Place of birth for the foreign-born population - Peru (%)
Place of birth for the foreign-born population - Uruguay (%)
Place of birth for the foreign-born population - Venezuela (%)
Place of birth for the foreign-born population - Other South America (%)
Place of birth for the foreign-born population - Canada (%)
Place of birth for the foreign-born population - Other Northern America (%)
Place of birth for the foreign-born population - Other (%)
Latest news about races in Oregon, OH collected exclusively by city-data.com from local newspapers, TV, and radio stations
According to 2022 data, the most numerous races in Oregon, OH are White alone (16,361 residents), Black alone (274 residents), and Two or more races (592 residents). 95.0% of Oregon residents speak English at home. 2.9% of Oregon, OH residents are foreign-born (1.2% born in Asia, 1.0% born in Latin America, 0.5% born in Europe), which is 38.0% less than the foreign-born rate of 4.0% across the entire state of Ohio.
Race distribution in Oregon
2000 2022
9,538,111 84.0% White alone 1,290,662 11.4% Black alone 217,123 1.9% Hispanic 137,770 1.2% Two or more races 131,670 1.2% Asian alone 21,985 0.2% American Indian alone 13,483 0.1% Other race alone 2,336 0.02% Native Hawaiian and Other
8,948,793 76.1% White alone 1,401,403 11.9% Black alone 529,291 4.5% Two or more races 517,232 4.4% Hispanic 293,387 2.5% Asian alone 52,805 0.4% Other race alone 9,785 0.08% American Indian alone 3,362 0.03% Native Hawaiian and Other
Income and house value in Oregon Median household income in 2022 $71,759 White non-Hispanic householders$23,582 Black householders$114,855 Some other race householders$61,731 Two or more races householders$82,332 Hispanic or Latino race householdersMedian 2022 house value $183,467 White Non-Hispanic householders$183,311 Black or African American householders$175,510 American Indian or Alaska Native householders $329,960 Asian householders$134,636 Some other race householders$217,789 Two or more races householders$158,037 Hispanic or Latino householders
Median age by race in Oregon
48.1 Median age for White residents47.6 47.7 28.0 Median age for Black or African American residents22.8 39.5 13.6 Median age for American Indian / Alaska Native residents-525,581,394.8 -658,163,264.6 35.2 Median age for Asian residents46.5 37.5 -800,387,596.1 Median age for Native Hawaiian / Pacific Islander residents-750,242,953.6 -805,394,989.6 33.8 Median age for Other race residents34.4 34.1 22.9 Median age for Two or more races residents20.3 27.5 47.4 Median age for White alone residents47.3 47.3 28.1 Median age for Hispanic or Latino residents31.3 24.9
Owner/renter occupied households by race in Oregon
House owners and renters - White residents 5,914 78.9% Owner occupied1,578 21.1% Renter occupiedHouse owners and renters - Black or African American residents 10 18.2% Owner occupied47 81.8% Renter occupiedHouse owners and renters - American Indian / Alaska Native residents 1 16.5% Owner occupied6 83.5% Renter occupiedHouse owners and renters - Asian residents 28 18.8% Owner occupied122 81.2% Renter occupiedHouse owners and renters - Other race residents 438 80.8% Owner occupied104 19.2% Renter occupiedHouse owners and renters - Two or more races residents 178 42.6% Owner occupied239 57.4% Renter occupiedHouse owners and renters - White alone residents 5,764 78.3% Owner occupied1,599 21.7% Renter occupiedHouse owners and renters - Hispanic or Latino residents 556 77.3% Owner occupied163 22.7% Renter occupied
Language usage in Oregon
English speakers - Total 95.0% of residents of Oregon speak English at home.
2.8% of residents speak Spanish at home 269 50.3% Speak English very well266 49.7% Speak English less than very well2.4% of residents speak other language at home 243 54.5% Speak English very well203 45.5% Speak English less than very well
English speakers - Born in the United States 90.2% of residents of Oregon speak English at home.
5.7% of residents speak Spanish at home 105 71.9% Speak English very well41 28.1% Speak English less than very well2.4% of residents speak other language at home 34 55.7% Speak English very well27 44.3% Speak English less than very well
English speakers - Native, born elsewhere 79.7% of residents of Oregon speak English at home.
18.6% of residents speak Spanish at home 11 100.0% Speak English very well
English speakers - Foreign-born 17.9% of residents of Oregon speak English at home.
27.7% of residents speak Spanish at home 45 26.9% Speak English very well122 73.1% Speak English less than very well54.2% of residents speak other language at home 153 46.8% Speak English very well174 53.2% Speak English less than very well
White (Caucasian) - Speak only English Native:
98.6% (15,362)Foreign-born:
25.2% (46)
White (Caucasian) - Speak another language Native:
1.5% (228)Foreign-born:
74.7% (137)
Other race - Speak only English Native:
88.0% (707)Foreign-born:
20.4% (46)
Other race - Speak another language Native:
14.9% (119)Foreign-born:
57.4% (129)
Two or more races - Speak another language Native:
7.1% (103)Foreign-born:
100.0% (24)
White alone - Speak only English Native:
99.0% (15,341)Foreign-born:
26.8% (47)
White alone - Speak another language Native:
1.0% (162)Foreign-born:
72.9% (127)
Hispanic or Latino - Speak only English Native:
84.4% (1,465)Foreign-born:
20.3% (42)
Hispanic or Latino - Speak another language Native:
15.9% (276)Foreign-born:
79.7% (165)
Foreign-born residents in Oregon 572 residents are foreign born (1.2% Asia , 1.0% Latin America , 0.5% Europe ).
Marital status for residents in Oregon Marital status - White (Caucasian) population 15 years and over
Males 28.6% Never married55.7% Now married1.1% Separated2.9% Widowed11.6% DivorcedFemales 23.2% Never married52.2% Now married0.7% Separated12.0% Widowed12.0% DivorcedWomen who gave birth in the past 12 months Now married:
78.0% (205)Unmarried:
22.0% (58)
Women who did not give birth in the past 12 months Now married:
45.2% (1,335)Unmarried:
54.8% (1,618)
Marital status - Black or African American population 15 years and over
Males 37.6% Never married42.0% Now married0.0% Separated13.4% Widowed7.0% DivorcedFemales 48.3% Never married25.8% Now married0.0% Separated25.8% Widowed0.0% DivorcedWomen who did not give birth in the past 12 months Now married:
28.9% (12)Unmarried:
71.1% (30)
Marital status - American Indian / Alaska Native population 15 years and over
Males 0.0% Never married0.0% Now married0.0% Separated100.0% Widowed0.0% DivorcedFemales 99.1% Never married0.9% Now married0.0% Separated0.0% Widowed0.0% DivorcedWomen who gave birth in the past 12 months Now married:
100.0% (1)Unmarried:
0.0% (0)
Women who did not give birth in the past 12 months Now married:
0.0% (0)Unmarried:
100.0% (138)
Marital status - Asian population 15 years and over
Males 8.8% Never married13.2% Now married19.1% Separated58.8% Widowed0.0% DivorcedFemales 40.7% Never married48.8% Now married4.1% Separated6.5% Widowed0.0% DivorcedWomen who gave birth in the past 12 months Now married:
100.0% (15)Unmarried:
0.0% (0)
Women who did not give birth in the past 12 months Now married:
46.8% (41)Unmarried:
53.2% (46)
Marital status - Other race population 15 years and over
Males 30.1% Never married69.9% Now married0.0% Separated0.0% Widowed0.0% DivorcedFemales 35.1% Never married62.2% Now married0.0% Separated2.7% Widowed0.0% DivorcedWomen who gave birth in the past 12 months Now married:
36.4% (16)Unmarried:
63.6% (28)
Women who did not give birth in the past 12 months Now married:
42.6% (70)Unmarried:
57.4% (95)
Marital status - Two or more races population 15 years and over
Males 59.6% Never married37.7% Now married0.0% Separated0.0% Widowed2.7% DivorcedFemales 34.9% Never married45.5% Now married0.0% Separated11.1% Widowed8.5% DivorcedWomen who gave birth in the past 12 months Now married:
100.0% (18)Unmarried:
0.0% (0)
Women who did not give birth in the past 12 months Now married:
45.2% (172)Unmarried:
54.8% (208)
Marital status - White alone, not Hispanic / Latino population 15 years and over
Males 28.3% Never married55.9% Now married1.1% Separated3.0% Widowed11.7% DivorcedFemales 23.4% Never married51.8% Now married0.7% Separated11.9% Widowed12.2% DivorcedWomen who gave birth in the past 12 months Now married:
78.0% (207)Unmarried:
22.0% (58)
Women who did not give birth in the past 12 months Now married:
44.6% (1,310)Unmarried:
55.4% (1,626)
Marital status - Hispanic or Latino population 15 years and over
Males 38.2% Never married59.7% Now married0.0% Separated0.0% Widowed2.1% DivorcedFemales 43.1% Never married52.5% Now married0.0% Separated4.4% Widowed0.0% DivorcedWomen who gave birth in the past 12 months Now married:
54.3% (26)Unmarried:
45.7% (22)
Women who did not give birth in the past 12 months Now married:
40.3% (222)Unmarried:
59.7% (329)
Ancestries in Oregon
1,678 20.6% German788 9.7% American662 8.1% English558 6.8% Hungarian389 4.8% Polish375 4.6% Irish324 4.0% Italian159 1.9% Lebanese156 1.9% Scottish118 1.4% European105 1.3% French103 1.3% Greek69 0.8% French Canadian60 0.7% Slovak38 0.5% Eastern European30 0.4% Assyrian30 0.4% Czechoslovakian27 0.3% Dutch20 0.2% Czech19 0.2% Scotch-Irish16 0.2% Ukrainian16 0.2% Yugoslavian15 0.2% African13 0.2% Turkish12 0.1% Swiss11 0.1% Slavic10 0.1% British9 0.1% Finnish9 0.1% Russian8 0.10% Bulgarian8 0.10% Northern European8 0.10% Norwegian6 0.07% Swedish5 0.06% Canadian
Children Nativity (place of birth) in Oregon
Children under 6 years - Living with two parents Both parents native 615 100.0% NativeOne native, one foreign-born parent 20 100.0% NativeChildren under 6 years - Living with one parent Native parent 271 100.0% Native
Children 6 to 17 years - Living with two parents Both parents native 1,927 100.0% NativeBoth parents foreign-born 21 100.0% NativeOne native, one foreign-born parent 39 100.0% NativeChildren 6 to 17 years - Living with one parent Native parent 779 100.0% Native
Grandparents responsible for own grandchildren in Oregon
Grandparents (30 to 59 years) White / Caucasian 19 17.8% Responsible for grandchildren89 82.2% Not responsible for grandchildrenWhite alone, not Hispanic / Latino 20 17.9% Responsible for grandchildren93 82.1% Not responsible for grandchildrenGrandparents (60 years and over) White / Caucasian 108 72.0% Responsible for grandchildren42 28.0% Not responsible for grandchildrenWhite alone, not Hispanic / Latino 108 71.9% Responsible for grandchildren42 28.1% Not responsible for grandchildren