Races in Orange, Connecticut (CT) Detailed Stats
Data:
Races - White alone (%)
Races - White alone (% change since 2000)
Races - Black alone (%)
Races - Black alone (% change since 2000)
Races - American Indian alone (%)
Races - American Indian alone (% change since 2000)
Races - Asian alone (%)
Races - Asian alone (% change since 2000)
Races - Hispanic (%)
Races - Hispanic (% change since 2000)
Races - Native Hawaiian and Other Pacific Islander alone (%)
Races - Native Hawaiian and Other Pacific Islander alone (% change since 2000)
Races - Two or more races(%)
Races - Two or more races(% change since 2000)
Races - Other race alone (%)
Races - Other race alone (% change since 2000)
Racial diversity
Place of birth - Born in state of residence (%)
Place of birth - Born in state of residence (%) - White
Place of birth - Born in state of residence (%) - Black or African American
Place of birth - Born in state of residence (%) - Asian
Place of birth - Born in state of residence (%) - Hispanic or Latino
Place of birth - Born in state of residence (%) - American Indian and Alaska Native
Place of birth - Born in state of residence (%) - Multirace
Place of birth - Born in state of residence (%) - Other Race
Place of birth - Born in other state (%)
Place of birth - Born in other state (%) - White
Place of birth - Born in other state (%) - Black or African American
Place of birth - Born in other state (%) - Asian
Place of birth - Born in other state (%) - Hispanic or Latino
Place of birth - Born in other state (%) - American Indian and Alaska Native
Place of birth - Born in other state (%) - Multirace
Place of birth - Born in other state (%) - Other Race
Place of birth - Native, outside of US (%)
Place of birth - Native, outside of US (%) - White
Place of birth - Native, outside of US (%) - Black or African American
Place of birth - Native, outside of US (%) - Asian
Place of birth - Native, outside of US (%) - Hispanic or Latino
Place of birth - Native, outside of US (%) - American Indian and Alaska Native
Place of birth - Native, outside of US (%) - Multirace
Place of birth - Native, outside of US (%) - Other Race
Place of birth - Foreign born (%)
Place of birth - Foreign born (%) - White
Place of birth - Foreign born (%) - Black or African American
Place of birth - Foreign born (%) - Asian
Place of birth - Foreign born (%) - Hispanic or Latino
Place of birth - Foreign born (%) - American Indian and Alaska Native
Place of birth - Foreign born (%) - Multirace
Place of birth - Foreign born (%) - Other Race
Residents speaking English at home (%)
Residents speaking English at home - Born in the United States (%)
Residents speaking English at home - Native, born elsewhere (%)
Residents speaking English at home - Foreign born (%)
Residents speaking Spanish at home (%)
Residents speaking Spanish at home - Born in the United States (%)
Residents speaking Spanish at home - Native, born elsewhere (%)
Residents speaking Spanish at home - Foreign born (%)
Residents speaking other language at home (%)
Residents speaking other language at home - Born in the United States (%)
Residents speaking other language at home - Native, born elsewhere (%)
Residents speaking other language at home - Foreign born (%)
Marital status - Never married (%)
Marital status - Now married (%)
Marital status - Separated (%)
Marital status - Widowed (%)
Marital status - Divorced (%)
Ancestries Reported - Arab (%)
Ancestries Reported - Czech (%)
Ancestries Reported - Danish (%)
Ancestries Reported - Dutch (%)
Ancestries Reported - English (%)
Ancestries Reported - French (%)
Ancestries Reported - French Canadian (%)
Ancestries Reported - German (%)
Ancestries Reported - Greek (%)
Ancestries Reported - Hungarian (%)
Ancestries Reported - Irish (%)
Ancestries Reported - Italian (%)
Ancestries Reported - Lithuanian (%)
Ancestries Reported - Norwegian (%)
Ancestries Reported - Polish (%)
Ancestries Reported - Portuguese (%)
Ancestries Reported - Russian (%)
Ancestries Reported - Scotch-Irish (%)
Ancestries Reported - Scottish (%)
Ancestries Reported - Slovak (%)
Ancestries Reported - Subsaharan African (%)
Ancestries Reported - Swedish (%)
Ancestries Reported - Swiss (%)
Ancestries Reported - Ukrainian (%)
Ancestries Reported - United States (%)
Ancestries Reported - Welsh (%)
Ancestries Reported - West Indian (%)
Ancestries Reported - Other (%)
Geographical mobility - Same house 1 year ago (%)
Geographical mobility - Same house 1 year ago (%) - White
Geographical mobility - Same house 1 year ago (%) - Black or African American
Geographical mobility - Same house 1 year ago (%) - Asian
Geographical mobility - Same house 1 year ago (%) - Hispanic or Latino
Geographical mobility - Same house 1 year ago (%) - American Indian and Alaska Native
Geographical mobility - Same house 1 year ago (%) - Multirace
Geographical mobility - Same house 1 year ago (%) - Other Race
Geographical mobility - Moved within same county (%)
Geographical mobility - Moved within same county (%) - White
Geographical mobility - Moved within same county (%) - Black or African American
Geographical mobility - Moved within same county (%) - Asian
Geographical mobility - Moved within same county (%) - Hispanic or Latino
Geographical mobility - Moved within same county (%) - American Indian and Alaska Native
Geographical mobility - Moved within same county (%) - Multirace
Geographical mobility - Moved within same county (%) - Other Race
Geographical mobility - Moved from different county within same state (%)
Geographical mobility - Moved from different county within same state (%) - White
Geographical mobility - Moved from different county within same state (%) - Black or African American
Geographical mobility - Moved from different county within same state (%) - Asian
Geographical mobility - Moved from different county within same state (%) - Hispanic or Latino
Geographical mobility - Moved from different county within same state (%) - American Indian and Alaska Native
Geographical mobility - Moved from different county within same state (%) - Multirace
Geographical mobility - Moved from different county within same state (%) - Other Race
Geographical mobility - Moved from different state (%)
Geographical mobility - Moved from different state (%) - White
Geographical mobility - Moved from different state (%) - Black or African American
Geographical mobility - Moved from different state (%) - Asian
Geographical mobility - Moved from different state (%) - Hispanic or Latino
Geographical mobility - Moved from different state (%) - American Indian and Alaska Native
Geographical mobility - Moved from different state (%) - Multirace
Geographical mobility - Moved from different state (%) - Other Race
Geographical mobility - Moved from abroad (%)
Geographical mobility - Moved from abroad (%) - White
Geographical mobility - Moved from abroad (%) - Black or African American
Geographical mobility - Moved from abroad (%) - Asian
Geographical mobility - Moved from abroad (%) - Hispanic or Latino
Geographical mobility - Moved from abroad (%) - American Indian and Alaska Native
Geographical mobility - Moved from abroad (%) - Multirace
Geographical mobility - Moved from abroad (%) - Other Race
Place of birth for the foreign-born population - Ireland (%)
Place of birth for the foreign-born population - Denmark (%)
Place of birth for the foreign-born population - Norway (%)
Place of birth for the foreign-born population - Sweden (%)
Place of birth for the foreign-born population - United Kingdom (%)
Place of birth for the foreign-born population - England (%)
Place of birth for the foreign-born population - Scotland (%)
Place of birth for the foreign-born population - Other Northern Europe (%)
Place of birth for the foreign-born population - Austria (%)
Place of birth for the foreign-born population - Belgium (%)
Place of birth for the foreign-born population - France (%)
Place of birth for the foreign-born population - Germany (%)
Place of birth for the foreign-born population - Netherlands (%)
Place of birth for the foreign-born population - Switzerland (%)
Place of birth for the foreign-born population - Other Western Europe (%)
Place of birth for the foreign-born population - Greece (%)
Place of birth for the foreign-born population - Italy (%)
Place of birth for the foreign-born population - Portugal (%)
Place of birth for the foreign-born population - Spain (%)
Place of birth for the foreign-born population - Other Southern Europe (%)
Place of birth for the foreign-born population - Albania (%)
Place of birth for the foreign-born population - Belarus (%)
Place of birth for the foreign-born population - Bosnia and Herzegovina (%)
Place of birth for the foreign-born population - Bulgaria (%)
Place of birth for the foreign-born population - Croatia (%)
Place of birth for the foreign-born population - Czechoslovakia (%)
Place of birth for the foreign-born population - Hungary (%)
Place of birth for the foreign-born population - Latvia (%)
Place of birth for the foreign-born population - Lithuania (%)
Place of birth for the foreign-born population - North Macedonia (Macedonia) (%)
Place of birth for the foreign-born population - Moldova (%)
Place of birth for the foreign-born population - Poland (%)
Place of birth for the foreign-born population - Romania (%)
Place of birth for the foreign-born population - Russia (%)
Place of birth for the foreign-born population - Serbia (%)
Place of birth for the foreign-born population - Ukraine (%)
Place of birth for the foreign-born population - Other Eastern Europe (%)
Place of birth for the foreign-born population - China (%)
Place of birth for the foreign-born population - Hong Kong (%)
Place of birth for the foreign-born population - Taiwan (%)
Place of birth for the foreign-born population - Japan (%)
Place of birth for the foreign-born population - Korea (%)
Place of birth for the foreign-born population - Other Eastern Asia (%)
Place of birth for the foreign-born population - Afghanistan (%)
Place of birth for the foreign-born population - Bangladesh (%)
Place of birth for the foreign-born population - India (%)
Place of birth for the foreign-born population - Iran (%)
Place of birth for the foreign-born population - Kazakhstan (%)
Place of birth for the foreign-born population - Nepal (%)
Place of birth for the foreign-born population - Pakistan (%)
Place of birth for the foreign-born population - Sri Lanka (%)
Place of birth for the foreign-born population - Uzbekistan (%)
Place of birth for the foreign-born population - Other South Central Asia (%)
Place of birth for the foreign-born population - Burma (%)
Place of birth for the foreign-born population - Cambodia (%)
Place of birth for the foreign-born population - Indonesia (%)
Place of birth for the foreign-born population - Laos (%)
Place of birth for the foreign-born population - Malaysia (%)
Place of birth for the foreign-born population - Philippines (%)
Place of birth for the foreign-born population - Singapore (%)
Place of birth for the foreign-born population - Thailand (%)
Place of birth for the foreign-born population - Vietnam (%)
Place of birth for the foreign-born population - Other South Eastern Asia (%)
Place of birth for the foreign-born population - Armenia (%)
Place of birth for the foreign-born population - Iraq (%)
Place of birth for the foreign-born population - Israel (%)
Place of birth for the foreign-born population - Jordan (%)
Place of birth for the foreign-born population - Kuwait (%)
Place of birth for the foreign-born population - Lebanon (%)
Place of birth for the foreign-born population - Saudi Arabia (%)
Place of birth for the foreign-born population - Syria (%)
Place of birth for the foreign-born population - Turkey (%)
Place of birth for the foreign-born population - Yemen (%)
Place of birth for the foreign-born population - Other Western Asia (%)
Place of birth for the foreign-born population - Eritrea (%)
Place of birth for the foreign-born population - Ethiopia (%)
Place of birth for the foreign-born population - Kenya (%)
Place of birth for the foreign-born population - Somalia (%)
Place of birth for the foreign-born population - Uganda (%)
Place of birth for the foreign-born population - Zimbabwe (%)
Place of birth for the foreign-born population - Other Eastern Africa (%)
Place of birth for the foreign-born population - Cameroon (%)
Place of birth for the foreign-born population - Congo (%)
Place of birth for the foreign-born population - Democratic Republic of Congo (Zaire) (%)
Place of birth for the foreign-born population - Other Middle Africa (%)
Place of birth for the foreign-born population - Egypt (%)
Place of birth for the foreign-born population - Morocco (%)
Place of birth for the foreign-born population - Sudan (%)
Place of birth for the foreign-born population - Other Northern Africa (%)
Place of birth for the foreign-born population - South Africa (%)
Place of birth for the foreign-born population - Other Southern Africa (%)
Place of birth for the foreign-born population - Cabo Verde (%)
Place of birth for the foreign-born population - Ghana (%)
Place of birth for the foreign-born population - Liberia (%)
Place of birth for the foreign-born population - Nigeria (%)
Place of birth for the foreign-born population - Senegal (%)
Place of birth for the foreign-born population - Sierra Leone (%)
Place of birth for the foreign-born population - Other Western Africa (%)
Place of birth for the foreign-born population - Australia (%)
Place of birth for the foreign-born population - New Zealand (%)
Place of birth for the foreign-born population - Fiji (%)
Place of birth for the foreign-born population - Micronesia (%)
Place of birth for the foreign-born population - Bahamas (%)
Place of birth for the foreign-born population - Barbados (%)
Place of birth for the foreign-born population - Cuba (%)
Place of birth for the foreign-born population - Dominica (%)
Place of birth for the foreign-born population - Dominican Republic (%)
Place of birth for the foreign-born population - Grenada (%)
Place of birth for the foreign-born population - Haiti (%)
Place of birth for the foreign-born population - Jamaica (%)
Place of birth for the foreign-born population - St. Vincent and the Grenadines (%)
Place of birth for the foreign-born population - Trinidad and Tobago (%)
Place of birth for the foreign-born population - West Indies (%)
Place of birth for the foreign-born population - Other Caribbean (%)
Place of birth for the foreign-born population - Belize (%)
Place of birth for the foreign-born population - Costa Rica (%)
Place of birth for the foreign-born population - El Salvador (%)
Place of birth for the foreign-born population - Guatemala (%)
Place of birth for the foreign-born population - Honduras (%)
Place of birth for the foreign-born population - Mexico (%)
Place of birth for the foreign-born population - Nicaragua (%)
Place of birth for the foreign-born population - Panama (%)
Place of birth for the foreign-born population - Other Central America (%)
Place of birth for the foreign-born population - Argentina (%)
Place of birth for the foreign-born population - Bolivia (%)
Place of birth for the foreign-born population - Brazil (%)
Place of birth for the foreign-born population - Chile (%)
Place of birth for the foreign-born population - Colombia (%)
Place of birth for the foreign-born population - Ecuador (%)
Place of birth for the foreign-born population - Guyana (%)
Place of birth for the foreign-born population - Peru (%)
Place of birth for the foreign-born population - Uruguay (%)
Place of birth for the foreign-born population - Venezuela (%)
Place of birth for the foreign-born population - Other South America (%)
Place of birth for the foreign-born population - Canada (%)
Place of birth for the foreign-born population - Other Northern America (%)
Place of birth for the foreign-born population - Other (%)
Latest news about races in Orange, CT collected exclusively by city-data.com from local newspapers, TV, and radio stations
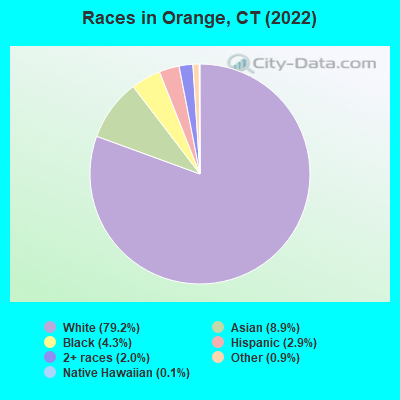
According to 2022 data, the most numerous races in Orange, CT are White alone (11,320 residents), Hispanic (408 residents), and Black alone (611 residents). 82.5% of Orange residents speak English at home. 14.2% of Orange, CT residents are foreign-born (5.5% born in Asia, 4.1% born in Europe, 2.1% born in Latin America, 1.7% born in Africa), which is 5.4% less than the foreign-born rate of 15.0% across the entire state of Connecticut.
Race distribution in Orange
2000 2022
2,638,845 77.5% White alone 320,323 9.4% Hispanic 295,571 8.7% Black alone 81,564 2.4% Asian alone 52,896 1.6% Two or more races 8,141 0.2% Other race alone 7,267 0.2% American Indian alone 958 0.03% Native Hawaiian and Other
2,246,913 62.0% White alone 658,978 18.2% Hispanic 353,973 9.8% Black alone 172,929 4.8% Asian alone 159,631 4.4% Two or more races 29,761 0.8% Other race alone 3,428 0.09% American Indian alone 592 0.02% Native Hawaiian and Other
Income and house value in Orange Median household income in 2022 $141,017 White non-Hispanic householders$183,744 Black householders$82,831 Asian householders$119,230 Some other race householders$132,356 Two or more races householders$173,542 Hispanic or Latino race householdersMedian 2022 house value $483,034 White Non-Hispanic householders$349,686 Black or African American householders $465,116 Asian householders$452,668 Two or more races householders$399,479 Hispanic or Latino householders
Median age by race in Orange
48.6 Median age for White residents47.0 49.9 26.9 Median age for Black or African American residents35.2 24.4 -742,173,111.6 Median age for American Indian / Alaska Native residents-701,030,927.1 -704,477,611.2 45.7 Median age for Asian residents44.7 46.2 -641,269,840.6 Median age for Native Hawaiian / Pacific Islander residents-414,239,481.8 -691,588,784.4 20.0 Median age for Other race residents19.9 17.7 43.2 Median age for Two or more races residents42.0 50.3 48.5 Median age for White alone residents46.8 49.7 40.6 Median age for Hispanic or Latino residents40.1 41.6
Owner/renter occupied households by race in Orange
House owners and renters - White residents 3,769 88.5% Owner occupied488 11.5% Renter occupiedHouse owners and renters - Black or African American residents 134 79.6% Owner occupied34 20.4% Renter occupiedHouse owners and renters - Asian residents 457 98.3% Owner occupied8 1.7% Renter occupiedHouse owners and renters - Native Hawaiian / Pacific Islander residents 13 100.0% Owner occupiedHouse owners and renters - Other race residents 41 100.0% Owner occupiedHouse owners and renters - Two or more races residents 215 93.6% Owner occupied15 6.4% Renter occupiedHouse owners and renters - White alone residents 3,761 88.2% Owner occupied504 11.8% Renter occupiedHouse owners and renters - Hispanic or Latino residents 175 87.9% Owner occupied24 12.1% Renter occupied
Language usage in Orange
English speakers - Total 82.5% of residents of Orange speak English at home.
2.6% of residents speak Spanish at home 262 74.9% Speak English very well88 25.1% Speak English less than very well14.5% of residents speak other language at home 1,353 69.1% Speak English very well605 30.9% Speak English less than very well
English speakers - Born in the United States 93.0% of residents of Orange speak English at home.
1.8% of residents speak Spanish at home 23 45.1% Speak English very well28 54.9% Speak English less than very well4.4% of residents speak other language at home 114 91.2% Speak English very well11 8.8% Speak English less than very well
English speakers - Native, born elsewhere 77.9% of residents of Orange speak English at home.
10.7% of residents speak Spanish at home 13 100.0% Speak English very well22.1% of residents speak other language at home 27 100.0% Speak English very well
English speakers - Foreign-born 28.1% of residents of Orange speak English at home.
8.1% of residents speak Spanish at home 159 97.0% Speak English very well5 3.0% Speak English less than very well62.7% of residents speak other language at home 721 56.8% Speak English very well549 43.2% Speak English less than very well
White (Caucasian) - Speak only English Native:
96.3% (9,345)Foreign-born:
35.5% (258)
White (Caucasian) - Speak another language Native:
4.2% (404)Foreign-born:
65.3% (474)
Black or African American - Speak only English Native:
93.1% (429)Foreign-born:
61.3% (66)
Black or African American - Speak another language Native:
6.7% (31)Foreign-born:
37.6% (41)
Asian - Speak only English Native:
58.1% (277)Foreign-born:
18.7% (144)
Asian - Speak another language Native:
42.1% (201)Foreign-born:
81.2% (629)
Other race - Speak only English Native:
78.8% (117)Foreign-born:
85.0% (11)
Two or more races - Speak only English Native:
80.3% (197)Foreign-born:
17.4% (49)
Two or more races - Speak another language Native:
16.5% (41)Foreign-born:
77.5% (218)
White alone - Speak only English Native:
95.1% (9,319)Foreign-born:
32.5% (267)
White alone - Speak another language Native:
4.9% (483)Foreign-born:
67.5% (554)
Hispanic or Latino - Speak only English Native:
53.0% (127)Foreign-born:
10.0% (17)
Hispanic or Latino - Speak another language Native:
47.8% (115)Foreign-born:
89.2% (152)
Foreign-born residents in Orange 2,034 residents are foreign born (5.5% Asia , 4.1% Europe , 2.1% Latin America , 1.7% Africa ).
This city:
14.2%Connecticut:
15.0%
Marital status for residents in Orange Marital status - White (Caucasian) population 15 years and over
Males 21.2% Never married69.0% Now married0.3% Separated4.1% Widowed5.4% DivorcedFemales 20.1% Never married61.3% Now married0.4% Separated11.1% Widowed7.1% DivorcedWomen who gave birth in the past 12 months Now married:
100.0% (146)Unmarried:
0.0% (0)
Women who did not give birth in the past 12 months Now married:
51.0% (903)Unmarried:
49.0% (867)
Marital status - Black or African American population 15 years and over
Males 42.1% Never married47.8% Now married0.0% Separated10.1% Widowed0.0% DivorcedFemales 56.7% Never married33.5% Now married0.0% Separated2.5% Widowed7.4% DivorcedWomen who did not give birth in the past 12 months Now married:
38.0% (93)Unmarried:
62.0% (152)
Marital status - Asian population 15 years and over
Males 10.3% Never married88.7% Now married0.0% Separated0.0% Widowed1.0% DivorcedFemales 38.3% Never married47.1% Now married0.0% Separated11.3% Widowed3.3% DivorcedWomen who did not give birth in the past 12 months Now married:
37.5% (149)Unmarried:
62.5% (248)
Marital status - Native Hawaiian / Pacific Islander population 15 years and over
Males 0.0% Never married100.0% Now married0.0% Separated0.0% Widowed0.0% DivorcedFemales 0.0% Never married100.0% Now married0.0% Separated0.0% Widowed0.0% DivorcedWomen who did not give birth in the past 12 months Now married:
100.0% (15)Unmarried:
0.0% (0)
Marital status - Other race population 15 years and over
Males 64.2% Never married1.2% Now married0.0% Separated8.6% Widowed25.9% DivorcedFemales 97.4% Never married2.6% Now married0.0% Separated0.0% Widowed0.0% DivorcedWomen who did not give birth in the past 12 months Now married:
0.0% (0)Unmarried:
100.0% (44)
Marital status - Two or more races population 15 years and over
Males 35.0% Never married65.0% Now married0.0% Separated0.0% Widowed0.0% DivorcedFemales 12.9% Never married56.1% Now married0.0% Separated31.0% Widowed0.0% DivorcedWomen who did not give birth in the past 12 months Now married:
71.8% (78)Unmarried:
28.2% (31)
Marital status - White alone, not Hispanic / Latino population 15 years and over
Males 21.1% Never married69.0% Now married0.3% Separated4.1% Widowed5.5% DivorcedFemales 20.0% Never married61.1% Now married0.4% Separated11.3% Widowed7.2% DivorcedWomen who gave birth in the past 12 months Now married:
100.0% (154)Unmarried:
0.0% (0)
Women who did not give birth in the past 12 months Now married:
50.2% (907)Unmarried:
49.8% (899)
Marital status - Hispanic or Latino population 15 years and over
Males 28.0% Never married58.0% Now married0.0% Separated0.0% Widowed14.0% DivorcedFemales 16.9% Never married83.1% Now married0.0% Separated0.0% Widowed0.0% DivorcedWomen who did not give birth in the past 12 months Now married:
84.4% (85)Unmarried:
15.6% (16)
Ancestries in Orange
1,381 22.9% Italian858 14.2% Irish301 5.0% American169 2.8% Polish164 2.7% German142 2.4% Portuguese129 2.1% English110 1.8% Scottish103 1.7% Nigerian81 1.3% Lebanese78 1.3% Russian76 1.3% Czechoslovakian62 1.0% Ukrainian56 0.9% Ethiopian56 0.9% Swedish50 0.8% Greek49 0.8% Serbian48 0.8% European46 0.8% Hungarian41 0.7% Turkish38 0.6% French33 0.5% French Canadian31 0.5% Welsh26 0.4% Czech20 0.3% Liberian18 0.3% Armenian14 0.2% Cape Verdean12 0.2% Jamaican12 0.2% British11 0.2% Romanian9 0.1% Dutch9 0.1% Danish8 0.1% Northern European7 0.1% Syrian7 0.1% Lithuanian6 0.10% Assyrian4 0.07% New Zealander4 0.07% Slovak
Children Nativity (place of birth) in Orange
Children under 6 years - Living with two parents Both parents native 531 100.0% NativeBoth parents foreign-born 75 100.0% NativeOne native, one foreign-born parent 98 100.0% NativeChildren under 6 years - Living with one parent Native parent 98 100.0% NativeForeign-born parent 5 32.9% Native10 67.1% Foreign-bornChildren 6 to 17 years - Living with two parents Both parents native 1,364 100.0% NativeBoth parents foreign-born 395 93.5% Native28 6.5% Foreign-bornOne native, one foreign-born parent 159 100.0% NativeChildren 6 to 17 years - Living with one parent Native parent 149 100.0% NativeForeign-born parent 240 52.1% Native220 47.9% Foreign-born
Grandparents responsible for own grandchildren in Orange
Grandparents (30 to 59 years) Black or African American 11 100.0% Not responsible for grandchildren
Grandparents (60 years and over) Black or African American 9 100.0% Not responsible for grandchildren