Races in Olive Branch, Mississippi (MS) Detailed Stats
Data:
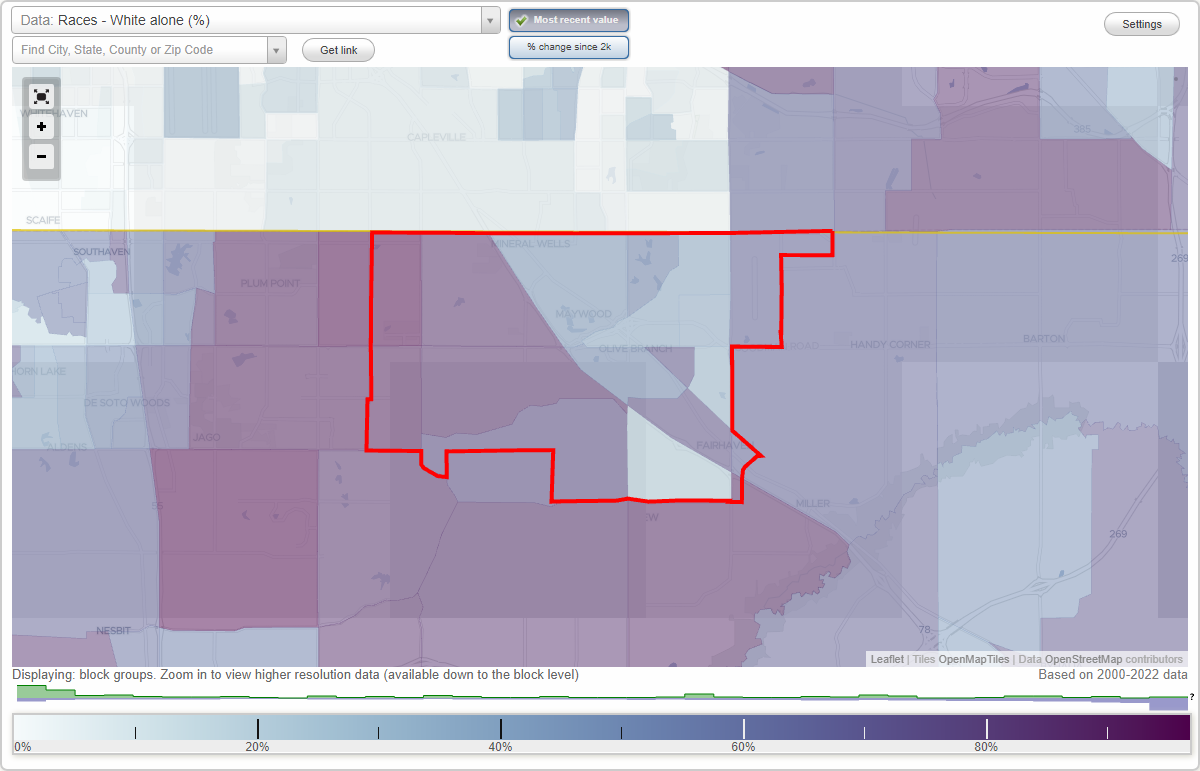
Races - White alone (%)
Races - White alone (% change since 2000)
Races - Black alone (%)
Races - Black alone (% change since 2000)
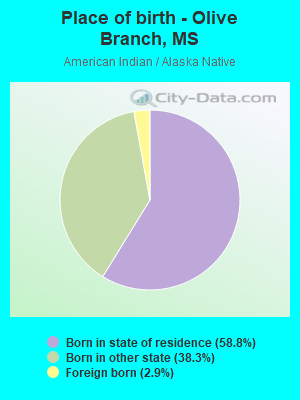
Races - American Indian alone (%)
Races - American Indian alone (% change since 2000)
Races - Asian alone (%)
Races - Asian alone (% change since 2000)
Races - Hispanic (%)
Races - Hispanic (% change since 2000)
Races - Native Hawaiian and Other Pacific Islander alone (%)
Races - Native Hawaiian and Other Pacific Islander alone (% change since 2000)
Races - Two or more races(%)
Races - Two or more races(% change since 2000)
Races - Other race alone (%)
Races - Other race alone (% change since 2000)
Racial diversity
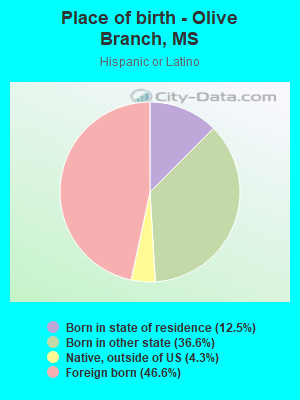
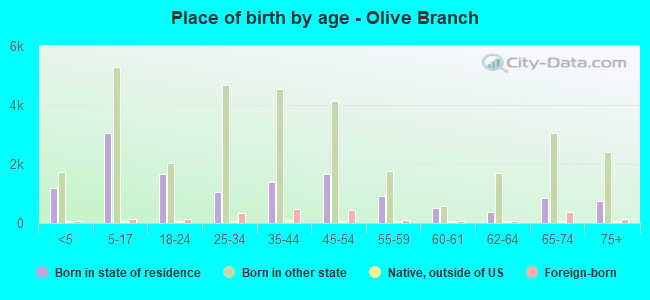
Place of birth - Born in state of residence (%)
Place of birth - Born in state of residence (%) - White
Place of birth - Born in state of residence (%) - Black or African American
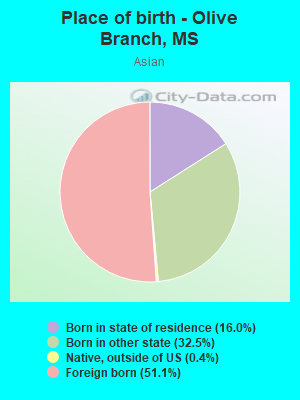
Place of birth - Born in state of residence (%) - Asian
Place of birth - Born in state of residence (%) - Hispanic or Latino
Place of birth - Born in state of residence (%) - American Indian and Alaska Native
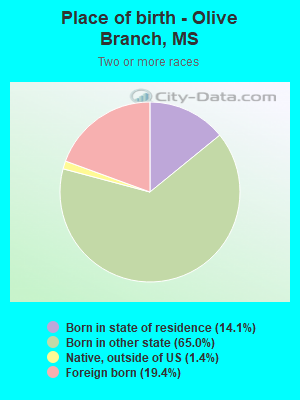
Place of birth - Born in state of residence (%) - Multirace
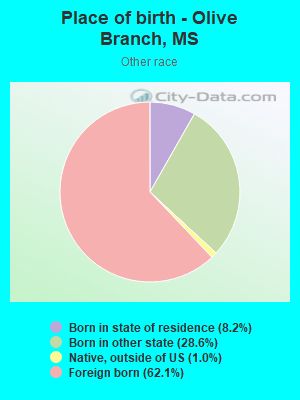
Place of birth - Born in state of residence (%) - Other Race
Place of birth - Born in other state (%)
Place of birth - Born in other state (%) - White
Place of birth - Born in other state (%) - Black or African American
Place of birth - Born in other state (%) - Asian
Place of birth - Born in other state (%) - Hispanic or Latino
Place of birth - Born in other state (%) - American Indian and Alaska Native
Place of birth - Born in other state (%) - Multirace
Place of birth - Born in other state (%) - Other Race
Place of birth - Native, outside of US (%)
Place of birth - Native, outside of US (%) - White
Place of birth - Native, outside of US (%) - Black or African American
Place of birth - Native, outside of US (%) - Asian
Place of birth - Native, outside of US (%) - Hispanic or Latino
Place of birth - Native, outside of US (%) - American Indian and Alaska Native
Place of birth - Native, outside of US (%) - Multirace
Place of birth - Native, outside of US (%) - Other Race
Place of birth - Foreign born (%)
Place of birth - Foreign born (%) - White
Place of birth - Foreign born (%) - Black or African American
Place of birth - Foreign born (%) - Asian
Place of birth - Foreign born (%) - Hispanic or Latino
Place of birth - Foreign born (%) - American Indian and Alaska Native
Place of birth - Foreign born (%) - Multirace
Place of birth - Foreign born (%) - Other Race
Residents speaking English at home (%)
Residents speaking English at home - Born in the United States (%)
Residents speaking English at home - Native, born elsewhere (%)
Residents speaking English at home - Foreign born (%)
Residents speaking Spanish at home (%)
Residents speaking Spanish at home - Born in the United States (%)
Residents speaking Spanish at home - Native, born elsewhere (%)
Residents speaking Spanish at home - Foreign born (%)
Residents speaking other language at home (%)
Residents speaking other language at home - Born in the United States (%)
Residents speaking other language at home - Native, born elsewhere (%)
Residents speaking other language at home - Foreign born (%)
Marital status - Never married (%)
Marital status - Now married (%)
Marital status - Separated (%)
Marital status - Widowed (%)
Marital status - Divorced (%)
Ancestries Reported - Arab (%)
Ancestries Reported - Czech (%)
Ancestries Reported - Danish (%)
Ancestries Reported - Dutch (%)
Ancestries Reported - English (%)
Ancestries Reported - French (%)
Ancestries Reported - French Canadian (%)
Ancestries Reported - German (%)
Ancestries Reported - Greek (%)
Ancestries Reported - Hungarian (%)
Ancestries Reported - Irish (%)
Ancestries Reported - Italian (%)
Ancestries Reported - Lithuanian (%)
Ancestries Reported - Norwegian (%)
Ancestries Reported - Polish (%)
Ancestries Reported - Portuguese (%)
Ancestries Reported - Russian (%)
Ancestries Reported - Scotch-Irish (%)
Ancestries Reported - Scottish (%)
Ancestries Reported - Slovak (%)
Ancestries Reported - Subsaharan African (%)
Ancestries Reported - Swedish (%)
Ancestries Reported - Swiss (%)
Ancestries Reported - Ukrainian (%)
Ancestries Reported - United States (%)
Ancestries Reported - Welsh (%)
Ancestries Reported - West Indian (%)
Ancestries Reported - Other (%)
Geographical mobility - Same house 1 year ago (%)
Geographical mobility - Same house 1 year ago (%) - White
Geographical mobility - Same house 1 year ago (%) - Black or African American
Geographical mobility - Same house 1 year ago (%) - Asian
Geographical mobility - Same house 1 year ago (%) - Hispanic or Latino
Geographical mobility - Same house 1 year ago (%) - American Indian and Alaska Native
Geographical mobility - Same house 1 year ago (%) - Multirace
Geographical mobility - Same house 1 year ago (%) - Other Race
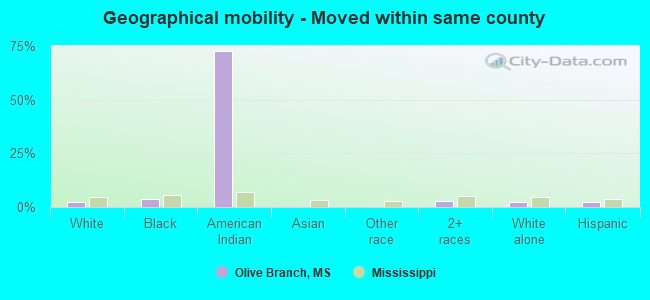
Geographical mobility - Moved within same county (%)
Geographical mobility - Moved within same county (%) - White
Geographical mobility - Moved within same county (%) - Black or African American
Geographical mobility - Moved within same county (%) - Asian
Geographical mobility - Moved within same county (%) - Hispanic or Latino
Geographical mobility - Moved within same county (%) - American Indian and Alaska Native
Geographical mobility - Moved within same county (%) - Multirace
Geographical mobility - Moved within same county (%) - Other Race
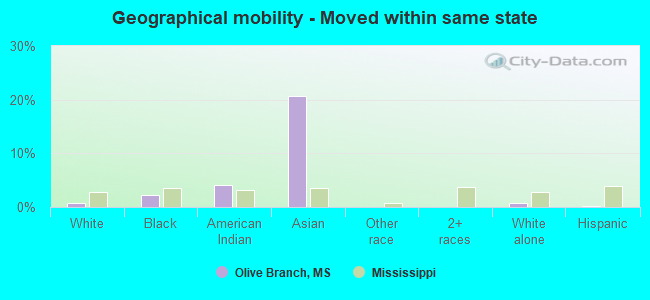
Geographical mobility - Moved from different county within same state (%)
Geographical mobility - Moved from different county within same state (%) - White
Geographical mobility - Moved from different county within same state (%) - Black or African American
Geographical mobility - Moved from different county within same state (%) - Asian
Geographical mobility - Moved from different county within same state (%) - Hispanic or Latino
Geographical mobility - Moved from different county within same state (%) - American Indian and Alaska Native
Geographical mobility - Moved from different county within same state (%) - Multirace
Geographical mobility - Moved from different county within same state (%) - Other Race
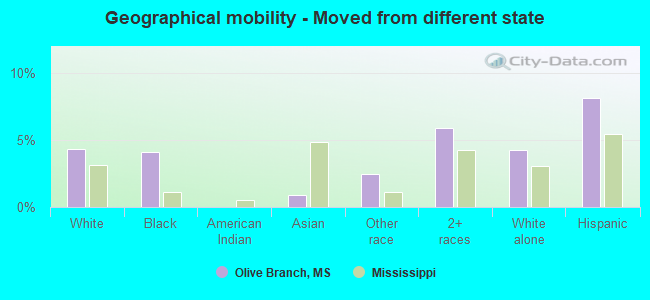
Geographical mobility - Moved from different state (%)
Geographical mobility - Moved from different state (%) - White
Geographical mobility - Moved from different state (%) - Black or African American
Geographical mobility - Moved from different state (%) - Asian
Geographical mobility - Moved from different state (%) - Hispanic or Latino
Geographical mobility - Moved from different state (%) - American Indian and Alaska Native
Geographical mobility - Moved from different state (%) - Multirace
Geographical mobility - Moved from different state (%) - Other Race
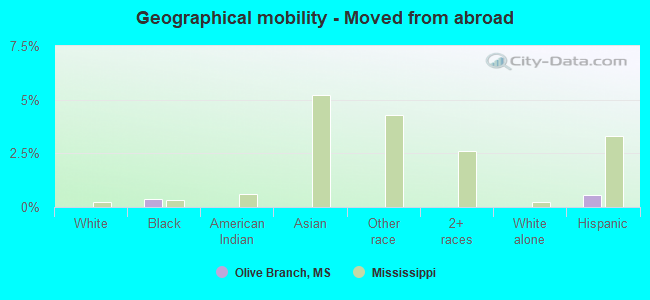
Geographical mobility - Moved from abroad (%)
Geographical mobility - Moved from abroad (%) - White
Geographical mobility - Moved from abroad (%) - Black or African American
Geographical mobility - Moved from abroad (%) - Asian
Geographical mobility - Moved from abroad (%) - Hispanic or Latino
Geographical mobility - Moved from abroad (%) - American Indian and Alaska Native
Geographical mobility - Moved from abroad (%) - Multirace
Geographical mobility - Moved from abroad (%) - Other Race
Place of birth for the foreign-born population - Ireland (%)
Place of birth for the foreign-born population - Denmark (%)
Place of birth for the foreign-born population - Norway (%)
Place of birth for the foreign-born population - Sweden (%)
Place of birth for the foreign-born population - United Kingdom (%)
Place of birth for the foreign-born population - England (%)
Place of birth for the foreign-born population - Scotland (%)
Place of birth for the foreign-born population - Other Northern Europe (%)
Place of birth for the foreign-born population - Austria (%)
Place of birth for the foreign-born population - Belgium (%)
Place of birth for the foreign-born population - France (%)
Place of birth for the foreign-born population - Germany (%)
Place of birth for the foreign-born population - Netherlands (%)
Place of birth for the foreign-born population - Switzerland (%)
Place of birth for the foreign-born population - Other Western Europe (%)
Place of birth for the foreign-born population - Greece (%)
Place of birth for the foreign-born population - Italy (%)
Place of birth for the foreign-born population - Portugal (%)
Place of birth for the foreign-born population - Spain (%)
Place of birth for the foreign-born population - Other Southern Europe (%)
Place of birth for the foreign-born population - Albania (%)
Place of birth for the foreign-born population - Belarus (%)
Place of birth for the foreign-born population - Bosnia and Herzegovina (%)
Place of birth for the foreign-born population - Bulgaria (%)
Place of birth for the foreign-born population - Croatia (%)
Place of birth for the foreign-born population - Czechoslovakia (%)
Place of birth for the foreign-born population - Hungary (%)
Place of birth for the foreign-born population - Latvia (%)
Place of birth for the foreign-born population - Lithuania (%)
Place of birth for the foreign-born population - North Macedonia (Macedonia) (%)
Place of birth for the foreign-born population - Moldova (%)
Place of birth for the foreign-born population - Poland (%)
Place of birth for the foreign-born population - Romania (%)
Place of birth for the foreign-born population - Russia (%)
Place of birth for the foreign-born population - Serbia (%)
Place of birth for the foreign-born population - Ukraine (%)
Place of birth for the foreign-born population - Other Eastern Europe (%)
Place of birth for the foreign-born population - China (%)
Place of birth for the foreign-born population - Hong Kong (%)
Place of birth for the foreign-born population - Taiwan (%)
Place of birth for the foreign-born population - Japan (%)
Place of birth for the foreign-born population - Korea (%)
Place of birth for the foreign-born population - Other Eastern Asia (%)
Place of birth for the foreign-born population - Afghanistan (%)
Place of birth for the foreign-born population - Bangladesh (%)
Place of birth for the foreign-born population - India (%)
Place of birth for the foreign-born population - Iran (%)
Place of birth for the foreign-born population - Kazakhstan (%)
Place of birth for the foreign-born population - Nepal (%)
Place of birth for the foreign-born population - Pakistan (%)
Place of birth for the foreign-born population - Sri Lanka (%)
Place of birth for the foreign-born population - Uzbekistan (%)
Place of birth for the foreign-born population - Other South Central Asia (%)
Place of birth for the foreign-born population - Burma (%)
Place of birth for the foreign-born population - Cambodia (%)
Place of birth for the foreign-born population - Indonesia (%)
Place of birth for the foreign-born population - Laos (%)
Place of birth for the foreign-born population - Malaysia (%)
Place of birth for the foreign-born population - Philippines (%)
Place of birth for the foreign-born population - Singapore (%)
Place of birth for the foreign-born population - Thailand (%)
Place of birth for the foreign-born population - Vietnam (%)
Place of birth for the foreign-born population - Other South Eastern Asia (%)
Place of birth for the foreign-born population - Armenia (%)
Place of birth for the foreign-born population - Iraq (%)
Place of birth for the foreign-born population - Israel (%)
Place of birth for the foreign-born population - Jordan (%)
Place of birth for the foreign-born population - Kuwait (%)
Place of birth for the foreign-born population - Lebanon (%)
Place of birth for the foreign-born population - Saudi Arabia (%)
Place of birth for the foreign-born population - Syria (%)
Place of birth for the foreign-born population - Turkey (%)
Place of birth for the foreign-born population - Yemen (%)
Place of birth for the foreign-born population - Other Western Asia (%)
Place of birth for the foreign-born population - Eritrea (%)
Place of birth for the foreign-born population - Ethiopia (%)
Place of birth for the foreign-born population - Kenya (%)
Place of birth for the foreign-born population - Somalia (%)
Place of birth for the foreign-born population - Uganda (%)
Place of birth for the foreign-born population - Zimbabwe (%)
Place of birth for the foreign-born population - Other Eastern Africa (%)
Place of birth for the foreign-born population - Cameroon (%)
Place of birth for the foreign-born population - Congo (%)
Place of birth for the foreign-born population - Democratic Republic of Congo (Zaire) (%)
Place of birth for the foreign-born population - Other Middle Africa (%)
Place of birth for the foreign-born population - Egypt (%)
Place of birth for the foreign-born population - Morocco (%)
Place of birth for the foreign-born population - Sudan (%)
Place of birth for the foreign-born population - Other Northern Africa (%)
Place of birth for the foreign-born population - South Africa (%)
Place of birth for the foreign-born population - Other Southern Africa (%)
Place of birth for the foreign-born population - Cabo Verde (%)
Place of birth for the foreign-born population - Ghana (%)
Place of birth for the foreign-born population - Liberia (%)
Place of birth for the foreign-born population - Nigeria (%)
Place of birth for the foreign-born population - Senegal (%)
Place of birth for the foreign-born population - Sierra Leone (%)
Place of birth for the foreign-born population - Other Western Africa (%)
Place of birth for the foreign-born population - Australia (%)
Place of birth for the foreign-born population - New Zealand (%)
Place of birth for the foreign-born population - Fiji (%)
Place of birth for the foreign-born population - Micronesia (%)
Place of birth for the foreign-born population - Bahamas (%)
Place of birth for the foreign-born population - Barbados (%)
Place of birth for the foreign-born population - Cuba (%)
Place of birth for the foreign-born population - Dominica (%)
Place of birth for the foreign-born population - Dominican Republic (%)
Place of birth for the foreign-born population - Grenada (%)
Place of birth for the foreign-born population - Haiti (%)
Place of birth for the foreign-born population - Jamaica (%)
Place of birth for the foreign-born population - St. Vincent and the Grenadines (%)
Place of birth for the foreign-born population - Trinidad and Tobago (%)
Place of birth for the foreign-born population - West Indies (%)
Place of birth for the foreign-born population - Other Caribbean (%)
Place of birth for the foreign-born population - Belize (%)
Place of birth for the foreign-born population - Costa Rica (%)
Place of birth for the foreign-born population - El Salvador (%)
Place of birth for the foreign-born population - Guatemala (%)
Place of birth for the foreign-born population - Honduras (%)
Place of birth for the foreign-born population - Mexico (%)
Place of birth for the foreign-born population - Nicaragua (%)
Place of birth for the foreign-born population - Panama (%)
Place of birth for the foreign-born population - Other Central America (%)
Place of birth for the foreign-born population - Argentina (%)
Place of birth for the foreign-born population - Bolivia (%)
Place of birth for the foreign-born population - Brazil (%)
Place of birth for the foreign-born population - Chile (%)
Place of birth for the foreign-born population - Colombia (%)
Place of birth for the foreign-born population - Ecuador (%)
Place of birth for the foreign-born population - Guyana (%)
Place of birth for the foreign-born population - Peru (%)
Place of birth for the foreign-born population - Uruguay (%)
Place of birth for the foreign-born population - Venezuela (%)
Place of birth for the foreign-born population - Other South America (%)
Place of birth for the foreign-born population - Canada (%)
Place of birth for the foreign-born population - Other Northern America (%)
Place of birth for the foreign-born population - Other (%)
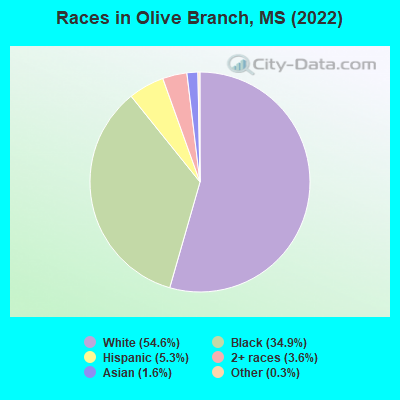
According to 2022 data, the most numerous races in Olive Branch, MS are White alone (25,805 residents), Black alone (16,512 residents), and Hispanic (2,485 residents). 93.6% of Olive Branch residents speak English at home. 4.5% of Olive Branch, MS residents are foreign-born (2.5% born in Latin America, 1.2% born in Asia), which is 55.5% greater than the foreign-born rate of 2.0% across the entire state of Mississippi.
Race distribution in Olive Branch
2000 2022
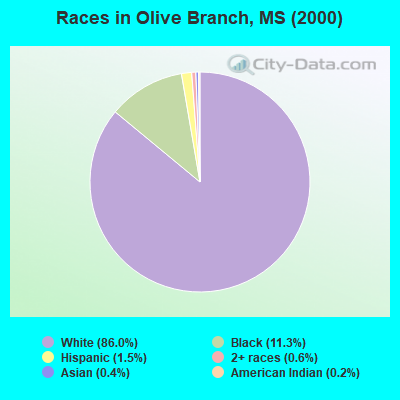
1,727,908 60.7% White alone 1,028,473 36.2% Black alone 39,569 1.4% Hispanic 17,272 0.6% Two or more races 18,349 0.6% Asian alone 11,224 0.4% American Indian alone 1,294 0.05% Other race alone 569 0.02% Native Hawaiian and Other
1,625,979 55.3% White alone 1,072,962 36.5% Black alone 97,177 3.3% Hispanic 96,367 3.3% Two or more races 25,217 0.9% Asian alone 12,457 0.4% American Indian alone 9,501 0.3% Other race alone 397 0.01% Native Hawaiian and Other
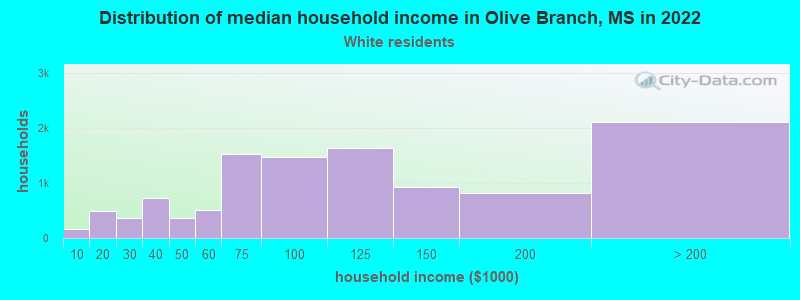
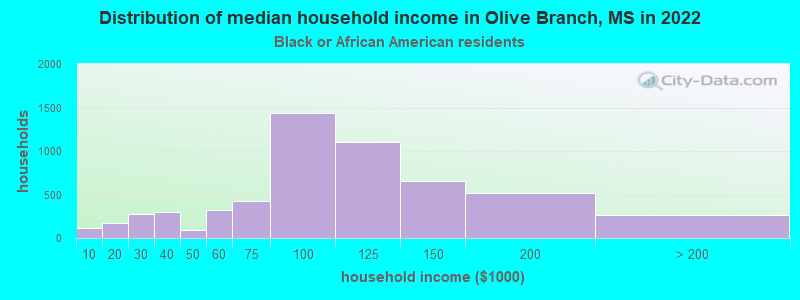
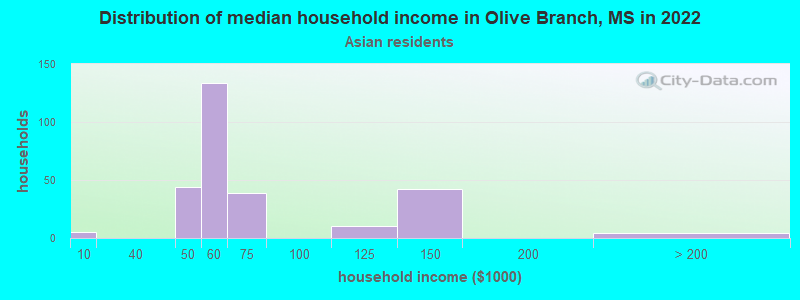
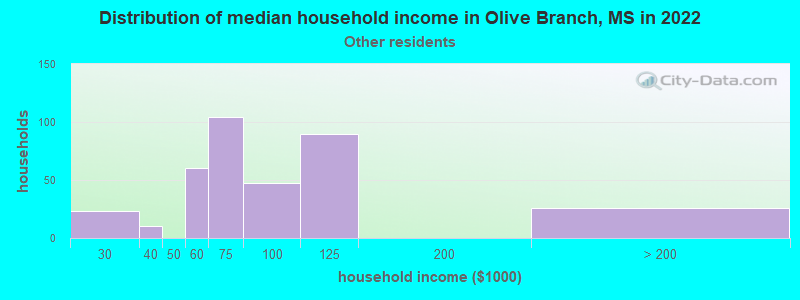
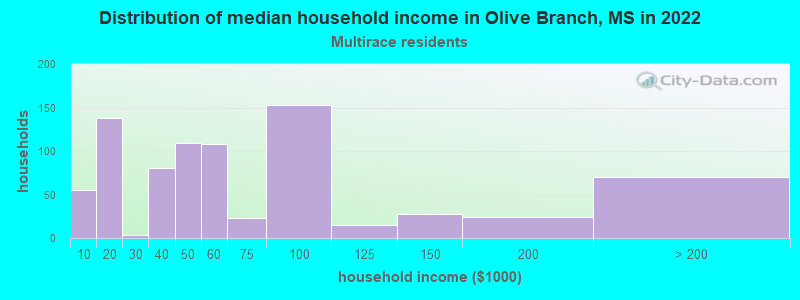
Income and house value in Olive Branch Median household income in 2022 $97,826 White non-Hispanic householders$106,681 Black householders$39,691 Asian householders$65,383 Some other race householders$49,686 Two or more races householders$64,422 Hispanic or Latino race householdersMedian 2022 house value $286,720 White Non-Hispanic householders$201,750 Black or African American householders$225,995 American Indian or Alaska Native householders$122,340 Some other race householders$308,074 Hispanic or Latino householders
Median age by race in Olive Branch
44.2 Median age for White residents43.8 44.3 34.3 Median age for Black or African American residents34.3 34.3 21.4 Median age for American Indian / Alaska Native residents23.5 -710,601,718.5 32.9 Median age for Asian residents35.9 36.4 -666,666,666.0 Median age for Native Hawaiian / Pacific Islander residents-666,666,666.0 -666,666,666.0 26.5 Median age for Other race residents28.7 32.4 24.7 Median age for Two or more races residents15.8 70.5 44.3 Median age for White alone residents44.1 44.1 34.3 Median age for Hispanic or Latino residents30.0 36.1
Owner/renter occupied households by race in Olive Branch
House owners and renters - White residents 9,249 87.9% Owner occupied1,268 12.1% Renter occupiedHouse owners and renters - Black or African American residents 4,473 79.1% Owner occupied1,183 20.9% Renter occupiedHouse owners and renters - American Indian / Alaska Native residents 12 100.0% Renter occupiedHouse owners and renters - Asian residents 533 95.7% Owner occupied24 4.3% Renter occupiedHouse owners and renters - Other race residents 271 77.7% Owner occupied78 22.3% Renter occupiedHouse owners and renters - Two or more races residents 499 68.9% Owner occupied225 31.1% Renter occupiedHouse owners and renters - White alone residents 9,105 87.5% Owner occupied1,300 12.5% Renter occupiedHouse owners and renters - Hispanic or Latino residents 574 78.0% Owner occupied162 22.0% Renter occupied
Language usage in Olive Branch
English speakers - Total 93.6% of residents of Olive Branch speak English at home.
4.9% of residents speak Spanish at home 1,648 76.3% Speak English very well511 23.7% Speak English less than very well1.8% of residents speak other language at home 622 78.5% Speak English very well170 21.5% Speak English less than very well
English speakers - Born in the United States 97.5% of residents of Olive Branch speak English at home.
1.7% of residents speak Spanish at home 478 91.4% Speak English very well45 8.6% Speak English less than very well1.0% of residents speak other language at home 301 97.4% Speak English very well8 2.6% Speak English less than very well
English speakers - Native, born elsewhere 55.8% of residents of Olive Branch speak English at home.
31.7% of residents speak Spanish at home 84 80.8% Speak English very well20 19.2% Speak English less than very well32.3% of residents speak other language at home 103 97.2% Speak English very well3 2.8% Speak English less than very well
English speakers - Foreign-born 21.7% of residents of Olive Branch speak English at home.
60.7% of residents speak Spanish at home 850 65.0% Speak English very well458 35.0% Speak English less than very well23.4% of residents speak other language at home 369 73.2% Speak English very well135 26.8% Speak English less than very well
White (Caucasian) - Speak only English Native:
99.4% (24,329)Foreign-born:
38.4% (89)
White (Caucasian) - Speak another language Native:
0.6% (141)Foreign-born:
99.6% (229)
Black or African American - Speak only English Native:
98.9% (13,208)Foreign-born:
29.9% (43)
Black or African American - Speak another language Native:
1.1% (143)Foreign-born:
71.5% (102)
Asian - Speak only English Native:
60.4% (210)Foreign-born:
39.1% (163)
Asian - Speak another language Native:
39.1% (136)Foreign-born:
49.7% (207)
Other race - Speak only English Native:
42.1% (194)Foreign-born:
2.5% (21)
Other race - Speak another language Native:
56.4% (259)Foreign-born:
100.0% (850)
Two or more races - Speak only English Native:
73.3% (1,421)Foreign-born:
36.3% (188)
Two or more races - Speak another language Native:
31.2% (605)Foreign-born:
61.4% (318)
White alone - Speak only English Native:
99.4% (24,132)Foreign-born:
51.9% (106)
White alone - Speak another language Native:
0.6% (139)Foreign-born:
47.9% (97)
Hispanic or Latino - Speak only English Native:
40.3% (470)Foreign-born:
1.0% (11)
Hispanic or Latino - Speak another language Native:
59.4% (694)Foreign-born:
100.0% (1,181)
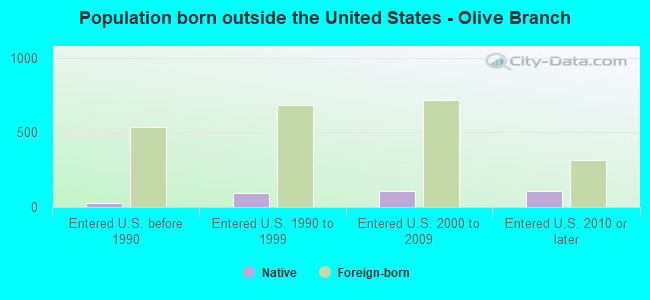
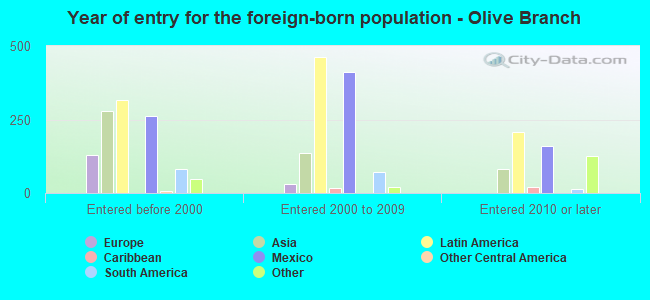
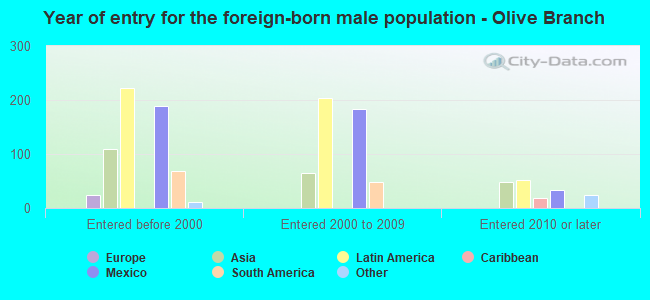
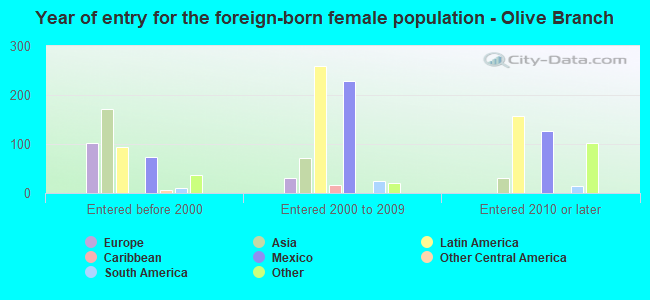
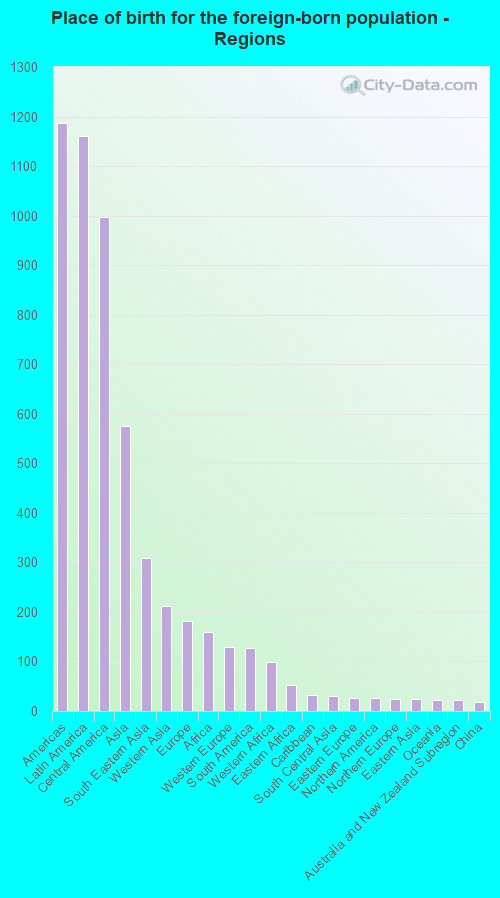
Foreign-born residents in Olive Branch 2,128 residents are foreign born (2.5% Latin America , 1.2% Asia ).
This city:
4.5%Mississippi:
2.3%
Marital status for residents in Olive Branch Marital status - White (Caucasian) population 15 years and over
Males 22.0% Never married61.9% Now married1.5% Separated4.1% Widowed10.4% DivorcedFemales 22.3% Never married53.1% Now married1.5% Separated10.5% Widowed12.6% DivorcedWomen who gave birth in the past 12 months Now married:
58.5% (181)Unmarried:
41.5% (129)
Women who did not give birth in the past 12 months Now married:
49.1% (2,605)Unmarried:
50.9% (2,698)
Marital status - Black or African American population 15 years and over
Males 30.8% Never married55.6% Now married3.2% Separated2.0% Widowed8.4% DivorcedFemales 42.8% Never married42.1% Now married1.3% Separated2.6% Widowed11.2% DivorcedWomen who gave birth in the past 12 months Now married:
35.3% (115)Unmarried:
64.7% (212)
Women who did not give birth in the past 12 months Now married:
38.4% (1,854)Unmarried:
61.6% (2,970)
Marital status - American Indian / Alaska Native population 15 years and over
Males 72.0% Never married28.0% Now married0.0% Separated0.0% Widowed0.0% DivorcedFemales 0.0% Never married0.0% Now married0.0% Separated0.0% Widowed100.0% DivorcedMarital status - Asian population 15 years and over
Males 9.7% Never married90.3% Now married0.0% Separated0.0% Widowed0.0% DivorcedFemales 46.9% Never married28.7% Now married0.0% Separated7.2% Widowed17.2% DivorcedWomen who did not give birth in the past 12 months Now married:
11.2% (19)Unmarried:
88.8% (155)
Marital status - Other race population 15 years and over
Males 21.6% Never married65.3% Now married0.0% Separated0.0% Widowed13.2% DivorcedFemales 33.2% Never married64.4% Now married0.0% Separated2.3% Widowed0.0% DivorcedWomen who gave birth in the past 12 months Now married:
100.0% (40)Unmarried:
0.0% (0)
Women who did not give birth in the past 12 months Now married:
67.3% (348)Unmarried:
32.7% (169)
Marital status - Two or more races population 15 years and over
Males 69.9% Never married27.4% Now married0.0% Separated0.0% Widowed2.6% DivorcedFemales 8.9% Never married51.7% Now married0.0% Separated9.7% Widowed29.7% DivorcedWomen who gave birth in the past 12 months Now married:
63.2% (37)Unmarried:
36.8% (21)
Women who did not give birth in the past 12 months Now married:
41.6% (262)Unmarried:
58.4% (368)
Marital status - White alone, not Hispanic / Latino population 15 years and over
Males 22.0% Never married61.9% Now married1.1% Separated4.3% Widowed10.7% DivorcedFemales 22.1% Never married53.1% Now married1.6% Separated10.6% Widowed12.6% DivorcedWomen who gave birth in the past 12 months Now married:
58.5% (185)Unmarried:
41.5% (132)
Women who did not give birth in the past 12 months Now married:
48.9% (2,566)Unmarried:
51.1% (2,683)
Marital status - Hispanic or Latino population 15 years and over
Males 31.5% Never married58.1% Now married5.0% Separated0.0% Widowed5.3% DivorcedFemales 28.5% Never married59.8% Now married0.0% Separated5.4% Widowed6.3% DivorcedWomen who gave birth in the past 12 months Now married:
65.0% (29)Unmarried:
35.0% (16)
Women who did not give birth in the past 12 months Now married:
67.6% (485)Unmarried:
32.4% (232)
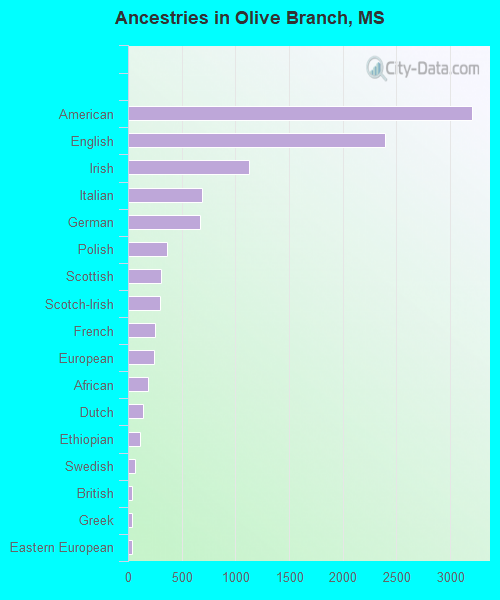
Ancestries in Olive Branch
3,202 13.4% American2,394 10.0% English1,124 4.7% Irish687 2.9% Italian669 2.8% German359 1.5% Polish310 1.3% Scottish295 1.2% Scotch-Irish247 1.0% French242 1.0% European182 0.8% African137 0.6% Dutch108 0.5% Ethiopian67 0.3% Swedish40 0.2% British37 0.2% Greek34 0.1% Eastern European25 0.1% Hungarian23 0.10% Russian16 0.07% Welsh12 0.05% Portuguese11 0.05% Syrian8 0.03% Scandinavian5 0.02% Norwegian
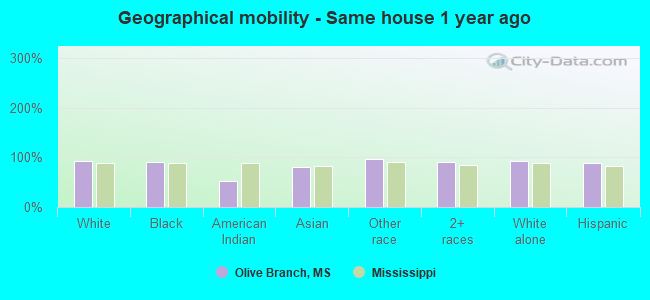
Geographical mobility in Olive Branch Same house 1 year ago 24,113 93.2% White (Caucasian)14,552 89.8% Black or African American41 53.2% American Indian / Alaska Native539 80.5% Asian1,381 96.9% Other race2,490 90.0% Two or more races23,920 93.4% White alone, not Hispanic / Latino2,000 87.6% Hispanic or LatinoMoved within same county 606 2.3% White / Caucasian632 3.9% Black or African American56 72.6% American Indian / Alaska Native80 2.9% Two or more races568 2.2% White alone, not Hispanic / Latino55 2.4% Hispanic or LatinoMoved within same state 197 0.8% White / Caucasian366 2.3% Black or African American3 4.1% American Indian / Alaska Native138 20.6% Asian186 0.7% White alone, not Hispanic / Latino4 0.2% Hispanic or LatinoMoved from different state 1,119 4.3% White / Caucasian659 4.1% Black or African American6 0.9% Asian35 2.5% Other race162 5.9% Two or more races1,091 4.3% White alone, not Hispanic / Latino185 8.1% Hispanic or LatinoMoved from abroad 6 0.0% White57 0.4% Black or African American13 0.6% Hispanic or Latino
Children Nativity (place of birth) in Olive Branch
Children under 6 years - Living with two parents Both parents native 2,075 100.0% NativeBoth parents foreign-born 131 88.6% Native17 11.4% Foreign-bornOne native, one foreign-born parent 148 100.0% NativeChildren under 6 years - Living with one parent Native parent 833 100.0% NativeChildren 6 to 17 years - Living with two parents Both parents native 4,388 99.6% Native16 0.4% Foreign-bornBoth parents foreign-born 310 73.7% Native111 26.3% Foreign-bornOne native, one foreign-born parent 74 89.2% Native9 10.8% Foreign-bornChildren 6 to 17 years - Living with one parent Native parent 2,429 100.0% NativeForeign-born parent 56 46.3% Native65 53.7% Foreign-born
Grandparents responsible for own grandchildren in Olive Branch
Grandparents (30 to 59 years) White / Caucasian 112 60.5% Responsible for grandchildren73 39.5% Not responsible for grandchildrenBlack or African American 267 58.9% Responsible for grandchildren186 41.1% Not responsible for grandchildrenOther race 19 15.3% Responsible for grandchildren106 84.7% Not responsible for grandchildrenWhite alone, not Hispanic / Latino 112 60.5% Responsible for grandchildren73 39.5% Not responsible for grandchildrenHispanic or Latino 14 12.0% Responsible for grandchildren105 88.0% Not responsible for grandchildrenGrandparents (60 years and over) White / Caucasian 51 38.0% Responsible for grandchildren84 62.0% Not responsible for grandchildrenBlack or African American 123 100.0% Not responsible for grandchildrenOther race 10 100.0% Not responsible for grandchildrenWhite alone, not Hispanic / Latino 51 38.0% Responsible for grandchildren84 62.0% Not responsible for grandchildrenHispanic or Latino 11 100.0% Not responsible for grandchildren