Races in Old Jamestown, Missouri (MO) Detailed Stats
Data:
Races - White alone (%)
Races - White alone (% change since 2000)
Races - Black alone (%)
Races - Black alone (% change since 2000)
Races - American Indian alone (%)
Races - American Indian alone (% change since 2000)
Races - Asian alone (%)
Races - Asian alone (% change since 2000)
Races - Hispanic (%)
Races - Hispanic (% change since 2000)
Races - Native Hawaiian and Other Pacific Islander alone (%)
Races - Native Hawaiian and Other Pacific Islander alone (% change since 2000)
Races - Two or more races(%)
Races - Two or more races(% change since 2000)
Races - Other race alone (%)
Races - Other race alone (% change since 2000)
Racial diversity
Place of birth - Born in state of residence (%)
Place of birth - Born in state of residence (%) - White
Place of birth - Born in state of residence (%) - Black or African American
Place of birth - Born in state of residence (%) - Asian
Place of birth - Born in state of residence (%) - Hispanic or Latino
Place of birth - Born in state of residence (%) - American Indian and Alaska Native
Place of birth - Born in state of residence (%) - Multirace
Place of birth - Born in state of residence (%) - Other Race
Place of birth - Born in other state (%)
Place of birth - Born in other state (%) - White
Place of birth - Born in other state (%) - Black or African American
Place of birth - Born in other state (%) - Asian
Place of birth - Born in other state (%) - Hispanic or Latino
Place of birth - Born in other state (%) - American Indian and Alaska Native
Place of birth - Born in other state (%) - Multirace
Place of birth - Born in other state (%) - Other Race
Place of birth - Native, outside of US (%)
Place of birth - Native, outside of US (%) - White
Place of birth - Native, outside of US (%) - Black or African American
Place of birth - Native, outside of US (%) - Asian
Place of birth - Native, outside of US (%) - Hispanic or Latino
Place of birth - Native, outside of US (%) - American Indian and Alaska Native
Place of birth - Native, outside of US (%) - Multirace
Place of birth - Native, outside of US (%) - Other Race
Place of birth - Foreign born (%)
Place of birth - Foreign born (%) - White
Place of birth - Foreign born (%) - Black or African American
Place of birth - Foreign born (%) - Asian
Place of birth - Foreign born (%) - Hispanic or Latino
Place of birth - Foreign born (%) - American Indian and Alaska Native
Place of birth - Foreign born (%) - Multirace
Place of birth - Foreign born (%) - Other Race
Residents speaking English at home (%)
Residents speaking English at home - Born in the United States (%)
Residents speaking English at home - Native, born elsewhere (%)
Residents speaking English at home - Foreign born (%)
Residents speaking Spanish at home (%)
Residents speaking Spanish at home - Born in the United States (%)
Residents speaking Spanish at home - Native, born elsewhere (%)
Residents speaking Spanish at home - Foreign born (%)
Residents speaking other language at home (%)
Residents speaking other language at home - Born in the United States (%)
Residents speaking other language at home - Native, born elsewhere (%)
Residents speaking other language at home - Foreign born (%)
Marital status - Never married (%)
Marital status - Now married (%)
Marital status - Separated (%)
Marital status - Widowed (%)
Marital status - Divorced (%)
Ancestries Reported - Arab (%)
Ancestries Reported - Czech (%)
Ancestries Reported - Danish (%)
Ancestries Reported - Dutch (%)
Ancestries Reported - English (%)
Ancestries Reported - French (%)
Ancestries Reported - French Canadian (%)
Ancestries Reported - German (%)
Ancestries Reported - Greek (%)
Ancestries Reported - Hungarian (%)
Ancestries Reported - Irish (%)
Ancestries Reported - Italian (%)
Ancestries Reported - Lithuanian (%)
Ancestries Reported - Norwegian (%)
Ancestries Reported - Polish (%)
Ancestries Reported - Portuguese (%)
Ancestries Reported - Russian (%)
Ancestries Reported - Scotch-Irish (%)
Ancestries Reported - Scottish (%)
Ancestries Reported - Slovak (%)
Ancestries Reported - Subsaharan African (%)
Ancestries Reported - Swedish (%)
Ancestries Reported - Swiss (%)
Ancestries Reported - Ukrainian (%)
Ancestries Reported - United States (%)
Ancestries Reported - Welsh (%)
Ancestries Reported - West Indian (%)
Ancestries Reported - Other (%)
Geographical mobility - Same house 1 year ago (%)
Geographical mobility - Same house 1 year ago (%) - White
Geographical mobility - Same house 1 year ago (%) - Black or African American
Geographical mobility - Same house 1 year ago (%) - Asian
Geographical mobility - Same house 1 year ago (%) - Hispanic or Latino
Geographical mobility - Same house 1 year ago (%) - American Indian and Alaska Native
Geographical mobility - Same house 1 year ago (%) - Multirace
Geographical mobility - Same house 1 year ago (%) - Other Race
Geographical mobility - Moved within same county (%)
Geographical mobility - Moved within same county (%) - White
Geographical mobility - Moved within same county (%) - Black or African American
Geographical mobility - Moved within same county (%) - Asian
Geographical mobility - Moved within same county (%) - Hispanic or Latino
Geographical mobility - Moved within same county (%) - American Indian and Alaska Native
Geographical mobility - Moved within same county (%) - Multirace
Geographical mobility - Moved within same county (%) - Other Race
Geographical mobility - Moved from different county within same state (%)
Geographical mobility - Moved from different county within same state (%) - White
Geographical mobility - Moved from different county within same state (%) - Black or African American
Geographical mobility - Moved from different county within same state (%) - Asian
Geographical mobility - Moved from different county within same state (%) - Hispanic or Latino
Geographical mobility - Moved from different county within same state (%) - American Indian and Alaska Native
Geographical mobility - Moved from different county within same state (%) - Multirace
Geographical mobility - Moved from different county within same state (%) - Other Race
Geographical mobility - Moved from different state (%)
Geographical mobility - Moved from different state (%) - White
Geographical mobility - Moved from different state (%) - Black or African American
Geographical mobility - Moved from different state (%) - Asian
Geographical mobility - Moved from different state (%) - Hispanic or Latino
Geographical mobility - Moved from different state (%) - American Indian and Alaska Native
Geographical mobility - Moved from different state (%) - Multirace
Geographical mobility - Moved from different state (%) - Other Race
Geographical mobility - Moved from abroad (%)
Geographical mobility - Moved from abroad (%) - White
Geographical mobility - Moved from abroad (%) - Black or African American
Geographical mobility - Moved from abroad (%) - Asian
Geographical mobility - Moved from abroad (%) - Hispanic or Latino
Geographical mobility - Moved from abroad (%) - American Indian and Alaska Native
Geographical mobility - Moved from abroad (%) - Multirace
Geographical mobility - Moved from abroad (%) - Other Race
Place of birth for the foreign-born population - Ireland (%)
Place of birth for the foreign-born population - Denmark (%)
Place of birth for the foreign-born population - Norway (%)
Place of birth for the foreign-born population - Sweden (%)
Place of birth for the foreign-born population - United Kingdom (%)
Place of birth for the foreign-born population - England (%)
Place of birth for the foreign-born population - Scotland (%)
Place of birth for the foreign-born population - Other Northern Europe (%)
Place of birth for the foreign-born population - Austria (%)
Place of birth for the foreign-born population - Belgium (%)
Place of birth for the foreign-born population - France (%)
Place of birth for the foreign-born population - Germany (%)
Place of birth for the foreign-born population - Netherlands (%)
Place of birth for the foreign-born population - Switzerland (%)
Place of birth for the foreign-born population - Other Western Europe (%)
Place of birth for the foreign-born population - Greece (%)
Place of birth for the foreign-born population - Italy (%)
Place of birth for the foreign-born population - Portugal (%)
Place of birth for the foreign-born population - Spain (%)
Place of birth for the foreign-born population - Other Southern Europe (%)
Place of birth for the foreign-born population - Albania (%)
Place of birth for the foreign-born population - Belarus (%)
Place of birth for the foreign-born population - Bosnia and Herzegovina (%)
Place of birth for the foreign-born population - Bulgaria (%)
Place of birth for the foreign-born population - Croatia (%)
Place of birth for the foreign-born population - Czechoslovakia (%)
Place of birth for the foreign-born population - Hungary (%)
Place of birth for the foreign-born population - Latvia (%)
Place of birth for the foreign-born population - Lithuania (%)
Place of birth for the foreign-born population - North Macedonia (Macedonia) (%)
Place of birth for the foreign-born population - Moldova (%)
Place of birth for the foreign-born population - Poland (%)
Place of birth for the foreign-born population - Romania (%)
Place of birth for the foreign-born population - Russia (%)
Place of birth for the foreign-born population - Serbia (%)
Place of birth for the foreign-born population - Ukraine (%)
Place of birth for the foreign-born population - Other Eastern Europe (%)
Place of birth for the foreign-born population - China (%)
Place of birth for the foreign-born population - Hong Kong (%)
Place of birth for the foreign-born population - Taiwan (%)
Place of birth for the foreign-born population - Japan (%)
Place of birth for the foreign-born population - Korea (%)
Place of birth for the foreign-born population - Other Eastern Asia (%)
Place of birth for the foreign-born population - Afghanistan (%)
Place of birth for the foreign-born population - Bangladesh (%)
Place of birth for the foreign-born population - India (%)
Place of birth for the foreign-born population - Iran (%)
Place of birth for the foreign-born population - Kazakhstan (%)
Place of birth for the foreign-born population - Nepal (%)
Place of birth for the foreign-born population - Pakistan (%)
Place of birth for the foreign-born population - Sri Lanka (%)
Place of birth for the foreign-born population - Uzbekistan (%)
Place of birth for the foreign-born population - Other South Central Asia (%)
Place of birth for the foreign-born population - Burma (%)
Place of birth for the foreign-born population - Cambodia (%)
Place of birth for the foreign-born population - Indonesia (%)
Place of birth for the foreign-born population - Laos (%)
Place of birth for the foreign-born population - Malaysia (%)
Place of birth for the foreign-born population - Philippines (%)
Place of birth for the foreign-born population - Singapore (%)
Place of birth for the foreign-born population - Thailand (%)
Place of birth for the foreign-born population - Vietnam (%)
Place of birth for the foreign-born population - Other South Eastern Asia (%)
Place of birth for the foreign-born population - Armenia (%)
Place of birth for the foreign-born population - Iraq (%)
Place of birth for the foreign-born population - Israel (%)
Place of birth for the foreign-born population - Jordan (%)
Place of birth for the foreign-born population - Kuwait (%)
Place of birth for the foreign-born population - Lebanon (%)
Place of birth for the foreign-born population - Saudi Arabia (%)
Place of birth for the foreign-born population - Syria (%)
Place of birth for the foreign-born population - Turkey (%)
Place of birth for the foreign-born population - Yemen (%)
Place of birth for the foreign-born population - Other Western Asia (%)
Place of birth for the foreign-born population - Eritrea (%)
Place of birth for the foreign-born population - Ethiopia (%)
Place of birth for the foreign-born population - Kenya (%)
Place of birth for the foreign-born population - Somalia (%)
Place of birth for the foreign-born population - Uganda (%)
Place of birth for the foreign-born population - Zimbabwe (%)
Place of birth for the foreign-born population - Other Eastern Africa (%)
Place of birth for the foreign-born population - Cameroon (%)
Place of birth for the foreign-born population - Congo (%)
Place of birth for the foreign-born population - Democratic Republic of Congo (Zaire) (%)
Place of birth for the foreign-born population - Other Middle Africa (%)
Place of birth for the foreign-born population - Egypt (%)
Place of birth for the foreign-born population - Morocco (%)
Place of birth for the foreign-born population - Sudan (%)
Place of birth for the foreign-born population - Other Northern Africa (%)
Place of birth for the foreign-born population - South Africa (%)
Place of birth for the foreign-born population - Other Southern Africa (%)
Place of birth for the foreign-born population - Cabo Verde (%)
Place of birth for the foreign-born population - Ghana (%)
Place of birth for the foreign-born population - Liberia (%)
Place of birth for the foreign-born population - Nigeria (%)
Place of birth for the foreign-born population - Senegal (%)
Place of birth for the foreign-born population - Sierra Leone (%)
Place of birth for the foreign-born population - Other Western Africa (%)
Place of birth for the foreign-born population - Australia (%)
Place of birth for the foreign-born population - New Zealand (%)
Place of birth for the foreign-born population - Fiji (%)
Place of birth for the foreign-born population - Micronesia (%)
Place of birth for the foreign-born population - Bahamas (%)
Place of birth for the foreign-born population - Barbados (%)
Place of birth for the foreign-born population - Cuba (%)
Place of birth for the foreign-born population - Dominica (%)
Place of birth for the foreign-born population - Dominican Republic (%)
Place of birth for the foreign-born population - Grenada (%)
Place of birth for the foreign-born population - Haiti (%)
Place of birth for the foreign-born population - Jamaica (%)
Place of birth for the foreign-born population - St. Vincent and the Grenadines (%)
Place of birth for the foreign-born population - Trinidad and Tobago (%)
Place of birth for the foreign-born population - West Indies (%)
Place of birth for the foreign-born population - Other Caribbean (%)
Place of birth for the foreign-born population - Belize (%)
Place of birth for the foreign-born population - Costa Rica (%)
Place of birth for the foreign-born population - El Salvador (%)
Place of birth for the foreign-born population - Guatemala (%)
Place of birth for the foreign-born population - Honduras (%)
Place of birth for the foreign-born population - Mexico (%)
Place of birth for the foreign-born population - Nicaragua (%)
Place of birth for the foreign-born population - Panama (%)
Place of birth for the foreign-born population - Other Central America (%)
Place of birth for the foreign-born population - Argentina (%)
Place of birth for the foreign-born population - Bolivia (%)
Place of birth for the foreign-born population - Brazil (%)
Place of birth for the foreign-born population - Chile (%)
Place of birth for the foreign-born population - Colombia (%)
Place of birth for the foreign-born population - Ecuador (%)
Place of birth for the foreign-born population - Guyana (%)
Place of birth for the foreign-born population - Peru (%)
Place of birth for the foreign-born population - Uruguay (%)
Place of birth for the foreign-born population - Venezuela (%)
Place of birth for the foreign-born population - Other South America (%)
Place of birth for the foreign-born population - Canada (%)
Place of birth for the foreign-born population - Other Northern America (%)
Place of birth for the foreign-born population - Other (%)
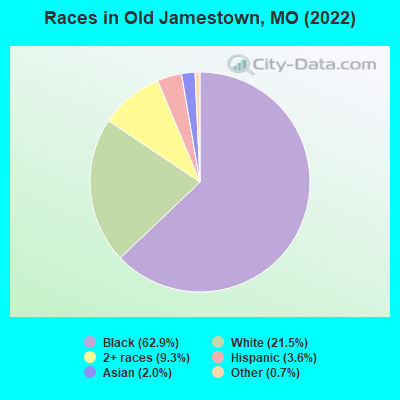
According to 2022 data, the most numerous races in Old Jamestown, MO are White alone (4,346 residents), Black alone (12,705 residents), and Two or more races (1,885 residents). 93.7% of Old Jamestown residents speak English at home.
Race distribution in Old Jamestown 12,705 62.9% Black alone 4,346 21.5% White alone 1,885 9.3% Two or more races 730 3.6% Hispanic 401 2.0% Asian alone 144 0.7% Other race alone 5 0.02% American Indian alone 2 0.01% Native Hawaiian and Other
2000 2022
4,686,474 83.8% White alone 625,667 11.2% Black alone 118,592 2.1% Hispanic 71,905 1.3% Two or more races 61,041 1.1% Asian alone 23,302 0.4% American Indian alone 5,291 0.09% Other race alone 2,939 0.05% Native Hawaiian and Other
4,733,411 76.6% White alone 656,739 10.6% Black alone 316,300 5.1% Two or more races 291,763 4.7% Hispanic 132,436 2.1% Asian alone 27,467 0.4% Other race alone 12,313 0.2% American Indian alone 7,528 0.1% Native Hawaiian and Other
Income and house value in Old Jamestown Median household income in 2022 $101,798 White non-Hispanic householders$106,363 Black householders$112,922 Two or more races householders
Median age by race in Old Jamestown
61.1 Median age for White residents57.7 62.7 41.3 Median age for Black or African American residents40.2 43.6 -520,187,792.9 Median age for American Indian / Alaska Native residents-644,003,776.5 -505,494,505.0 37.0 Median age for Asian residents24.9 54.2 -710,303,029.6 Median age for Native Hawaiian / Pacific Islander residents-1,449,781,657.9 -752,136,751.4 13.8 Median age for Other race residents40.3 14.2 22.9 Median age for Two or more races residents22.8 31.5 61.1 Median age for White alone residents57.6 63.0 23.0 Median age for Hispanic or Latino residents30.5 13.1
Owner/renter occupied households by race in Old Jamestown
House owners and renters - White residents 1,848 98.0% Owner occupied37 2.0% Renter occupiedHouse owners and renters - Black or African American residents 3,720 85.8% Owner occupied615 14.2% Renter occupiedHouse owners and renters - American Indian / Alaska Native residents 6 100.0% Owner occupiedHouse owners and renters - Asian residents 104 100.0% Owner occupiedHouse owners and renters - Other race residents 22 100.0% Owner occupiedHouse owners and renters - Two or more races residents 522 81.6% Owner occupied118 18.4% Renter occupiedHouse owners and renters - White alone residents 1,835 98.0% Owner occupied37 2.0% Renter occupiedHouse owners and renters - Hispanic or Latino residents 75 77.7% Owner occupied21 22.3% Renter occupied
Language usage in Old Jamestown
English speakers - Total 93.7% of residents of Old Jamestown speak English at home.
1.2% of residents speak Spanish at home 125 55.1% Speak English very well102 44.9% Speak English less than very well5.0% of residents speak other language at home 626 66.5% Speak English very well316 33.5% Speak English less than very well
English speakers - Born in the United States 94.7% of residents of Old Jamestown speak English at home.
0.2% of residents speak Spanish at home 7 100.0% Speak English less than very well5.7% of residents speak other language at home 205 100.0% Speak English very well
English speakers - Native, born elsewhere 72.2% of residents of Old Jamestown speak English at home.
26.8% of residents speak Spanish at home 30 56.6% Speak English very well23 43.4% Speak English less than very well
English speakers - Foreign-born 37.0% of residents of Old Jamestown speak English at home.
4.2% of residents speak Spanish at home 26 60.5% Speak English very well17 39.5% Speak English less than very well59.1% of residents speak other language at home 318 52.0% Speak English very well293 48.0% Speak English less than very well
White (Caucasian) - Speak only English Native:
97.5% (3,977)Foreign-born:
8.8% (15)
White (Caucasian) - Speak another language Native:
2.5% (101)Foreign-born:
94.0% (156)
Black or African American - Speak only English Native:
98.2% (10,803)Foreign-born:
64.4% (442)
Black or African American - Speak another language Native:
1.3% (148)Foreign-born:
43.3% (297)
Asian - Speak another language Native:
85.0% (186)Foreign-born:
95.4% (201)
Two or more races - Speak only English Native:
92.5% (2,231)Foreign-born:
36.5% (25)
Two or more races - Speak another language Native:
7.5% (180)Foreign-born:
42.7% (30)
White alone - Speak only English Native:
98.0% (3,943)Foreign-born:
10.0% (15)
White alone - Speak another language Native:
2.0% (80)Foreign-born:
93.0% (139)
Hispanic or Latino - Speak only English Native:
97.4% (649)Foreign-born:
7.6% (4)
Hispanic or Latino - Speak another language Native:
10.5% (70)Foreign-born:
92.4% (46)
Foreign-born residents in Old Jamestown
Marital status for residents in Old Jamestown Marital status - White (Caucasian) population 15 years and over
Males 23.9% Never married64.9% Now married1.1% Separated2.1% Widowed7.9% DivorcedFemales 12.3% Never married63.0% Now married0.6% Separated14.0% Widowed10.2% DivorcedWomen who gave birth in the past 12 months Now married:
100.0% (12)Unmarried:
0.0% (0)
Women who did not give birth in the past 12 months Now married:
60.9% (250)Unmarried:
39.1% (161)
Marital status - Black or African American population 15 years and over
Males 39.3% Never married52.5% Now married0.0% Separated2.8% Widowed5.3% DivorcedFemales 33.6% Never married44.2% Now married4.0% Separated6.8% Widowed11.4% DivorcedWomen who gave birth in the past 12 months Now married:
100.0% (52)Unmarried:
0.0% (0)
Women who did not give birth in the past 12 months Now married:
39.9% (1,186)Unmarried:
60.1% (1,785)
Marital status - Asian population 15 years and over
Males 38.1% Never married61.9% Now married0.0% Separated0.0% Widowed0.0% DivorcedFemales 14.5% Never married85.5% Now married0.0% Separated0.0% Widowed0.0% DivorcedWomen who did not give birth in the past 12 months Now married:
58.5% (25)Unmarried:
41.5% (18)
Marital status - Other race population 15 years and over
Males 0.0% Never married100.0% Now married0.0% Separated0.0% Widowed0.0% DivorcedFemales 0.0% Never married100.0% Now married0.0% Separated0.0% Widowed0.0% DivorcedWomen who did not give birth in the past 12 months Now married:
100.0% (19)Unmarried:
0.0% (0)
Marital status - Two or more races population 15 years and over
Males 45.7% Never married52.2% Now married0.5% Separated0.3% Widowed1.3% DivorcedFemales 34.0% Never married37.2% Now married0.0% Separated10.9% Widowed17.8% DivorcedWomen who did not give birth in the past 12 months Now married:
34.9% (180)Unmarried:
65.1% (335)
Marital status - White alone, not Hispanic / Latino population 15 years and over
Males 23.2% Never married66.4% Now married1.2% Separated1.6% Widowed7.6% DivorcedFemales 11.3% Never married64.0% Now married0.6% Separated14.3% Widowed9.8% DivorcedWomen who gave birth in the past 12 months Now married:
100.0% (13)Unmarried:
0.0% (0)
Women who did not give birth in the past 12 months Now married:
60.9% (252)Unmarried:
39.1% (162)
Marital status - Hispanic or Latino population 15 years and over
Males 52.7% Never married36.7% Now married0.0% Separated4.8% Widowed5.8% DivorcedFemales 26.3% Never married38.6% Now married0.0% Separated13.5% Widowed21.6% DivorcedWomen who did not give birth in the past 12 months Now married:
36.1% (24)Unmarried:
63.9% (42)
Ancestries in Old Jamestown
565 4.5% German328 2.6% American263 2.1% English234 1.9% Nigerian211 1.7% Irish189 1.5% Italian182 1.4% Kenyan152 1.2% Jamaican122 1.0% Jordanian111 0.9% European108 0.9% African84 0.7% West Indian56 0.4% Trinidadian and Tobagonian44 0.3% Swedish35 0.3% Scottish21 0.2% Eastern European21 0.2% Polish20 0.2% Czech16 0.1% Northern European14 0.1% Austrian11 0.09% Iranian9 0.07% Haitian6 0.05% French4 0.03% British
Geographical mobility in Old Jamestown Same house 1 year ago 4,097 93.0% White (Caucasian)10,653 84.5% Black or African American7 100.0% American Indian / Alaska Native416 100.0% Asian89 94.5% Other race2,479 89.0% Two or more races4,035 93.0% White alone, not Hispanic / Latino606 83.1% Hispanic or LatinoMoved within same county 95 2.1% White / Caucasian1,328 10.5% Black or African American209 7.5% Two or more races94 2.2% White alone, not Hispanic / Latino66 9.1% Hispanic or LatinoMoved within same state 89 2.0% White / Caucasian388 3.1% Black or African American88 2.0% White alone, not Hispanic / LatinoMoved from different state 49 1.1% White / Caucasian136 1.1% Black or African American4 99.3% Native Hawaiian / Pacific Islander29 1.0% Two or more races49 1.1% White alone, not Hispanic / Latino41 5.6% Hispanic or LatinoMoved from abroad 66 1.5% White49 0.4% Black or African American68 1.6% White alone, not Hispanic / Latino
Children Nativity (place of birth) in Old Jamestown
Children under 6 years - Living with two parents Both parents native 804 100.0% NativeBoth parents foreign-born 91 100.0% NativeChildren under 6 years - Living with one parent Native parent 398 100.0% NativeChildren 6 to 17 years - Living with two parents Both parents native 1,480 100.0% NativeBoth parents foreign-born 110 59.2% Native76 40.8% Foreign-bornOne native, one foreign-born parent 322 100.0% NativeChildren 6 to 17 years - Living with one parent Native parent 931 100.0% NativeForeign-born parent 13 48.6% Native14 51.4% Foreign-born
Grandparents responsible for own grandchildren in Old Jamestown
Grandparents (30 to 59 years) White / Caucasian 8 100.0% Responsible for grandchildrenBlack or African American 32 25.6% Responsible for grandchildren94 74.4% Not responsible for grandchildrenWhite alone, not Hispanic / Latino 9 100.0% Responsible for grandchildrenGrandparents (60 years and over) White / Caucasian 35 41.3% Responsible for grandchildren50 58.7% Not responsible for grandchildrenBlack or African American 53 21.9% Responsible for grandchildren191 78.1% Not responsible for grandchildrenWhite alone, not Hispanic / Latino 35 40.9% Responsible for grandchildren51 59.1% Not responsible for grandchildren