Races in Old Bridge, New Jersey (NJ) Detailed Stats
Data:
Races - White alone (%)
Races - White alone (% change since 2000)
Races - Black alone (%)
Races - Black alone (% change since 2000)
Races - American Indian alone (%)
Races - American Indian alone (% change since 2000)
Races - Asian alone (%)
Races - Asian alone (% change since 2000)
Races - Hispanic (%)
Races - Hispanic (% change since 2000)
Races - Native Hawaiian and Other Pacific Islander alone (%)
Races - Native Hawaiian and Other Pacific Islander alone (% change since 2000)
Races - Two or more races(%)
Races - Two or more races(% change since 2000)
Races - Other race alone (%)
Races - Other race alone (% change since 2000)
Racial diversity
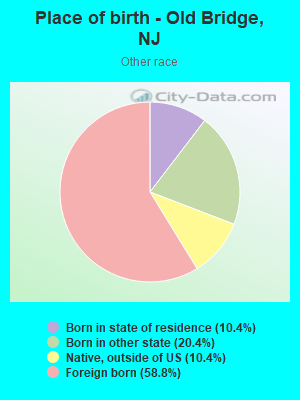
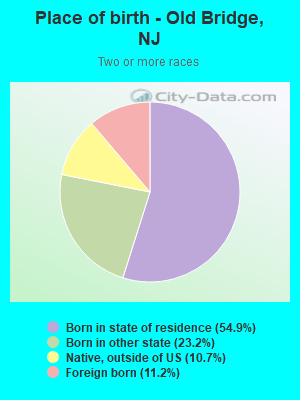
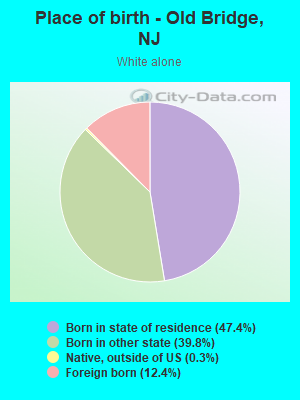
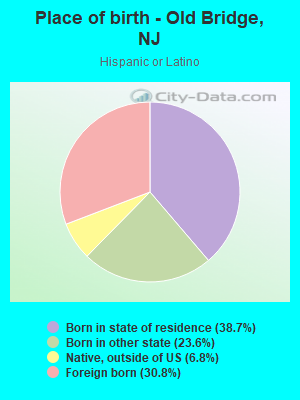
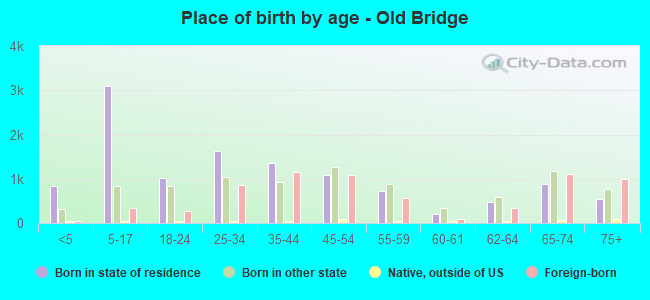
Place of birth - Born in state of residence (%)
Place of birth - Born in state of residence (%) - White
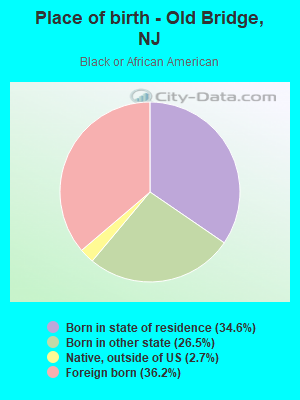
Place of birth - Born in state of residence (%) - Black or African American
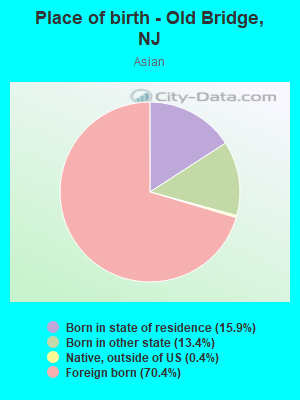
Place of birth - Born in state of residence (%) - Asian
Place of birth - Born in state of residence (%) - Hispanic or Latino
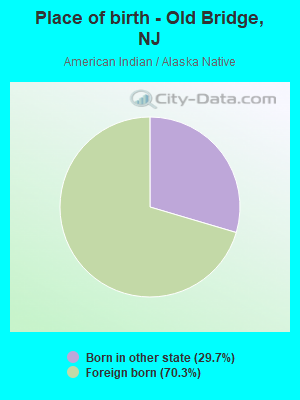
Place of birth - Born in state of residence (%) - American Indian and Alaska Native
Place of birth - Born in state of residence (%) - Multirace
Place of birth - Born in state of residence (%) - Other Race
Place of birth - Born in other state (%)
Place of birth - Born in other state (%) - White
Place of birth - Born in other state (%) - Black or African American
Place of birth - Born in other state (%) - Asian
Place of birth - Born in other state (%) - Hispanic or Latino
Place of birth - Born in other state (%) - American Indian and Alaska Native
Place of birth - Born in other state (%) - Multirace
Place of birth - Born in other state (%) - Other Race
Place of birth - Native, outside of US (%)
Place of birth - Native, outside of US (%) - White
Place of birth - Native, outside of US (%) - Black or African American
Place of birth - Native, outside of US (%) - Asian
Place of birth - Native, outside of US (%) - Hispanic or Latino
Place of birth - Native, outside of US (%) - American Indian and Alaska Native
Place of birth - Native, outside of US (%) - Multirace
Place of birth - Native, outside of US (%) - Other Race
Place of birth - Foreign born (%)
Place of birth - Foreign born (%) - White
Place of birth - Foreign born (%) - Black or African American
Place of birth - Foreign born (%) - Asian
Place of birth - Foreign born (%) - Hispanic or Latino
Place of birth - Foreign born (%) - American Indian and Alaska Native
Place of birth - Foreign born (%) - Multirace
Place of birth - Foreign born (%) - Other Race
Residents speaking English at home (%)
Residents speaking English at home - Born in the United States (%)
Residents speaking English at home - Native, born elsewhere (%)
Residents speaking English at home - Foreign born (%)
Residents speaking Spanish at home (%)
Residents speaking Spanish at home - Born in the United States (%)
Residents speaking Spanish at home - Native, born elsewhere (%)
Residents speaking Spanish at home - Foreign born (%)
Residents speaking other language at home (%)
Residents speaking other language at home - Born in the United States (%)
Residents speaking other language at home - Native, born elsewhere (%)
Residents speaking other language at home - Foreign born (%)
Marital status - Never married (%)
Marital status - Now married (%)
Marital status - Separated (%)
Marital status - Widowed (%)
Marital status - Divorced (%)
Ancestries Reported - Arab (%)
Ancestries Reported - Czech (%)
Ancestries Reported - Danish (%)
Ancestries Reported - Dutch (%)
Ancestries Reported - English (%)
Ancestries Reported - French (%)
Ancestries Reported - French Canadian (%)
Ancestries Reported - German (%)
Ancestries Reported - Greek (%)
Ancestries Reported - Hungarian (%)
Ancestries Reported - Irish (%)
Ancestries Reported - Italian (%)
Ancestries Reported - Lithuanian (%)
Ancestries Reported - Norwegian (%)
Ancestries Reported - Polish (%)
Ancestries Reported - Portuguese (%)
Ancestries Reported - Russian (%)
Ancestries Reported - Scotch-Irish (%)
Ancestries Reported - Scottish (%)
Ancestries Reported - Slovak (%)
Ancestries Reported - Subsaharan African (%)
Ancestries Reported - Swedish (%)
Ancestries Reported - Swiss (%)
Ancestries Reported - Ukrainian (%)
Ancestries Reported - United States (%)
Ancestries Reported - Welsh (%)
Ancestries Reported - West Indian (%)
Ancestries Reported - Other (%)
Geographical mobility - Same house 1 year ago (%)
Geographical mobility - Same house 1 year ago (%) - White
Geographical mobility - Same house 1 year ago (%) - Black or African American
Geographical mobility - Same house 1 year ago (%) - Asian
Geographical mobility - Same house 1 year ago (%) - Hispanic or Latino
Geographical mobility - Same house 1 year ago (%) - American Indian and Alaska Native
Geographical mobility - Same house 1 year ago (%) - Multirace
Geographical mobility - Same house 1 year ago (%) - Other Race
Geographical mobility - Moved within same county (%)
Geographical mobility - Moved within same county (%) - White
Geographical mobility - Moved within same county (%) - Black or African American
Geographical mobility - Moved within same county (%) - Asian
Geographical mobility - Moved within same county (%) - Hispanic or Latino
Geographical mobility - Moved within same county (%) - American Indian and Alaska Native
Geographical mobility - Moved within same county (%) - Multirace
Geographical mobility - Moved within same county (%) - Other Race
Geographical mobility - Moved from different county within same state (%)
Geographical mobility - Moved from different county within same state (%) - White
Geographical mobility - Moved from different county within same state (%) - Black or African American
Geographical mobility - Moved from different county within same state (%) - Asian
Geographical mobility - Moved from different county within same state (%) - Hispanic or Latino
Geographical mobility - Moved from different county within same state (%) - American Indian and Alaska Native
Geographical mobility - Moved from different county within same state (%) - Multirace
Geographical mobility - Moved from different county within same state (%) - Other Race
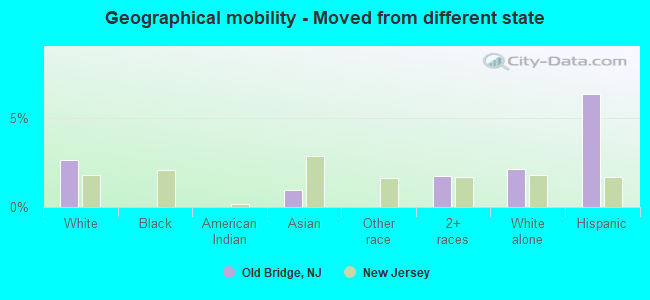
Geographical mobility - Moved from different state (%)
Geographical mobility - Moved from different state (%) - White
Geographical mobility - Moved from different state (%) - Black or African American
Geographical mobility - Moved from different state (%) - Asian
Geographical mobility - Moved from different state (%) - Hispanic or Latino
Geographical mobility - Moved from different state (%) - American Indian and Alaska Native
Geographical mobility - Moved from different state (%) - Multirace
Geographical mobility - Moved from different state (%) - Other Race
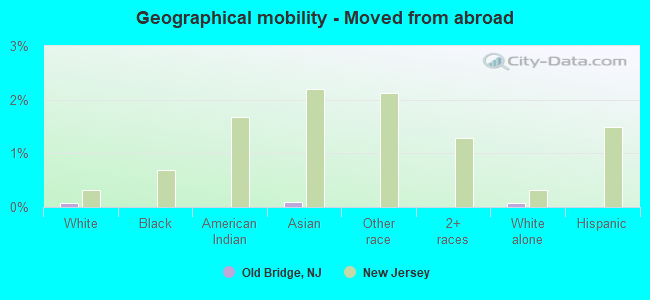
Geographical mobility - Moved from abroad (%)
Geographical mobility - Moved from abroad (%) - White
Geographical mobility - Moved from abroad (%) - Black or African American
Geographical mobility - Moved from abroad (%) - Asian
Geographical mobility - Moved from abroad (%) - Hispanic or Latino
Geographical mobility - Moved from abroad (%) - American Indian and Alaska Native
Geographical mobility - Moved from abroad (%) - Multirace
Geographical mobility - Moved from abroad (%) - Other Race
Place of birth for the foreign-born population - Ireland (%)
Place of birth for the foreign-born population - Denmark (%)
Place of birth for the foreign-born population - Norway (%)
Place of birth for the foreign-born population - Sweden (%)
Place of birth for the foreign-born population - United Kingdom (%)
Place of birth for the foreign-born population - England (%)
Place of birth for the foreign-born population - Scotland (%)
Place of birth for the foreign-born population - Other Northern Europe (%)
Place of birth for the foreign-born population - Austria (%)
Place of birth for the foreign-born population - Belgium (%)
Place of birth for the foreign-born population - France (%)
Place of birth for the foreign-born population - Germany (%)
Place of birth for the foreign-born population - Netherlands (%)
Place of birth for the foreign-born population - Switzerland (%)
Place of birth for the foreign-born population - Other Western Europe (%)
Place of birth for the foreign-born population - Greece (%)
Place of birth for the foreign-born population - Italy (%)
Place of birth for the foreign-born population - Portugal (%)
Place of birth for the foreign-born population - Spain (%)
Place of birth for the foreign-born population - Other Southern Europe (%)
Place of birth for the foreign-born population - Albania (%)
Place of birth for the foreign-born population - Belarus (%)
Place of birth for the foreign-born population - Bosnia and Herzegovina (%)
Place of birth for the foreign-born population - Bulgaria (%)
Place of birth for the foreign-born population - Croatia (%)
Place of birth for the foreign-born population - Czechoslovakia (%)
Place of birth for the foreign-born population - Hungary (%)
Place of birth for the foreign-born population - Latvia (%)
Place of birth for the foreign-born population - Lithuania (%)
Place of birth for the foreign-born population - North Macedonia (Macedonia) (%)
Place of birth for the foreign-born population - Moldova (%)
Place of birth for the foreign-born population - Poland (%)
Place of birth for the foreign-born population - Romania (%)
Place of birth for the foreign-born population - Russia (%)
Place of birth for the foreign-born population - Serbia (%)
Place of birth for the foreign-born population - Ukraine (%)
Place of birth for the foreign-born population - Other Eastern Europe (%)
Place of birth for the foreign-born population - China (%)
Place of birth for the foreign-born population - Hong Kong (%)
Place of birth for the foreign-born population - Taiwan (%)
Place of birth for the foreign-born population - Japan (%)
Place of birth for the foreign-born population - Korea (%)
Place of birth for the foreign-born population - Other Eastern Asia (%)
Place of birth for the foreign-born population - Afghanistan (%)
Place of birth for the foreign-born population - Bangladesh (%)
Place of birth for the foreign-born population - India (%)
Place of birth for the foreign-born population - Iran (%)
Place of birth for the foreign-born population - Kazakhstan (%)
Place of birth for the foreign-born population - Nepal (%)
Place of birth for the foreign-born population - Pakistan (%)
Place of birth for the foreign-born population - Sri Lanka (%)
Place of birth for the foreign-born population - Uzbekistan (%)
Place of birth for the foreign-born population - Other South Central Asia (%)
Place of birth for the foreign-born population - Burma (%)
Place of birth for the foreign-born population - Cambodia (%)
Place of birth for the foreign-born population - Indonesia (%)
Place of birth for the foreign-born population - Laos (%)
Place of birth for the foreign-born population - Malaysia (%)
Place of birth for the foreign-born population - Philippines (%)
Place of birth for the foreign-born population - Singapore (%)
Place of birth for the foreign-born population - Thailand (%)
Place of birth for the foreign-born population - Vietnam (%)
Place of birth for the foreign-born population - Other South Eastern Asia (%)
Place of birth for the foreign-born population - Armenia (%)
Place of birth for the foreign-born population - Iraq (%)
Place of birth for the foreign-born population - Israel (%)
Place of birth for the foreign-born population - Jordan (%)
Place of birth for the foreign-born population - Kuwait (%)
Place of birth for the foreign-born population - Lebanon (%)
Place of birth for the foreign-born population - Saudi Arabia (%)
Place of birth for the foreign-born population - Syria (%)
Place of birth for the foreign-born population - Turkey (%)
Place of birth for the foreign-born population - Yemen (%)
Place of birth for the foreign-born population - Other Western Asia (%)
Place of birth for the foreign-born population - Eritrea (%)
Place of birth for the foreign-born population - Ethiopia (%)
Place of birth for the foreign-born population - Kenya (%)
Place of birth for the foreign-born population - Somalia (%)
Place of birth for the foreign-born population - Uganda (%)
Place of birth for the foreign-born population - Zimbabwe (%)
Place of birth for the foreign-born population - Other Eastern Africa (%)
Place of birth for the foreign-born population - Cameroon (%)
Place of birth for the foreign-born population - Congo (%)
Place of birth for the foreign-born population - Democratic Republic of Congo (Zaire) (%)
Place of birth for the foreign-born population - Other Middle Africa (%)
Place of birth for the foreign-born population - Egypt (%)
Place of birth for the foreign-born population - Morocco (%)
Place of birth for the foreign-born population - Sudan (%)
Place of birth for the foreign-born population - Other Northern Africa (%)
Place of birth for the foreign-born population - South Africa (%)
Place of birth for the foreign-born population - Other Southern Africa (%)
Place of birth for the foreign-born population - Cabo Verde (%)
Place of birth for the foreign-born population - Ghana (%)
Place of birth for the foreign-born population - Liberia (%)
Place of birth for the foreign-born population - Nigeria (%)
Place of birth for the foreign-born population - Senegal (%)
Place of birth for the foreign-born population - Sierra Leone (%)
Place of birth for the foreign-born population - Other Western Africa (%)
Place of birth for the foreign-born population - Australia (%)
Place of birth for the foreign-born population - New Zealand (%)
Place of birth for the foreign-born population - Fiji (%)
Place of birth for the foreign-born population - Micronesia (%)
Place of birth for the foreign-born population - Bahamas (%)
Place of birth for the foreign-born population - Barbados (%)
Place of birth for the foreign-born population - Cuba (%)
Place of birth for the foreign-born population - Dominica (%)
Place of birth for the foreign-born population - Dominican Republic (%)
Place of birth for the foreign-born population - Grenada (%)
Place of birth for the foreign-born population - Haiti (%)
Place of birth for the foreign-born population - Jamaica (%)
Place of birth for the foreign-born population - St. Vincent and the Grenadines (%)
Place of birth for the foreign-born population - Trinidad and Tobago (%)
Place of birth for the foreign-born population - West Indies (%)
Place of birth for the foreign-born population - Other Caribbean (%)
Place of birth for the foreign-born population - Belize (%)
Place of birth for the foreign-born population - Costa Rica (%)
Place of birth for the foreign-born population - El Salvador (%)
Place of birth for the foreign-born population - Guatemala (%)
Place of birth for the foreign-born population - Honduras (%)
Place of birth for the foreign-born population - Mexico (%)
Place of birth for the foreign-born population - Nicaragua (%)
Place of birth for the foreign-born population - Panama (%)
Place of birth for the foreign-born population - Other Central America (%)
Place of birth for the foreign-born population - Argentina (%)
Place of birth for the foreign-born population - Bolivia (%)
Place of birth for the foreign-born population - Brazil (%)
Place of birth for the foreign-born population - Chile (%)
Place of birth for the foreign-born population - Colombia (%)
Place of birth for the foreign-born population - Ecuador (%)
Place of birth for the foreign-born population - Guyana (%)
Place of birth for the foreign-born population - Peru (%)
Place of birth for the foreign-born population - Uruguay (%)
Place of birth for the foreign-born population - Venezuela (%)
Place of birth for the foreign-born population - Other South America (%)
Place of birth for the foreign-born population - Canada (%)
Place of birth for the foreign-born population - Other Northern America (%)
Place of birth for the foreign-born population - Other (%)
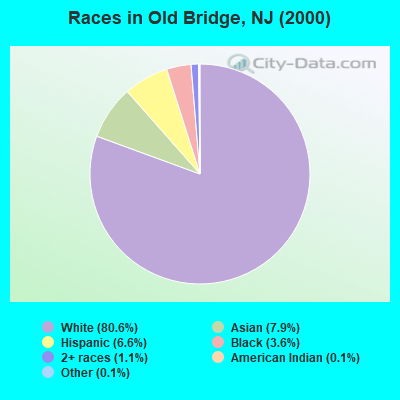
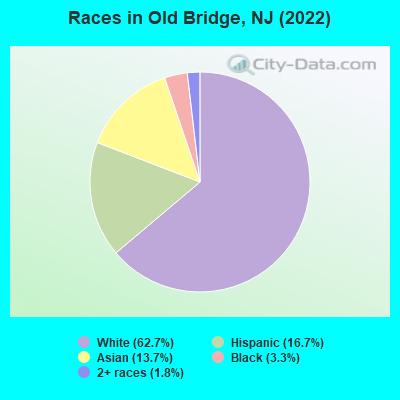
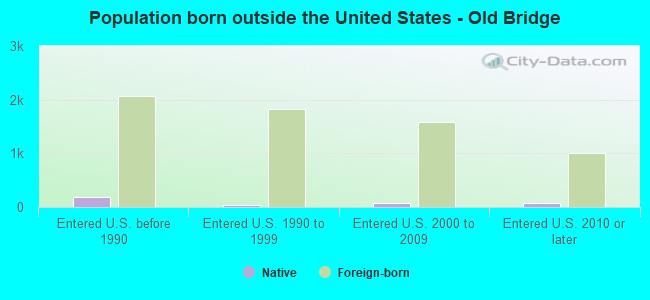
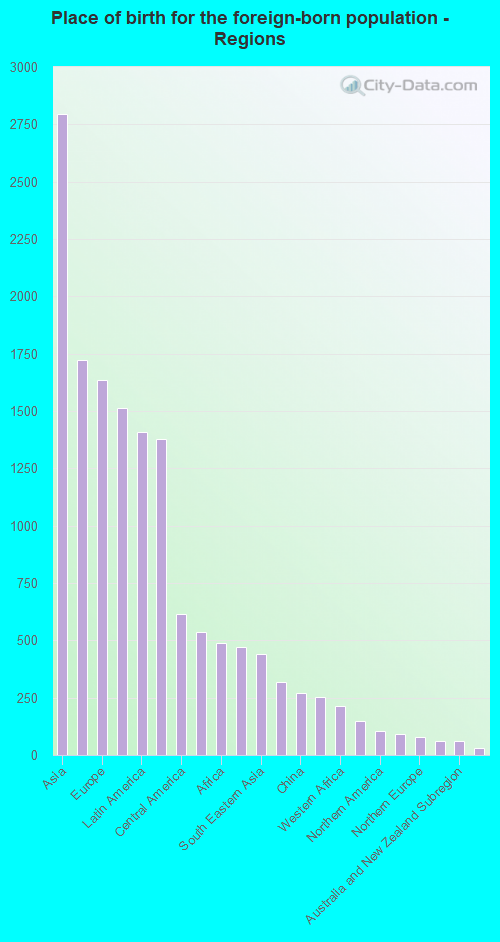
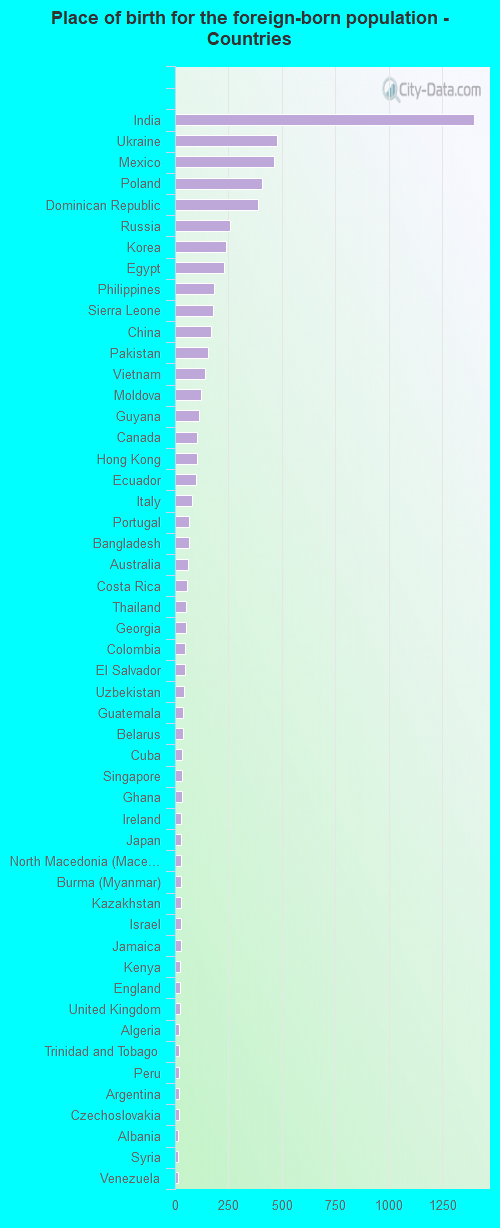
According to 2022 data, the most numerous races in Old Bridge, NJ are White alone (17,632 residents), Hispanic (4,704 residents), and Black alone (937 residents). 71.1% of Old Bridge residents speak English at home. 23.1% of Old Bridge, NJ residents are foreign-born (9.8% born in Asia, 5.7% born in Europe, 4.9% born in Latin America), which is about the same as the foreign-born rate of 23.0% across the entire state of New Jersey.
Race distribution in Old Bridge
2000 2022
5,557,209 66.0% White alone 1,117,191 13.3% Hispanic 1,096,171 13.0% Black alone 477,012 5.7% Asian alone 133,689 1.6% Two or more races 19,565 0.2% Other race alone 11,338 0.1% American Indian alone 2,175 0.03% Native Hawaiian and Other
4,766,476 51.5% White alone 2,028,470 21.9% Hispanic 1,111,632 12.0% Black alone 923,546 10.0% Asian alone 332,237 3.6% Two or more races 89,847 1.0% Other race alone 8,557 0.09% American Indian alone 934 0.01% Native Hawaiian and Other
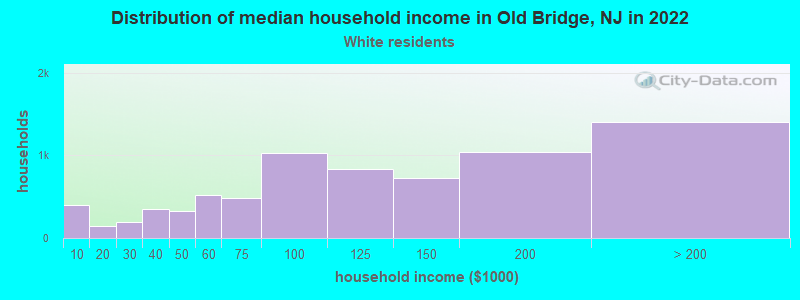
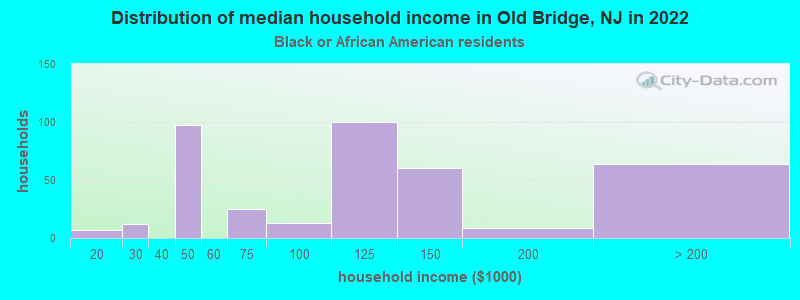
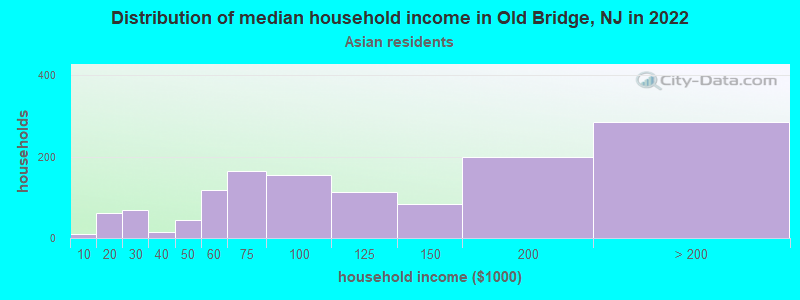
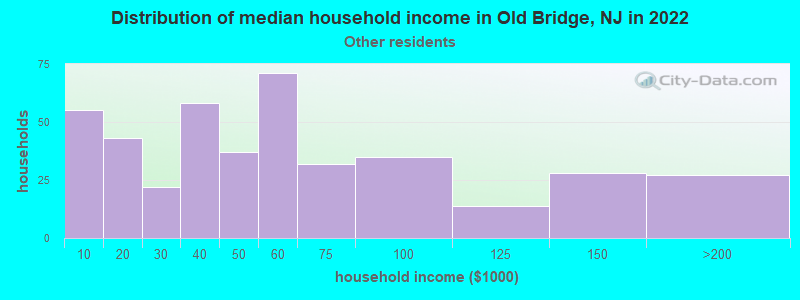
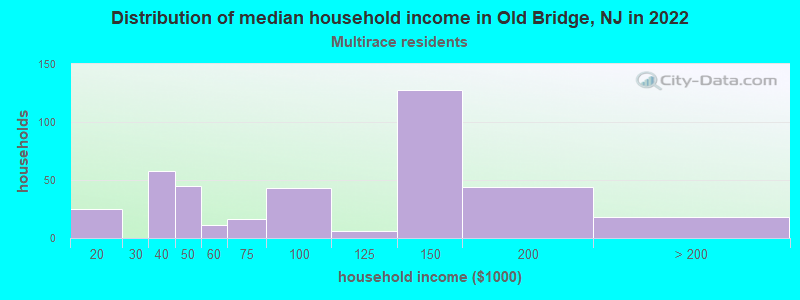
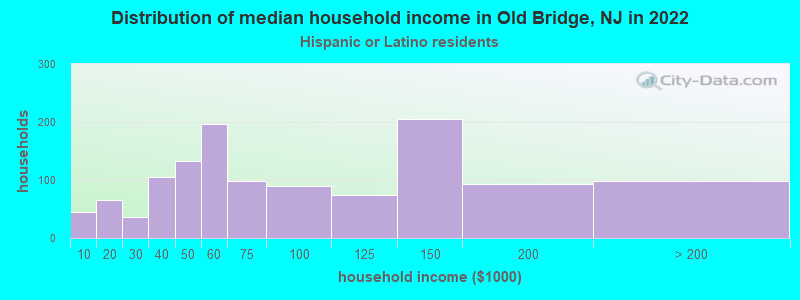
Income and house value in Old Bridge Median household income in 2022 $105,181 White non-Hispanic householders$97,533 Black householders$106,856 Asian householders$44,345 Some other race householders$80,017 Two or more races householders$61,322 Hispanic or Latino race householdersMedian 2022 house value $464,958 White Non-Hispanic householders$455,631 Black or African American householders$754,356 American Indian or Alaska Native householders $561,790 Asian householders$443,836 Some other race householders$456,454 Two or more races householders$454,808 Hispanic or Latino householders
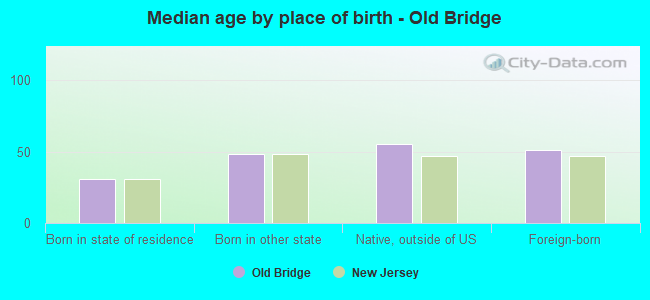
Median age by race in Old Bridge
46.9 Median age for White residents45.7 47.8 30.8 Median age for Black or African American residents32.1 29.7 32.4 Median age for American Indian / Alaska Native residents-624,624,624.0 35.7 52.4 Median age for Asian residents53.7 51.7 -939,393,938.5 Median age for Native Hawaiian / Pacific Islander residents-860,335,194.7 -713,070,378.3 32.7 Median age for Other race residents31.6 37.8 21.3 Median age for Two or more races residents19.6 29.2 47.0 Median age for White alone residents47.0 47.1 26.9 Median age for Hispanic or Latino residents27.7 26.3
Owner/renter occupied households by race in Old Bridge
House owners and renters - White residents 5,970 79.3% Owner occupied1,561 20.7% Renter occupiedHouse owners and renters - Black or African American residents 166 43.0% Owner occupied220 57.0% Renter occupiedHouse owners and renters - American Indian / Alaska Native residents 2 11.4% Owner occupied15 88.6% Renter occupiedHouse owners and renters - Asian residents 1,027 77.6% Owner occupied296 22.4% Renter occupiedHouse owners and renters - Other race residents 184 42.8% Owner occupied246 57.2% Renter occupiedHouse owners and renters - Two or more races residents 247 61.1% Owner occupied157 38.9% Renter occupiedHouse owners and renters - White alone residents 5,943 78.4% Owner occupied1,641 21.6% Renter occupiedHouse owners and renters - Hispanic or Latino residents 706 57.9% Owner occupied513 42.1% Renter occupied
Language usage in Old Bridge
English speakers - Total 71.1% of residents of Old Bridge speak English at home.
9.1% of residents speak Spanish at home 1,141 46.2% Speak English very well1,330 53.8% Speak English less than very well20.1% of residents speak other language at home 3,277 60.4% Speak English very well2,152 39.6% Speak English less than very well
English speakers - Born in the United States 92.2% of residents of Old Bridge speak English at home.
4.2% of residents speak Spanish at home 323 87.5% Speak English very well46 12.5% Speak English less than very well4.4% of residents speak other language at home 376 96.2% Speak English very well15 3.8% Speak English less than very well
English speakers - Native, born elsewhere 35.5% of residents of Old Bridge speak English at home.
56.4% of residents speak Spanish at home 130 58.8% Speak English very well91 41.2% Speak English less than very well8.4% of residents speak other language at home 33 100.0% Speak English very well
English speakers - Foreign-born 17.6% of residents of Old Bridge speak English at home.
18.5% of residents speak Spanish at home 456 36.9% Speak English very well780 63.1% Speak English less than very well63.9% of residents speak other language at home 2,186 51.1% Speak English very well2,091 48.9% Speak English less than very well
White (Caucasian) - Speak only English Native:
97.7% (14,918)Foreign-born:
29.7% (551)
White (Caucasian) - Speak another language Native:
4.9% (743)Foreign-born:
73.4% (1,360)
Black or African American - Speak only English Native:
89.4% (531)Foreign-born:
12.1% (59)
Black or African American - Speak another language Native:
10.2% (61)Foreign-born:
99.9% (484)
American Indian / Alaska Native - Speak only English Native:
34.5% (1)Foreign-born:
87.8% (13)
Asian - Speak only English Native:
56.4% (623)Foreign-born:
15.3% (413)
Asian - Speak another language Native:
43.1% (476)Foreign-born:
85.4% (2,310)
Other race - Speak only English Native:
57.7% (329)Foreign-born:
6.5% (54)
Other race - Speak another language Native:
49.1% (280)Foreign-born:
93.2% (771)
Two or more races - Speak only English Native:
73.1% (1,176)Foreign-born:
17.0% (37)
Two or more races - Speak another language Native:
26.4% (424)Foreign-born:
82.9% (181)
White alone - Speak only English Native:
97.2% (14,613)Foreign-born:
24.3% (536)
White alone - Speak another language Native:
3.5% (531)Foreign-born:
75.9% (1,676)
Hispanic or Latino - Speak only English Native:
59.4% (1,578)Foreign-born:
13.2% (186)
Hispanic or Latino - Speak another language Native:
43.0% (1,142)Foreign-born:
88.8% (1,250)
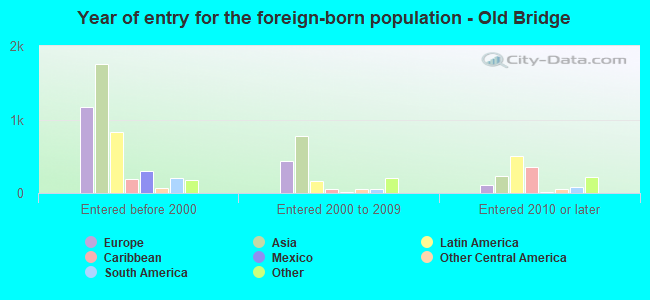
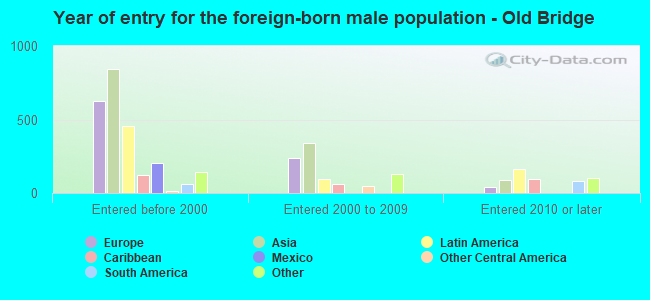
Foreign-born residents in Old Bridge 6,490 residents are foreign born (9.8% Asia , 5.7% Europe , 4.9% Latin America ).
This city:
23.1%New Jersey:
23.2%
Marital status for residents in Old Bridge Marital status - White (Caucasian) population 15 years and over
Males 30.6% Never married60.9% Now married1.0% Separated3.1% Widowed4.5% DivorcedFemales 27.3% Never married52.6% Now married0.9% Separated11.2% Widowed8.1% DivorcedWomen who gave birth in the past 12 months Now married:
100.0% (66)Unmarried:
0.0% (0)
Women who did not give birth in the past 12 months Now married:
47.1% (1,791)Unmarried:
52.9% (2,008)
Marital status - Black or African American population 15 years and over
Males 50.0% Never married49.6% Now married0.0% Separated0.0% Widowed0.4% DivorcedFemales 50.8% Never married38.0% Now married8.4% Separated1.1% Widowed1.8% DivorcedWomen who gave birth in the past 12 months Now married:
100.0% (61)Unmarried:
0.0% (0)
Women who did not give birth in the past 12 months Now married:
20.1% (61)Unmarried:
79.9% (244)
Marital status - American Indian / Alaska Native population 15 years and over
Males 100.0% Never married0.0% Now married0.0% Separated0.0% Widowed0.0% DivorcedFemales 12.5% Never married87.5% Now married0.0% Separated0.0% Widowed0.0% DivorcedWomen who did not give birth in the past 12 months Now married:
100.0% (11)Unmarried:
0.0% (0)
Marital status - Asian population 15 years and over
Males 24.4% Never married71.1% Now married0.0% Separated1.6% Widowed2.9% DivorcedFemales 19.6% Never married65.3% Now married0.6% Separated8.6% Widowed5.9% DivorcedWomen who gave birth in the past 12 months Now married:
100.0% (53)Unmarried:
0.0% (0)
Women who did not give birth in the past 12 months Now married:
50.5% (390)Unmarried:
49.5% (383)
Marital status - Other race population 15 years and over
Males 19.2% Never married72.9% Now married0.0% Separated0.0% Widowed7.9% DivorcedFemales 46.3% Never married31.2% Now married3.6% Separated10.9% Widowed8.0% DivorcedWomen who gave birth in the past 12 months Now married:
100.0% (20)Unmarried:
0.0% (0)
Women who did not give birth in the past 12 months Now married:
14.5% (51)Unmarried:
85.5% (300)
Marital status - Two or more races population 15 years and over
Males 74.5% Never married25.1% Now married0.3% Separated0.0% Widowed0.0% DivorcedFemales 39.1% Never married51.4% Now married0.0% Separated4.8% Widowed4.8% DivorcedWomen who did not give birth in the past 12 months Now married:
43.1% (202)Unmarried:
56.9% (266)
Marital status - White alone, not Hispanic / Latino population 15 years and over
Males 30.6% Never married60.6% Now married0.9% Separated3.3% Widowed4.7% DivorcedFemales 27.0% Never married52.1% Now married1.0% Separated11.7% Widowed8.3% DivorcedWomen who gave birth in the past 12 months Now married:
100.0% (72)Unmarried:
0.0% (0)
Women who did not give birth in the past 12 months Now married:
45.9% (1,863)Unmarried:
54.1% (2,193)
Marital status - Hispanic or Latino population 15 years and over
Males 35.2% Never married60.4% Now married0.8% Separated0.4% Widowed3.3% DivorcedFemales 37.9% Never married46.5% Now married2.8% Separated6.5% Widowed6.3% DivorcedWomen who gave birth in the past 12 months Now married:
100.0% (21)Unmarried:
0.0% (0)
Women who did not give birth in the past 12 months Now married:
41.1% (427)Unmarried:
58.9% (613)
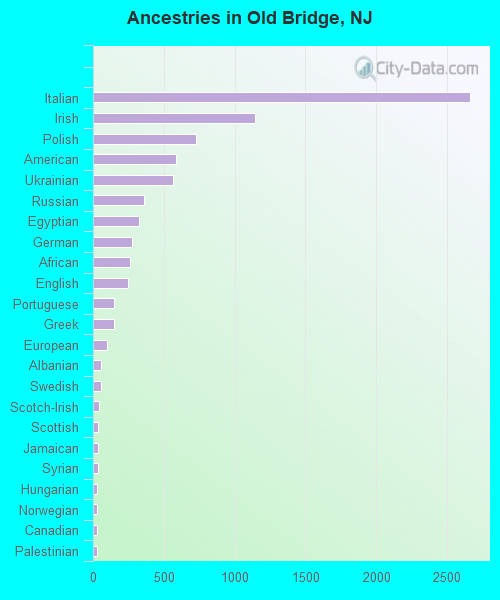
Ancestries in Old Bridge
2,665 19.4% Italian1,147 8.3% Irish727 5.3% Polish590 4.3% American564 4.1% Ukrainian361 2.6% Russian325 2.4% Egyptian275 2.0% German260 1.9% African246 1.8% English146 1.1% Portuguese146 1.1% Greek100 0.7% European57 0.4% Albanian56 0.4% Swedish43 0.3% Scotch-Irish38 0.3% Scottish34 0.2% Jamaican33 0.2% Syrian31 0.2% Hungarian31 0.2% Norwegian30 0.2% Canadian29 0.2% Palestinian24 0.2% Romanian24 0.2% Slovak22 0.2% Israeli20 0.1% Czech15 0.1% Trinidadian and Tobagonian12 0.09% Pennsylvania German11 0.08% Eastern European11 0.08% British West Indian10 0.07% British10 0.07% Guyanese9 0.07% Czechoslovakian9 0.07% Dutch8 0.06% Slavic8 0.06% Kenyan6 0.04% French4 0.03% Danish
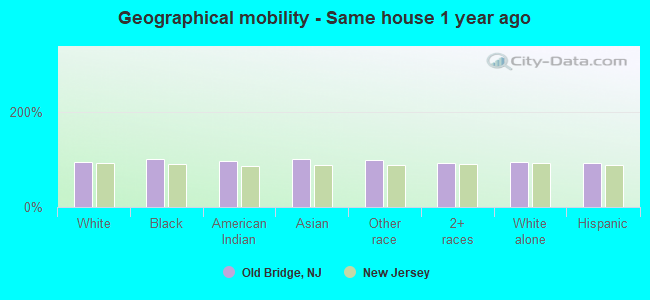
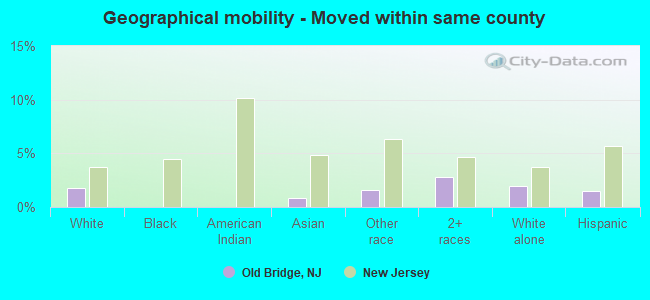
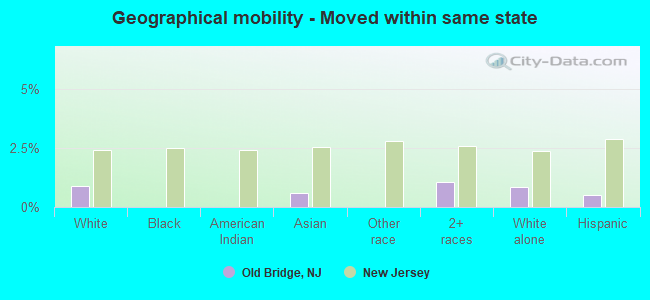
Geographical mobility in Old Bridge Same house 1 year ago 16,612 95.2% White (Caucasian)1,185 100.0% Black or African American20 96.6% American Indian / Alaska Native3,830 99.7% Asian1,383 98.7% Other race1,783 93.4% Two or more races16,740 95.3% White alone, not Hispanic / Latino4,309 93.4% Hispanic or LatinoMoved within same county 305 1.7% White / Caucasian34 0.9% Asian23 1.6% Other race53 2.8% Two or more races347 2.0% White alone, not Hispanic / Latino70 1.5% Hispanic or LatinoMoved within same state 155 0.9% White / Caucasian22 0.6% Asian20 1.1% Two or more races150 0.9% White alone, not Hispanic / Latino24 0.5% Hispanic or LatinoMoved from different state 457 2.6% White / Caucasian37 1.0% Asian33 1.7% Two or more races372 2.1% White alone, not Hispanic / Latino292 6.3% Hispanic or LatinoMoved from abroad 14 0.1% White3 0.1% Asian14 0.1% White alone, not Hispanic / Latino
Children Nativity (place of birth) in Old Bridge
Children under 6 years - Living with two parents Both parents native 606 100.0% NativeBoth parents foreign-born 316 100.0% NativeOne native, one foreign-born parent 118 100.0% NativeChildren under 6 years - Living with one parent Native parent 183 100.0% NativeForeign-born parent 59 100.0% NativeChildren 6 to 17 years - Living with two parents Both parents native 1,747 99.3% Native11 0.7% Foreign-bornBoth parents foreign-born 1,070 92.9% Native82 7.1% Foreign-bornOne native, one foreign-born parent 501 100.0% NativeChildren 6 to 17 years - Living with one parent Native parent 360 100.0% NativeForeign-born parent 146 61.4% Native92 38.6% Foreign-born
Grandparents responsible for own grandchildren in Old Bridge
Grandparents (30 to 59 years) White / Caucasian 9 32.0% Responsible for grandchildren19 68.0% Not responsible for grandchildrenBlack or African American 38 66.1% Responsible for grandchildren19 33.9% Not responsible for grandchildrenAsian 2 100.0% Responsible for grandchildrenWhite alone, not Hispanic / Latino 4 14.3% Responsible for grandchildren22 85.7% Not responsible for grandchildrenHispanic or Latino 11 31.7% Responsible for grandchildren24 68.3% Not responsible for grandchildrenGrandparents (60 years and over) White / Caucasian 26 15.7% Responsible for grandchildren138 84.3% Not responsible for grandchildrenAsian 89 100.0% Not responsible for grandchildrenWhite alone, not Hispanic / Latino 29 15.3% Responsible for grandchildren162 84.7% Not responsible for grandchildrenHispanic or Latino 3 100.0% Responsible for grandchildren