Races in Ocala, Florida (FL) Detailed Stats
Data:
Races - White alone (%)
Races - White alone (% change since 2000)
Races - Black alone (%)
Races - Black alone (% change since 2000)
Races - American Indian alone (%)
Races - American Indian alone (% change since 2000)
Races - Asian alone (%)
Races - Asian alone (% change since 2000)
Races - Hispanic (%)
Races - Hispanic (% change since 2000)
Races - Native Hawaiian and Other Pacific Islander alone (%)
Races - Native Hawaiian and Other Pacific Islander alone (% change since 2000)
Races - Two or more races(%)
Races - Two or more races(% change since 2000)
Races - Other race alone (%)
Races - Other race alone (% change since 2000)
Racial diversity
Place of birth - Born in state of residence (%)
Place of birth - Born in state of residence (%) - White
Place of birth - Born in state of residence (%) - Black or African American
Place of birth - Born in state of residence (%) - Asian
Place of birth - Born in state of residence (%) - Hispanic or Latino
Place of birth - Born in state of residence (%) - American Indian and Alaska Native
Place of birth - Born in state of residence (%) - Multirace
Place of birth - Born in state of residence (%) - Other Race
Place of birth - Born in other state (%)
Place of birth - Born in other state (%) - White
Place of birth - Born in other state (%) - Black or African American
Place of birth - Born in other state (%) - Asian
Place of birth - Born in other state (%) - Hispanic or Latino
Place of birth - Born in other state (%) - American Indian and Alaska Native
Place of birth - Born in other state (%) - Multirace
Place of birth - Born in other state (%) - Other Race
Place of birth - Native, outside of US (%)
Place of birth - Native, outside of US (%) - White
Place of birth - Native, outside of US (%) - Black or African American
Place of birth - Native, outside of US (%) - Asian
Place of birth - Native, outside of US (%) - Hispanic or Latino
Place of birth - Native, outside of US (%) - American Indian and Alaska Native
Place of birth - Native, outside of US (%) - Multirace
Place of birth - Native, outside of US (%) - Other Race
Place of birth - Foreign born (%)
Place of birth - Foreign born (%) - White
Place of birth - Foreign born (%) - Black or African American
Place of birth - Foreign born (%) - Asian
Place of birth - Foreign born (%) - Hispanic or Latino
Place of birth - Foreign born (%) - American Indian and Alaska Native
Place of birth - Foreign born (%) - Multirace
Place of birth - Foreign born (%) - Other Race
Residents speaking English at home (%)
Residents speaking English at home - Born in the United States (%)
Residents speaking English at home - Native, born elsewhere (%)
Residents speaking English at home - Foreign born (%)
Residents speaking Spanish at home (%)
Residents speaking Spanish at home - Born in the United States (%)
Residents speaking Spanish at home - Native, born elsewhere (%)
Residents speaking Spanish at home - Foreign born (%)
Residents speaking other language at home (%)
Residents speaking other language at home - Born in the United States (%)
Residents speaking other language at home - Native, born elsewhere (%)
Residents speaking other language at home - Foreign born (%)
Marital status - Never married (%)
Marital status - Now married (%)
Marital status - Separated (%)
Marital status - Widowed (%)
Marital status - Divorced (%)
Ancestries Reported - Arab (%)
Ancestries Reported - Czech (%)
Ancestries Reported - Danish (%)
Ancestries Reported - Dutch (%)
Ancestries Reported - English (%)
Ancestries Reported - French (%)
Ancestries Reported - French Canadian (%)
Ancestries Reported - German (%)
Ancestries Reported - Greek (%)
Ancestries Reported - Hungarian (%)
Ancestries Reported - Irish (%)
Ancestries Reported - Italian (%)
Ancestries Reported - Lithuanian (%)
Ancestries Reported - Norwegian (%)
Ancestries Reported - Polish (%)
Ancestries Reported - Portuguese (%)
Ancestries Reported - Russian (%)
Ancestries Reported - Scotch-Irish (%)
Ancestries Reported - Scottish (%)
Ancestries Reported - Slovak (%)
Ancestries Reported - Subsaharan African (%)
Ancestries Reported - Swedish (%)
Ancestries Reported - Swiss (%)
Ancestries Reported - Ukrainian (%)
Ancestries Reported - United States (%)
Ancestries Reported - Welsh (%)
Ancestries Reported - West Indian (%)
Ancestries Reported - Other (%)
Geographical mobility - Same house 1 year ago (%)
Geographical mobility - Same house 1 year ago (%) - White
Geographical mobility - Same house 1 year ago (%) - Black or African American
Geographical mobility - Same house 1 year ago (%) - Asian
Geographical mobility - Same house 1 year ago (%) - Hispanic or Latino
Geographical mobility - Same house 1 year ago (%) - American Indian and Alaska Native
Geographical mobility - Same house 1 year ago (%) - Multirace
Geographical mobility - Same house 1 year ago (%) - Other Race
Geographical mobility - Moved within same county (%)
Geographical mobility - Moved within same county (%) - White
Geographical mobility - Moved within same county (%) - Black or African American
Geographical mobility - Moved within same county (%) - Asian
Geographical mobility - Moved within same county (%) - Hispanic or Latino
Geographical mobility - Moved within same county (%) - American Indian and Alaska Native
Geographical mobility - Moved within same county (%) - Multirace
Geographical mobility - Moved within same county (%) - Other Race
Geographical mobility - Moved from different county within same state (%)
Geographical mobility - Moved from different county within same state (%) - White
Geographical mobility - Moved from different county within same state (%) - Black or African American
Geographical mobility - Moved from different county within same state (%) - Asian
Geographical mobility - Moved from different county within same state (%) - Hispanic or Latino
Geographical mobility - Moved from different county within same state (%) - American Indian and Alaska Native
Geographical mobility - Moved from different county within same state (%) - Multirace
Geographical mobility - Moved from different county within same state (%) - Other Race
Geographical mobility - Moved from different state (%)
Geographical mobility - Moved from different state (%) - White
Geographical mobility - Moved from different state (%) - Black or African American
Geographical mobility - Moved from different state (%) - Asian
Geographical mobility - Moved from different state (%) - Hispanic or Latino
Geographical mobility - Moved from different state (%) - American Indian and Alaska Native
Geographical mobility - Moved from different state (%) - Multirace
Geographical mobility - Moved from different state (%) - Other Race
Geographical mobility - Moved from abroad (%)
Geographical mobility - Moved from abroad (%) - White
Geographical mobility - Moved from abroad (%) - Black or African American
Geographical mobility - Moved from abroad (%) - Asian
Geographical mobility - Moved from abroad (%) - Hispanic or Latino
Geographical mobility - Moved from abroad (%) - American Indian and Alaska Native
Geographical mobility - Moved from abroad (%) - Multirace
Geographical mobility - Moved from abroad (%) - Other Race
Place of birth for the foreign-born population - Ireland (%)
Place of birth for the foreign-born population - Denmark (%)
Place of birth for the foreign-born population - Norway (%)
Place of birth for the foreign-born population - Sweden (%)
Place of birth for the foreign-born population - United Kingdom (%)
Place of birth for the foreign-born population - England (%)
Place of birth for the foreign-born population - Scotland (%)
Place of birth for the foreign-born population - Other Northern Europe (%)
Place of birth for the foreign-born population - Austria (%)
Place of birth for the foreign-born population - Belgium (%)
Place of birth for the foreign-born population - France (%)
Place of birth for the foreign-born population - Germany (%)
Place of birth for the foreign-born population - Netherlands (%)
Place of birth for the foreign-born population - Switzerland (%)
Place of birth for the foreign-born population - Other Western Europe (%)
Place of birth for the foreign-born population - Greece (%)
Place of birth for the foreign-born population - Italy (%)
Place of birth for the foreign-born population - Portugal (%)
Place of birth for the foreign-born population - Spain (%)
Place of birth for the foreign-born population - Other Southern Europe (%)
Place of birth for the foreign-born population - Albania (%)
Place of birth for the foreign-born population - Belarus (%)
Place of birth for the foreign-born population - Bosnia and Herzegovina (%)
Place of birth for the foreign-born population - Bulgaria (%)
Place of birth for the foreign-born population - Croatia (%)
Place of birth for the foreign-born population - Czechoslovakia (%)
Place of birth for the foreign-born population - Hungary (%)
Place of birth for the foreign-born population - Latvia (%)
Place of birth for the foreign-born population - Lithuania (%)
Place of birth for the foreign-born population - North Macedonia (Macedonia) (%)
Place of birth for the foreign-born population - Moldova (%)
Place of birth for the foreign-born population - Poland (%)
Place of birth for the foreign-born population - Romania (%)
Place of birth for the foreign-born population - Russia (%)
Place of birth for the foreign-born population - Serbia (%)
Place of birth for the foreign-born population - Ukraine (%)
Place of birth for the foreign-born population - Other Eastern Europe (%)
Place of birth for the foreign-born population - China (%)
Place of birth for the foreign-born population - Hong Kong (%)
Place of birth for the foreign-born population - Taiwan (%)
Place of birth for the foreign-born population - Japan (%)
Place of birth for the foreign-born population - Korea (%)
Place of birth for the foreign-born population - Other Eastern Asia (%)
Place of birth for the foreign-born population - Afghanistan (%)
Place of birth for the foreign-born population - Bangladesh (%)
Place of birth for the foreign-born population - India (%)
Place of birth for the foreign-born population - Iran (%)
Place of birth for the foreign-born population - Kazakhstan (%)
Place of birth for the foreign-born population - Nepal (%)
Place of birth for the foreign-born population - Pakistan (%)
Place of birth for the foreign-born population - Sri Lanka (%)
Place of birth for the foreign-born population - Uzbekistan (%)
Place of birth for the foreign-born population - Other South Central Asia (%)
Place of birth for the foreign-born population - Burma (%)
Place of birth for the foreign-born population - Cambodia (%)
Place of birth for the foreign-born population - Indonesia (%)
Place of birth for the foreign-born population - Laos (%)
Place of birth for the foreign-born population - Malaysia (%)
Place of birth for the foreign-born population - Philippines (%)
Place of birth for the foreign-born population - Singapore (%)
Place of birth for the foreign-born population - Thailand (%)
Place of birth for the foreign-born population - Vietnam (%)
Place of birth for the foreign-born population - Other South Eastern Asia (%)
Place of birth for the foreign-born population - Armenia (%)
Place of birth for the foreign-born population - Iraq (%)
Place of birth for the foreign-born population - Israel (%)
Place of birth for the foreign-born population - Jordan (%)
Place of birth for the foreign-born population - Kuwait (%)
Place of birth for the foreign-born population - Lebanon (%)
Place of birth for the foreign-born population - Saudi Arabia (%)
Place of birth for the foreign-born population - Syria (%)
Place of birth for the foreign-born population - Turkey (%)
Place of birth for the foreign-born population - Yemen (%)
Place of birth for the foreign-born population - Other Western Asia (%)
Place of birth for the foreign-born population - Eritrea (%)
Place of birth for the foreign-born population - Ethiopia (%)
Place of birth for the foreign-born population - Kenya (%)
Place of birth for the foreign-born population - Somalia (%)
Place of birth for the foreign-born population - Uganda (%)
Place of birth for the foreign-born population - Zimbabwe (%)
Place of birth for the foreign-born population - Other Eastern Africa (%)
Place of birth for the foreign-born population - Cameroon (%)
Place of birth for the foreign-born population - Congo (%)
Place of birth for the foreign-born population - Democratic Republic of Congo (Zaire) (%)
Place of birth for the foreign-born population - Other Middle Africa (%)
Place of birth for the foreign-born population - Egypt (%)
Place of birth for the foreign-born population - Morocco (%)
Place of birth for the foreign-born population - Sudan (%)
Place of birth for the foreign-born population - Other Northern Africa (%)
Place of birth for the foreign-born population - South Africa (%)
Place of birth for the foreign-born population - Other Southern Africa (%)
Place of birth for the foreign-born population - Cabo Verde (%)
Place of birth for the foreign-born population - Ghana (%)
Place of birth for the foreign-born population - Liberia (%)
Place of birth for the foreign-born population - Nigeria (%)
Place of birth for the foreign-born population - Senegal (%)
Place of birth for the foreign-born population - Sierra Leone (%)
Place of birth for the foreign-born population - Other Western Africa (%)
Place of birth for the foreign-born population - Australia (%)
Place of birth for the foreign-born population - New Zealand (%)
Place of birth for the foreign-born population - Fiji (%)
Place of birth for the foreign-born population - Micronesia (%)
Place of birth for the foreign-born population - Bahamas (%)
Place of birth for the foreign-born population - Barbados (%)
Place of birth for the foreign-born population - Cuba (%)
Place of birth for the foreign-born population - Dominica (%)
Place of birth for the foreign-born population - Dominican Republic (%)
Place of birth for the foreign-born population - Grenada (%)
Place of birth for the foreign-born population - Haiti (%)
Place of birth for the foreign-born population - Jamaica (%)
Place of birth for the foreign-born population - St. Vincent and the Grenadines (%)
Place of birth for the foreign-born population - Trinidad and Tobago (%)
Place of birth for the foreign-born population - West Indies (%)
Place of birth for the foreign-born population - Other Caribbean (%)
Place of birth for the foreign-born population - Belize (%)
Place of birth for the foreign-born population - Costa Rica (%)
Place of birth for the foreign-born population - El Salvador (%)
Place of birth for the foreign-born population - Guatemala (%)
Place of birth for the foreign-born population - Honduras (%)
Place of birth for the foreign-born population - Mexico (%)
Place of birth for the foreign-born population - Nicaragua (%)
Place of birth for the foreign-born population - Panama (%)
Place of birth for the foreign-born population - Other Central America (%)
Place of birth for the foreign-born population - Argentina (%)
Place of birth for the foreign-born population - Bolivia (%)
Place of birth for the foreign-born population - Brazil (%)
Place of birth for the foreign-born population - Chile (%)
Place of birth for the foreign-born population - Colombia (%)
Place of birth for the foreign-born population - Ecuador (%)
Place of birth for the foreign-born population - Guyana (%)
Place of birth for the foreign-born population - Peru (%)
Place of birth for the foreign-born population - Uruguay (%)
Place of birth for the foreign-born population - Venezuela (%)
Place of birth for the foreign-born population - Other South America (%)
Place of birth for the foreign-born population - Canada (%)
Place of birth for the foreign-born population - Other Northern America (%)
Place of birth for the foreign-born population - Other (%)
Latest news about races in Ocala, FL collected exclusively by city-data.com from local newspapers, TV, and radio stations
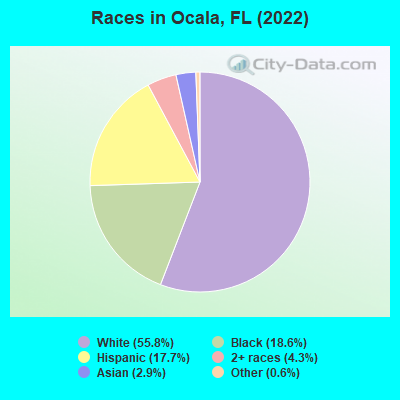
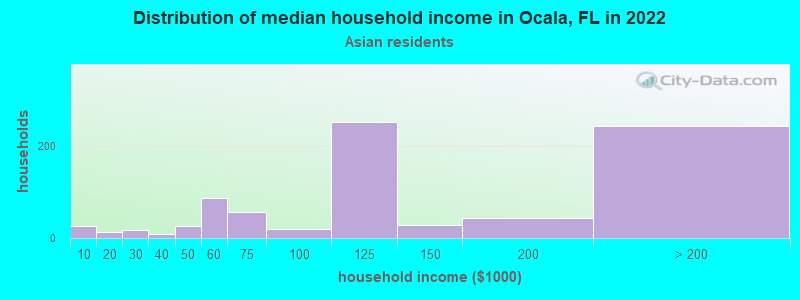
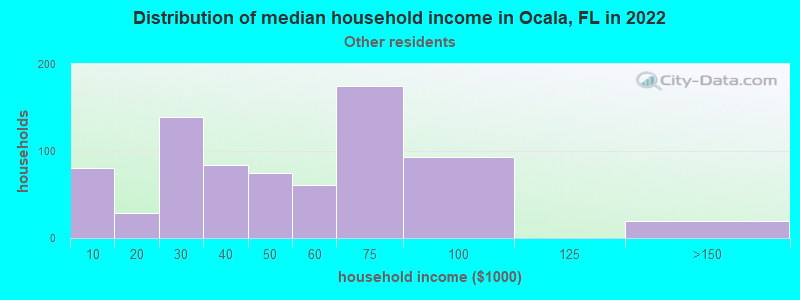
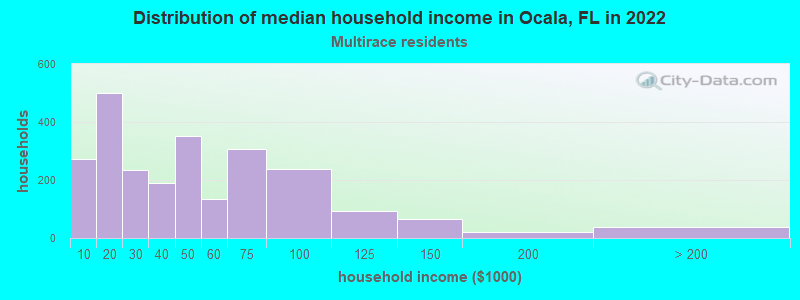
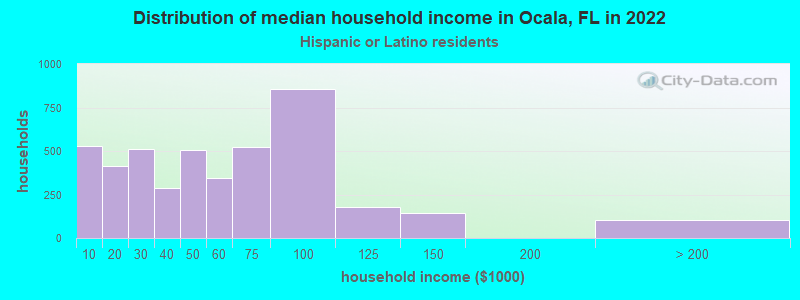
According to 2022 data, the most numerous races in Ocala, FL are White alone (37,149 residents), Hispanic (11,786 residents), and Black alone (12,365 residents). 79.6% of Ocala residents speak English at home. 9.6% of Ocala, FL residents are foreign-born (5.9% born in Latin America, 2.4% born in Asia), which is 118.2% less than the foreign-born rate of 21.0% across the entire state of Florida.
Race distribution in Ocala
2000 2022
10,458,509 65.4% White alone 2,682,715 16.8% Hispanic 2,264,268 14.2% Black alone 261,693 1.6% Asian alone 236,954 1.5% Two or more races 42,358 0.3% American Indian alone 28,994 0.2% Other race alone 6,887 0.04% Native Hawaiian and Other
11,309,403 50.8% White alone 6,025,039 27.1% Hispanic 3,241,015 14.6% Black alone 861,630 3.9% Two or more races 623,692 2.8% Asian alone 152,054 0.7% Other race alone 22,504 0.1% American Indian alone 9,486 0.04% Native Hawaiian and Other
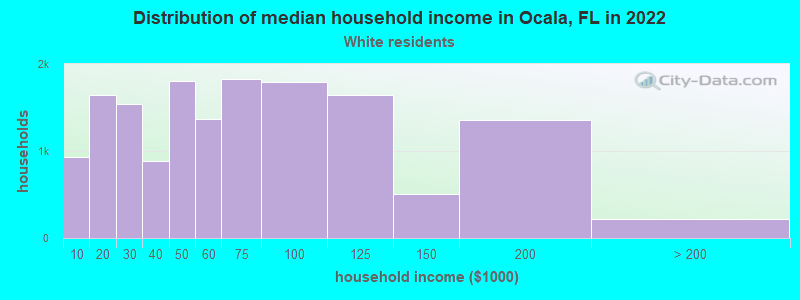
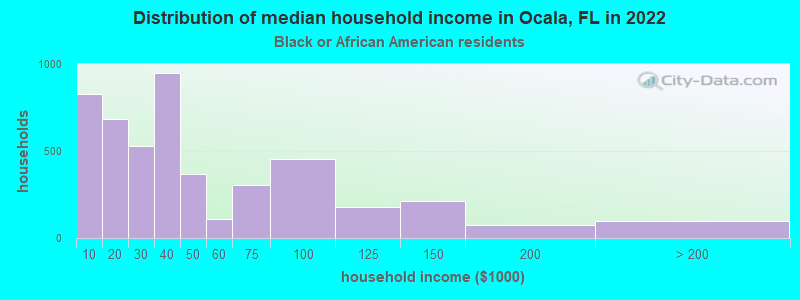
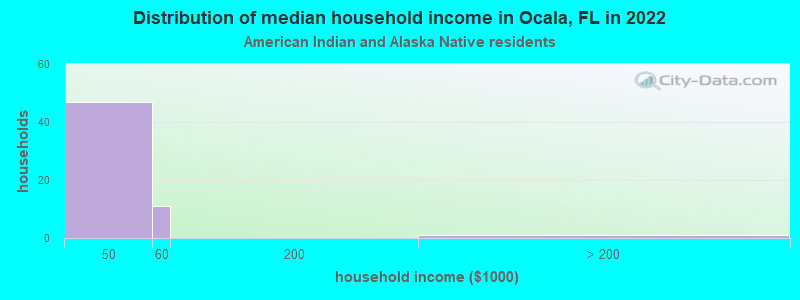
Income and house value in Ocala Median household income in 2022 $58,734 White non-Hispanic householders$30,433 Black householders$107,067 Asian householders$29,343 Some other race householders$38,105 Two or more races householders$37,623 Hispanic or Latino race householdersMedian 2022 house value $330,429 White Non-Hispanic householders$194,838 Black or African American householders$247,722 American Indian or Alaska Native householders $530,039 Asian householders$447,332 Native Hawaiian and other Pacific Islander householders$294,643 Some other race householders$372,578 Two or more races householders$324,862 Hispanic or Latino householders
Median age by race in Ocala
39.3 Median age for White residents39.6 38.6 28.4 Median age for Black or African American residents28.4 29.2 -666,666,666.0 Median age for American Indian / Alaska Native residents-666,666,666.0 -666,666,666.0 35.6 Median age for Asian residents37.5 25.0 -666,666,666.0 Median age for Native Hawaiian / Pacific Islander residents-666,666,666.0 -666,666,666.0 42.6 Median age for Other race residents42.3 48.3 25.1 Median age for Two or more races residents23.4 30.1 39.7 Median age for White alone residents39.9 39.0 32.5 Median age for Hispanic or Latino residents29.6 35.9
Owner/renter occupied households by race in Ocala
House owners and renters - White residents 8,800 56.7% Owner occupied6,723 43.3% Renter occupiedHouse owners and renters - Black or African American residents 867 20.5% Owner occupied3,356 79.5% Renter occupiedHouse owners and renters - American Indian / Alaska Native residents 13 17.0% Owner occupied62 83.0% Renter occupiedHouse owners and renters - Asian residents 446 65.9% Owner occupied231 34.1% Renter occupiedHouse owners and renters - Other race residents 146 13.8% Owner occupied914 86.2% Renter occupiedHouse owners and renters - Two or more races residents 826 31.8% Owner occupied1,771 68.2% Renter occupiedHouse owners and renters - White alone residents 8,566 57.8% Owner occupied6,246 42.2% Renter occupiedHouse owners and renters - Hispanic or Latino residents 1,201 26.0% Owner occupied3,415 74.0% Renter occupied
Language usage in Ocala
English speakers - Total 79.6% of residents of Ocala speak English at home.
16.7% of residents speak Spanish at home 6,353 61.1% Speak English very well4,043 38.9% Speak English less than very well3.7% of residents speak other language at home 1,505 65.2% Speak English very well804 34.8% Speak English less than very well
English speakers - Born in the United States 94.7% of residents of Ocala speak English at home.
5.0% of residents speak Spanish at home 321 27.3% Speak English very well853 72.7% Speak English less than very well0.3% of residents speak other language at home 69 100.0% Speak English very well
English speakers - Native, born elsewhere 10.3% of residents of Ocala speak English at home.
89.7% of residents speak Spanish at home 4,295 67.9% Speak English very well2,029 32.1% Speak English less than very well
English speakers - Foreign-born 19.8% of residents of Ocala speak English at home.
39.6% of residents speak Spanish at home 772 41.9% Speak English very well1,071 58.1% Speak English less than very well40.6% of residents speak other language at home 1,384 73.2% Speak English very well507 26.8% Speak English less than very well
White (Caucasian) - Speak only English Native:
98.9% (34,412)Foreign-born:
39.0% (406)
White (Caucasian) - Speak another language Native:
1.1% (377)Foreign-born:
61.0% (636)
Black or African American - Speak only English Native:
93.5% (10,733)Foreign-born:
53.8% (559)
Black or African American - Speak another language Native:
6.7% (771)Foreign-born:
48.2% (501)
Asian - Speak only English Native:
71.5% (541)Foreign-born:
10.8% (142)
Asian - Speak another language Native:
36.5% (276)Foreign-born:
91.0% (1,191)
Other race - Speak only English Native:
33.9% (851)Foreign-born:
22.3% (134)
Other race - Speak another language Native:
66.3% (1,662)Foreign-born:
68.9% (413)
Two or more races - Speak only English Native:
50.6% (2,902)Foreign-born:
7.0% (98)
Two or more races - Speak another language Native:
49.4% (2,833)Foreign-born:
93.0% (1,299)
White alone - Speak only English Native:
99.5% (34,289)Foreign-born:
60.2% (569)
White alone - Speak another language Native:
0.7% (243)Foreign-born:
39.2% (371)
Hispanic or Latino - Speak only English Native:
19.8% (2,094)Foreign-born:
3.3% (66)
Hispanic or Latino - Speak another language Native:
80.2% (8,475)Foreign-born:
96.7% (1,962)
Foreign-born residents in Ocala 6,406 residents are foreign born (5.9% Latin America , 2.4% Asia ).
This city:
9.6%Florida:
21.1%
Marital status for residents in Ocala Marital status - White (Caucasian) population 15 years and over
Males 30.8% Never married50.0% Now married3.4% Separated3.8% Widowed11.9% DivorcedFemales 30.6% Never married37.0% Now married1.4% Separated10.9% Widowed20.2% DivorcedWomen who gave birth in the past 12 months Now married:
27.6% (79)Unmarried:
72.4% (207)
Women who did not give birth in the past 12 months Now married:
31.2% (2,550)Unmarried:
68.8% (5,617)
Marital status - Black or African American population 15 years and over
Males 47.3% Never married30.0% Now married2.7% Separated5.4% Widowed14.6% DivorcedFemales 64.5% Never married18.5% Now married2.9% Separated4.8% Widowed9.2% DivorcedWomen who gave birth in the past 12 months Now married:
29.3% (29)Unmarried:
70.7% (69)
Women who did not give birth in the past 12 months Now married:
15.3% (496)Unmarried:
84.7% (2,741)
Marital status - American Indian / Alaska Native population 15 years and over
Males 4.8% Never married81.0% Now married0.0% Separated0.0% Widowed14.3% DivorcedFemales 8.3% Never married91.7% Now married0.0% Separated0.0% Widowed0.0% DivorcedWomen who gave birth in the past 12 months Now married:
100.0% (2)Unmarried:
0.0% (0)
Women who did not give birth in the past 12 months Now married:
0.0% (0)Unmarried:
100.0% (2)
Marital status - Asian population 15 years and over
Males 36.3% Never married56.5% Now married0.0% Separated1.7% Widowed5.5% DivorcedFemales 32.5% Never married59.1% Now married0.0% Separated5.3% Widowed3.1% DivorcedWomen who gave birth in the past 12 months Now married:
100.0% (14)Unmarried:
0.0% (0)
Women who did not give birth in the past 12 months Now married:
33.2% (110)Unmarried:
66.8% (220)
Marital status - Other race population 15 years and over
Males 49.5% Never married47.7% Now married0.0% Separated0.0% Widowed2.8% DivorcedFemales 24.0% Never married44.6% Now married2.7% Separated4.1% Widowed24.6% DivorcedWomen who gave birth in the past 12 months Now married:
100.0% (16)Unmarried:
0.0% (0)
Women who did not give birth in the past 12 months Now married:
58.0% (367)Unmarried:
42.0% (265)
Marital status - Two or more races population 15 years and over
Males 55.1% Never married43.0% Now married0.0% Separated1.0% Widowed0.9% DivorcedFemales 37.5% Never married34.5% Now married0.0% Separated21.6% Widowed6.4% DivorcedWomen who gave birth in the past 12 months Now married:
100.0% (109)Unmarried:
0.0% (0)
Women who did not give birth in the past 12 months Now married:
41.4% (904)Unmarried:
58.6% (1,282)
Marital status - White alone, not Hispanic / Latino population 15 years and over
Males 29.9% Never married51.3% Now married3.6% Separated4.0% Widowed11.2% DivorcedFemales 30.3% Never married37.8% Now married1.5% Separated9.9% Widowed20.5% DivorcedWomen who gave birth in the past 12 months Now married:
27.6% (79)Unmarried:
72.4% (207)
Women who did not give birth in the past 12 months Now married:
31.7% (2,521)Unmarried:
68.3% (5,435)
Marital status - Hispanic or Latino population 15 years and over
Males 34.8% Never married60.8% Now married0.0% Separated0.0% Widowed4.4% DivorcedFemales 25.4% Never married39.3% Now married1.0% Separated14.8% Widowed19.4% DivorcedWomen who gave birth in the past 12 months Now married:
48.2% (107)Unmarried:
51.8% (115)
Women who did not give birth in the past 12 months Now married:
47.4% (1,436)Unmarried:
52.6% (1,597)
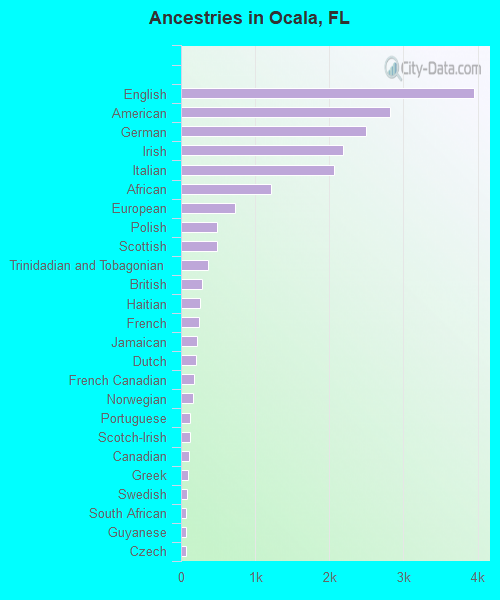
Ancestries in Ocala
3,957 10.6% English2,817 7.6% American2,502 6.7% German2,183 5.9% Irish2,063 5.5% Italian1,220 3.3% African735 2.0% European485 1.3% Polish484 1.3% Scottish361 1.0% Trinidadian and Tobagonian283 0.8% British261 0.7% Haitian248 0.7% French217 0.6% Jamaican196 0.5% Dutch177 0.5% French Canadian157 0.4% Norwegian127 0.3% Portuguese122 0.3% Scotch-Irish105 0.3% Canadian96 0.3% Greek81 0.2% Swedish71 0.2% South African67 0.2% Guyanese66 0.2% Czech63 0.2% Russian62 0.2% Welsh57 0.2% British West Indian48 0.1% Hungarian40 0.1% U.S. Virgin Islander39 0.1% Moroccan36 0.10% Eastern European33 0.09% Lithuanian28 0.08% Afghan23 0.06% Romanian21 0.06% Australian20 0.05% Bahamian17 0.05% Armenian17 0.05% German Russian15 0.04% Czechoslovakian15 0.04% Austrian14 0.04% Turkish12 0.03% Basque12 0.03% Scandinavian12 0.03% Palestinian12 0.03% Egyptian11 0.03% Ukrainian9 0.02% Finnish8 0.02% Slovak5 0.01% Syrian3 0.01% Pennsylvania German
Geographical mobility in Ocala Same house 1 year ago 29,263 78.6% White (Caucasian)12,359 89.9% Black or African American57 47.7% American Indian / Alaska Native1,859 94.1% Asian2,650 85.7% Other race7,412 83.9% Two or more races27,846 77.9% White alone, not Hispanic / Latino12,370 92.4% Hispanic or LatinoMoved within same county 4,486 12.1% White / Caucasian541 3.9% Black or African American41 2.1% Asian310 10.0% Other race719 8.1% Two or more races4,408 12.3% White alone, not Hispanic / Latino464 3.5% Hispanic or LatinoMoved within same state 2,045 5.5% White / Caucasian465 3.4% Black or African American53 44.1% American Indian / Alaska Native32 1.0% Other race135 1.5% Two or more races2,045 5.7% White alone, not Hispanic / Latino140 1.0% Hispanic or LatinoMoved from different state 1,371 3.7% White / Caucasian216 1.6% Black or African American2 2.0% American Indian / Alaska Native91 4.6% Asian4 0.1% Other race298 3.4% Two or more races1,371 3.8% White alone, not Hispanic / Latino143 1.1% Hispanic or LatinoMoved from abroad 63 0.2% White167 1.2% Black or African American147 4.8% Other race141 1.6% Two or more races63 0.2% White alone, not Hispanic / Latino273 2.0% Hispanic or Latino
Children Nativity (place of birth) in Ocala
Children under 6 years - Living with two parents Both parents native 1,890 100.0% NativeBoth parents foreign-born 186 100.0% NativeOne native, one foreign-born parent 132 100.0% NativeChildren under 6 years - Living with one parent Native parent 1,388 100.0% NativeForeign-born parent 243 88.7% Native31 11.3% Foreign-bornChildren 6 to 17 years - Living with two parents Both parents native 4,721 99.9% Native3 0.1% Foreign-bornBoth parents foreign-born 362 51.6% Native339 48.4% Foreign-bornOne native, one foreign-born parent 211 82.1% Native46 17.9% Foreign-bornChildren 6 to 17 years - Living with one parent Native parent 3,835 99.5% Native20 0.5% Foreign-bornForeign-born parent 194 64.3% Native108 35.7% Foreign-born
Grandparents responsible for own grandchildren in Ocala
Grandparents (30 to 59 years) White / Caucasian 9 5.1% Responsible for grandchildren170 94.9% Not responsible for grandchildrenBlack or African American 66 100.0% Responsible for grandchildrenTwo or more races 9 100.0% Not responsible for grandchildrenWhite alone, not Hispanic / Latino 10 6.4% Responsible for grandchildren150 93.6% Not responsible for grandchildrenHispanic or Latino 78 100.0% Not responsible for grandchildrenGrandparents (60 years and over) White / Caucasian 53 22.8% Responsible for grandchildren181 77.2% Not responsible for grandchildrenBlack or African American 2 6.5% Responsible for grandchildren26 93.5% Not responsible for grandchildrenTwo or more races 237 91.2% Responsible for grandchildren23 8.8% Not responsible for grandchildrenWhite alone, not Hispanic / Latino 53 22.2% Responsible for grandchildren188 77.8% Not responsible for grandchildrenHispanic or Latino 134 54.5% Responsible for grandchildren112 45.5% Not responsible for grandchildren