Races in Oak Ridge, Florida (FL) Detailed Stats
Data:
Races - White alone (%)
Races - White alone (% change since 2000)
Races - Black alone (%)
Races - Black alone (% change since 2000)
Races - American Indian alone (%)
Races - American Indian alone (% change since 2000)
Races - Asian alone (%)
Races - Asian alone (% change since 2000)
Races - Hispanic (%)
Races - Hispanic (% change since 2000)
Races - Native Hawaiian and Other Pacific Islander alone (%)
Races - Native Hawaiian and Other Pacific Islander alone (% change since 2000)
Races - Two or more races(%)
Races - Two or more races(% change since 2000)
Races - Other race alone (%)
Races - Other race alone (% change since 2000)
Racial diversity
Place of birth - Born in state of residence (%)
Place of birth - Born in state of residence (%) - White
Place of birth - Born in state of residence (%) - Black or African American
Place of birth - Born in state of residence (%) - Asian
Place of birth - Born in state of residence (%) - Hispanic or Latino
Place of birth - Born in state of residence (%) - American Indian and Alaska Native
Place of birth - Born in state of residence (%) - Multirace
Place of birth - Born in state of residence (%) - Other Race
Place of birth - Born in other state (%)
Place of birth - Born in other state (%) - White
Place of birth - Born in other state (%) - Black or African American
Place of birth - Born in other state (%) - Asian
Place of birth - Born in other state (%) - Hispanic or Latino
Place of birth - Born in other state (%) - American Indian and Alaska Native
Place of birth - Born in other state (%) - Multirace
Place of birth - Born in other state (%) - Other Race
Place of birth - Native, outside of US (%)
Place of birth - Native, outside of US (%) - White
Place of birth - Native, outside of US (%) - Black or African American
Place of birth - Native, outside of US (%) - Asian
Place of birth - Native, outside of US (%) - Hispanic or Latino
Place of birth - Native, outside of US (%) - American Indian and Alaska Native
Place of birth - Native, outside of US (%) - Multirace
Place of birth - Native, outside of US (%) - Other Race
Place of birth - Foreign born (%)
Place of birth - Foreign born (%) - White
Place of birth - Foreign born (%) - Black or African American
Place of birth - Foreign born (%) - Asian
Place of birth - Foreign born (%) - Hispanic or Latino
Place of birth - Foreign born (%) - American Indian and Alaska Native
Place of birth - Foreign born (%) - Multirace
Place of birth - Foreign born (%) - Other Race
Residents speaking English at home (%)
Residents speaking English at home - Born in the United States (%)
Residents speaking English at home - Native, born elsewhere (%)
Residents speaking English at home - Foreign born (%)
Residents speaking Spanish at home (%)
Residents speaking Spanish at home - Born in the United States (%)
Residents speaking Spanish at home - Native, born elsewhere (%)
Residents speaking Spanish at home - Foreign born (%)
Residents speaking other language at home (%)
Residents speaking other language at home - Born in the United States (%)
Residents speaking other language at home - Native, born elsewhere (%)
Residents speaking other language at home - Foreign born (%)
Marital status - Never married (%)
Marital status - Now married (%)
Marital status - Separated (%)
Marital status - Widowed (%)
Marital status - Divorced (%)
Ancestries Reported - Arab (%)
Ancestries Reported - Czech (%)
Ancestries Reported - Danish (%)
Ancestries Reported - Dutch (%)
Ancestries Reported - English (%)
Ancestries Reported - French (%)
Ancestries Reported - French Canadian (%)
Ancestries Reported - German (%)
Ancestries Reported - Greek (%)
Ancestries Reported - Hungarian (%)
Ancestries Reported - Irish (%)
Ancestries Reported - Italian (%)
Ancestries Reported - Lithuanian (%)
Ancestries Reported - Norwegian (%)
Ancestries Reported - Polish (%)
Ancestries Reported - Portuguese (%)
Ancestries Reported - Russian (%)
Ancestries Reported - Scotch-Irish (%)
Ancestries Reported - Scottish (%)
Ancestries Reported - Slovak (%)
Ancestries Reported - Subsaharan African (%)
Ancestries Reported - Swedish (%)
Ancestries Reported - Swiss (%)
Ancestries Reported - Ukrainian (%)
Ancestries Reported - United States (%)
Ancestries Reported - Welsh (%)
Ancestries Reported - West Indian (%)
Ancestries Reported - Other (%)
Geographical mobility - Same house 1 year ago (%)
Geographical mobility - Same house 1 year ago (%) - White
Geographical mobility - Same house 1 year ago (%) - Black or African American
Geographical mobility - Same house 1 year ago (%) - Asian
Geographical mobility - Same house 1 year ago (%) - Hispanic or Latino
Geographical mobility - Same house 1 year ago (%) - American Indian and Alaska Native
Geographical mobility - Same house 1 year ago (%) - Multirace
Geographical mobility - Same house 1 year ago (%) - Other Race
Geographical mobility - Moved within same county (%)
Geographical mobility - Moved within same county (%) - White
Geographical mobility - Moved within same county (%) - Black or African American
Geographical mobility - Moved within same county (%) - Asian
Geographical mobility - Moved within same county (%) - Hispanic or Latino
Geographical mobility - Moved within same county (%) - American Indian and Alaska Native
Geographical mobility - Moved within same county (%) - Multirace
Geographical mobility - Moved within same county (%) - Other Race
Geographical mobility - Moved from different county within same state (%)
Geographical mobility - Moved from different county within same state (%) - White
Geographical mobility - Moved from different county within same state (%) - Black or African American
Geographical mobility - Moved from different county within same state (%) - Asian
Geographical mobility - Moved from different county within same state (%) - Hispanic or Latino
Geographical mobility - Moved from different county within same state (%) - American Indian and Alaska Native
Geographical mobility - Moved from different county within same state (%) - Multirace
Geographical mobility - Moved from different county within same state (%) - Other Race
Geographical mobility - Moved from different state (%)
Geographical mobility - Moved from different state (%) - White
Geographical mobility - Moved from different state (%) - Black or African American
Geographical mobility - Moved from different state (%) - Asian
Geographical mobility - Moved from different state (%) - Hispanic or Latino
Geographical mobility - Moved from different state (%) - American Indian and Alaska Native
Geographical mobility - Moved from different state (%) - Multirace
Geographical mobility - Moved from different state (%) - Other Race
Geographical mobility - Moved from abroad (%)
Geographical mobility - Moved from abroad (%) - White
Geographical mobility - Moved from abroad (%) - Black or African American
Geographical mobility - Moved from abroad (%) - Asian
Geographical mobility - Moved from abroad (%) - Hispanic or Latino
Geographical mobility - Moved from abroad (%) - American Indian and Alaska Native
Geographical mobility - Moved from abroad (%) - Multirace
Geographical mobility - Moved from abroad (%) - Other Race
Place of birth for the foreign-born population - Ireland (%)
Place of birth for the foreign-born population - Denmark (%)
Place of birth for the foreign-born population - Norway (%)
Place of birth for the foreign-born population - Sweden (%)
Place of birth for the foreign-born population - United Kingdom (%)
Place of birth for the foreign-born population - England (%)
Place of birth for the foreign-born population - Scotland (%)
Place of birth for the foreign-born population - Other Northern Europe (%)
Place of birth for the foreign-born population - Austria (%)
Place of birth for the foreign-born population - Belgium (%)
Place of birth for the foreign-born population - France (%)
Place of birth for the foreign-born population - Germany (%)
Place of birth for the foreign-born population - Netherlands (%)
Place of birth for the foreign-born population - Switzerland (%)
Place of birth for the foreign-born population - Other Western Europe (%)
Place of birth for the foreign-born population - Greece (%)
Place of birth for the foreign-born population - Italy (%)
Place of birth for the foreign-born population - Portugal (%)
Place of birth for the foreign-born population - Spain (%)
Place of birth for the foreign-born population - Other Southern Europe (%)
Place of birth for the foreign-born population - Albania (%)
Place of birth for the foreign-born population - Belarus (%)
Place of birth for the foreign-born population - Bosnia and Herzegovina (%)
Place of birth for the foreign-born population - Bulgaria (%)
Place of birth for the foreign-born population - Croatia (%)
Place of birth for the foreign-born population - Czechoslovakia (%)
Place of birth for the foreign-born population - Hungary (%)
Place of birth for the foreign-born population - Latvia (%)
Place of birth for the foreign-born population - Lithuania (%)
Place of birth for the foreign-born population - North Macedonia (Macedonia) (%)
Place of birth for the foreign-born population - Moldova (%)
Place of birth for the foreign-born population - Poland (%)
Place of birth for the foreign-born population - Romania (%)
Place of birth for the foreign-born population - Russia (%)
Place of birth for the foreign-born population - Serbia (%)
Place of birth for the foreign-born population - Ukraine (%)
Place of birth for the foreign-born population - Other Eastern Europe (%)
Place of birth for the foreign-born population - China (%)
Place of birth for the foreign-born population - Hong Kong (%)
Place of birth for the foreign-born population - Taiwan (%)
Place of birth for the foreign-born population - Japan (%)
Place of birth for the foreign-born population - Korea (%)
Place of birth for the foreign-born population - Other Eastern Asia (%)
Place of birth for the foreign-born population - Afghanistan (%)
Place of birth for the foreign-born population - Bangladesh (%)
Place of birth for the foreign-born population - India (%)
Place of birth for the foreign-born population - Iran (%)
Place of birth for the foreign-born population - Kazakhstan (%)
Place of birth for the foreign-born population - Nepal (%)
Place of birth for the foreign-born population - Pakistan (%)
Place of birth for the foreign-born population - Sri Lanka (%)
Place of birth for the foreign-born population - Uzbekistan (%)
Place of birth for the foreign-born population - Other South Central Asia (%)
Place of birth for the foreign-born population - Burma (%)
Place of birth for the foreign-born population - Cambodia (%)
Place of birth for the foreign-born population - Indonesia (%)
Place of birth for the foreign-born population - Laos (%)
Place of birth for the foreign-born population - Malaysia (%)
Place of birth for the foreign-born population - Philippines (%)
Place of birth for the foreign-born population - Singapore (%)
Place of birth for the foreign-born population - Thailand (%)
Place of birth for the foreign-born population - Vietnam (%)
Place of birth for the foreign-born population - Other South Eastern Asia (%)
Place of birth for the foreign-born population - Armenia (%)
Place of birth for the foreign-born population - Iraq (%)
Place of birth for the foreign-born population - Israel (%)
Place of birth for the foreign-born population - Jordan (%)
Place of birth for the foreign-born population - Kuwait (%)
Place of birth for the foreign-born population - Lebanon (%)
Place of birth for the foreign-born population - Saudi Arabia (%)
Place of birth for the foreign-born population - Syria (%)
Place of birth for the foreign-born population - Turkey (%)
Place of birth for the foreign-born population - Yemen (%)
Place of birth for the foreign-born population - Other Western Asia (%)
Place of birth for the foreign-born population - Eritrea (%)
Place of birth for the foreign-born population - Ethiopia (%)
Place of birth for the foreign-born population - Kenya (%)
Place of birth for the foreign-born population - Somalia (%)
Place of birth for the foreign-born population - Uganda (%)
Place of birth for the foreign-born population - Zimbabwe (%)
Place of birth for the foreign-born population - Other Eastern Africa (%)
Place of birth for the foreign-born population - Cameroon (%)
Place of birth for the foreign-born population - Congo (%)
Place of birth for the foreign-born population - Democratic Republic of Congo (Zaire) (%)
Place of birth for the foreign-born population - Other Middle Africa (%)
Place of birth for the foreign-born population - Egypt (%)
Place of birth for the foreign-born population - Morocco (%)
Place of birth for the foreign-born population - Sudan (%)
Place of birth for the foreign-born population - Other Northern Africa (%)
Place of birth for the foreign-born population - South Africa (%)
Place of birth for the foreign-born population - Other Southern Africa (%)
Place of birth for the foreign-born population - Cabo Verde (%)
Place of birth for the foreign-born population - Ghana (%)
Place of birth for the foreign-born population - Liberia (%)
Place of birth for the foreign-born population - Nigeria (%)
Place of birth for the foreign-born population - Senegal (%)
Place of birth for the foreign-born population - Sierra Leone (%)
Place of birth for the foreign-born population - Other Western Africa (%)
Place of birth for the foreign-born population - Australia (%)
Place of birth for the foreign-born population - New Zealand (%)
Place of birth for the foreign-born population - Fiji (%)
Place of birth for the foreign-born population - Micronesia (%)
Place of birth for the foreign-born population - Bahamas (%)
Place of birth for the foreign-born population - Barbados (%)
Place of birth for the foreign-born population - Cuba (%)
Place of birth for the foreign-born population - Dominica (%)
Place of birth for the foreign-born population - Dominican Republic (%)
Place of birth for the foreign-born population - Grenada (%)
Place of birth for the foreign-born population - Haiti (%)
Place of birth for the foreign-born population - Jamaica (%)
Place of birth for the foreign-born population - St. Vincent and the Grenadines (%)
Place of birth for the foreign-born population - Trinidad and Tobago (%)
Place of birth for the foreign-born population - West Indies (%)
Place of birth for the foreign-born population - Other Caribbean (%)
Place of birth for the foreign-born population - Belize (%)
Place of birth for the foreign-born population - Costa Rica (%)
Place of birth for the foreign-born population - El Salvador (%)
Place of birth for the foreign-born population - Guatemala (%)
Place of birth for the foreign-born population - Honduras (%)
Place of birth for the foreign-born population - Mexico (%)
Place of birth for the foreign-born population - Nicaragua (%)
Place of birth for the foreign-born population - Panama (%)
Place of birth for the foreign-born population - Other Central America (%)
Place of birth for the foreign-born population - Argentina (%)
Place of birth for the foreign-born population - Bolivia (%)
Place of birth for the foreign-born population - Brazil (%)
Place of birth for the foreign-born population - Chile (%)
Place of birth for the foreign-born population - Colombia (%)
Place of birth for the foreign-born population - Ecuador (%)
Place of birth for the foreign-born population - Guyana (%)
Place of birth for the foreign-born population - Peru (%)
Place of birth for the foreign-born population - Uruguay (%)
Place of birth for the foreign-born population - Venezuela (%)
Place of birth for the foreign-born population - Other South America (%)
Place of birth for the foreign-born population - Canada (%)
Place of birth for the foreign-born population - Other Northern America (%)
Place of birth for the foreign-born population - Other (%)
Beertopia, Parrish Heritage Days, Art in the Park, Gamble Plantation Open House & more, all this weekend! (2 replies)Irish Celtic Festival, Palmetto Heritage Festival, Festival of the Arts, Paul Anka & Baseball, all this weekend! (0 replies)Indian Community at Lake Mary, FL (Apartments, best school, other data) (1 reply)Red Hot Blues Festival, Block Party, Gamble Plantation, Ballet, Baseball & more, all this weekend! (1 reply)Art Festivals, Italian Festival, Rowing Regatta, Chili Cook Off, Baseball & more, all this weekend! (1 reply)Gingerbread House Festival, Porsches, Jingle Paws, Boat Parades, Trolley Tour & more all this weekend! (0 replies)
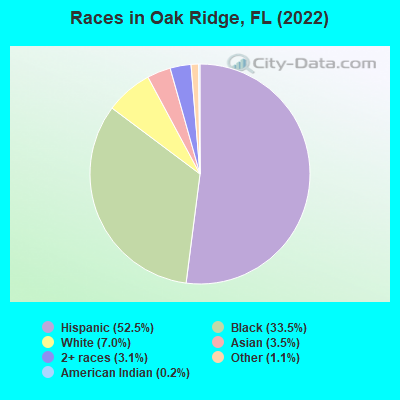
According to 2022 data, the most numerous races in Oak Ridge, FL are White alone (1,746 residents), Hispanic (13,074 residents), and Black alone (8,334 residents). 42.9% of Oak Ridge residents speak English at home. 37.4% of Oak Ridge, FL residents are foreign-born (32.0% born in Latin America), which is 43.9% greater than the foreign-born rate of 21.0% across the entire state of Florida.
Race distribution in Oak Ridge
2000 2022
10,458,509 65.4% White alone 2,682,715 16.8% Hispanic 2,264,268 14.2% Black alone 261,693 1.6% Asian alone 236,954 1.5% Two or more races 42,358 0.3% American Indian alone 28,994 0.2% Other race alone 6,887 0.04% Native Hawaiian and Other
11,309,403 50.8% White alone 6,025,039 27.1% Hispanic 3,241,015 14.6% Black alone 861,630 3.9% Two or more races 623,692 2.8% Asian alone 152,054 0.7% Other race alone 22,504 0.1% American Indian alone 9,486 0.04% Native Hawaiian and Other
Income and house value in Oak Ridge Median household income in 2022 $46,368 White non-Hispanic householders$51,569 Black householders$87,223 Asian householders$52,250 Some other race householders$38,234 Two or more races householders$53,070 Hispanic or Latino race householdersMedian 2022 house value $211,670 White Non-Hispanic householders$246,666 Black or African American householders$190,503 American Indian or Alaska Native householders $236,223 Asian householders$213,363 Some other race householders$258,237 Two or more races householders$226,628 Hispanic or Latino householders
Median age by race in Oak Ridge
37.5 Median age for White residents37.0 41.3 27.0 Median age for Black or African American residents24.8 32.2 11.7 Median age for American Indian / Alaska Native residents35.1 7.4 55.0 Median age for Asian residents53.1 55.2 -679,790,025.6 Median age for Native Hawaiian / Pacific Islander residents-1,327,635,326.3 -611,111,110.5 32.9 Median age for Other race residents34.1 28.5 41.2 Median age for Two or more races residents39.0 44.9 53.9 Median age for White alone residents49.7 59.9 35.6 Median age for Hispanic or Latino residents35.5 36.2
Owner/renter occupied households by race in Oak Ridge
House owners and renters - White residents 767 38.4% Owner occupied1,232 61.6% Renter occupiedHouse owners and renters - Black or African American residents 740 28.5% Owner occupied1,859 71.5% Renter occupiedHouse owners and renters - American Indian / Alaska Native residents 74 100.0% Owner occupiedHouse owners and renters - Asian residents 222 62.0% Owner occupied136 38.0% Renter occupiedHouse owners and renters - Other race residents 521 31.3% Owner occupied1,143 68.7% Renter occupiedHouse owners and renters - Two or more races residents 731 40.3% Owner occupied1,081 59.7% Renter occupiedHouse owners and renters - White alone residents 492 54.2% Owner occupied415 45.8% Renter occupiedHouse owners and renters - Hispanic or Latino residents 1,281 32.6% Owner occupied2,654 67.4% Renter occupied
Language usage in Oak Ridge
English speakers - Total 42.9% of residents of Oak Ridge speak English at home.
43.8% of residents speak Spanish at home 4,314 41.4% Speak English very well6,102 58.6% Speak English less than very well12.9% of residents speak other language at home 1,356 44.3% Speak English very well1,706 55.7% Speak English less than very well
English speakers - Born in the United States 74.1% of residents of Oak Ridge speak English at home.
24.3% of residents speak Spanish at home 1,051 74.8% Speak English very well355 25.2% Speak English less than very well2.4% of residents speak other language at home 141 100.0% Speak English very well
English speakers - Native, born elsewhere 8.8% of residents of Oak Ridge speak English at home.
84.6% of residents speak Spanish at home 1,092 56.4% Speak English very well843 43.6% Speak English less than very well4.3% of residents speak other language at home 52 53.1% Speak English very well46 46.9% Speak English less than very well
English speakers - Foreign-born 12.8% of residents of Oak Ridge speak English at home.
63.5% of residents speak Spanish at home 1,166 19.4% Speak English very well4,831 80.6% Speak English less than very well24.1% of residents speak other language at home 672 29.5% Speak English very well1,605 70.5% Speak English less than very well
White (Caucasian) - Speak only English Native:
62.9% (2,677)Foreign-born:
5.6% (62)
White (Caucasian) - Speak another language Native:
23.5% (999)Foreign-born:
91.6% (1,006)
Black or African American - Speak only English Native:
82.5% (5,114)Foreign-born:
27.0% (573)
Black or African American - Speak another language Native:
18.4% (1,142)Foreign-born:
70.4% (1,494)
American Indian / Alaska Native - Speak only English Native:
82.4% (28)Foreign-born:
33.8% (59)
Asian - Speak only English Native:
45.6% (53)Foreign-born:
37.5% (272)
Asian - Speak another language Native:
51.6% (60)Foreign-born:
63.9% (463)
Other race - Speak only English Native:
15.3% (322)Foreign-born:
1.6% (59)
Other race - Speak another language Native:
82.5% (1,740)Foreign-born:
100.0% (3,739)
Two or more races - Speak only English Native:
32.1% (760)Foreign-born:
13.8% (310)
Two or more races - Speak another language Native:
68.9% (1,632)Foreign-born:
86.1% (1,941)
White alone - Speak only English Native:
91.2% (1,457)Foreign-born:
15.9% (18)
White alone - Speak another language Native:
8.4% (134)Foreign-born:
86.6% (96)
Hispanic or Latino - Speak only English Native:
32.5% (2,103)Foreign-born:
3.0% (180)
Hispanic or Latino - Speak another language Native:
66.8% (4,322)Foreign-born:
97.4% (5,936)
Foreign-born residents in Oak Ridge 9,324 residents are foreign born (32.0% Latin America ).
This city:
37.4%Florida:
21.1%
Marital status for residents in Oak Ridge Marital status - White (Caucasian) population 15 years and over
Males 43.0% Never married36.7% Now married5.6% Separated1.1% Widowed13.6% DivorcedFemales 32.6% Never married33.6% Now married1.6% Separated9.2% Widowed23.0% DivorcedWomen who gave birth in the past 12 months Now married:
72.7% (39)Unmarried:
27.3% (15)
Women who did not give birth in the past 12 months Now married:
20.9% (245)Unmarried:
79.1% (929)
Marital status - Black or African American population 15 years and over
Males 71.1% Never married18.2% Now married4.0% Separated2.9% Widowed3.8% DivorcedFemales 56.7% Never married21.5% Now married6.7% Separated1.0% Widowed14.2% DivorcedWomen who gave birth in the past 12 months Now married:
63.8% (104)Unmarried:
36.2% (59)
Women who did not give birth in the past 12 months Now married:
17.8% (384)Unmarried:
82.2% (1,777)
Marital status - American Indian / Alaska Native population 15 years and over
Males 0.0% Never married73.0% Now married0.0% Separated0.0% Widowed27.0% DivorcedFemales 0.0% Never married44.8% Now married0.0% Separated0.0% Widowed55.2% DivorcedMarital status - Asian population 15 years and over
Males 42.7% Never married57.3% Now married0.0% Separated0.0% Widowed0.0% DivorcedFemales 42.9% Never married41.5% Now married0.0% Separated15.7% Widowed0.0% DivorcedWomen who did not give birth in the past 12 months Now married:
0.0% (0)Unmarried:
100.0% (150)
Marital status - Other race population 15 years and over
Males 57.1% Never married28.3% Now married5.7% Separated2.4% Widowed6.6% DivorcedFemales 49.0% Never married26.2% Now married11.9% Separated6.1% Widowed6.9% DivorcedWomen who gave birth in the past 12 months Now married:
55.0% (15)Unmarried:
45.0% (12)
Women who did not give birth in the past 12 months Now married:
36.9% (585)Unmarried:
63.1% (999)
Marital status - Two or more races population 15 years and over
Males 50.3% Never married31.7% Now married6.5% Separated2.7% Widowed8.8% DivorcedFemales 42.8% Never married26.0% Now married7.6% Separated0.0% Widowed23.6% DivorcedWomen who gave birth in the past 12 months Now married:
0.0% (0)Unmarried:
100.0% (62)
Women who did not give birth in the past 12 months Now married:
32.1% (318)Unmarried:
67.9% (672)
Marital status - White alone, not Hispanic / Latino population 15 years and over
Males 39.5% Never married29.5% Now married1.3% Separated4.6% Widowed25.1% DivorcedFemales 31.2% Never married34.5% Now married4.7% Separated10.9% Widowed18.6% DivorcedWomen who gave birth in the past 12 months Now married:
0.0% (0)Unmarried:
100.0% (17)
Women who did not give birth in the past 12 months Now married:
32.8% (100)Unmarried:
67.2% (205)
Marital status - Hispanic or Latino population 15 years and over
Males 49.3% Never married33.4% Now married6.2% Separated2.5% Widowed8.5% DivorcedFemales 41.6% Never married31.2% Now married3.3% Separated5.6% Widowed18.3% DivorcedWomen who gave birth in the past 12 months Now married:
88.6% (71)Unmarried:
11.4% (9)
Women who did not give birth in the past 12 months Now married:
28.0% (809)Unmarried:
72.0% (2,081)
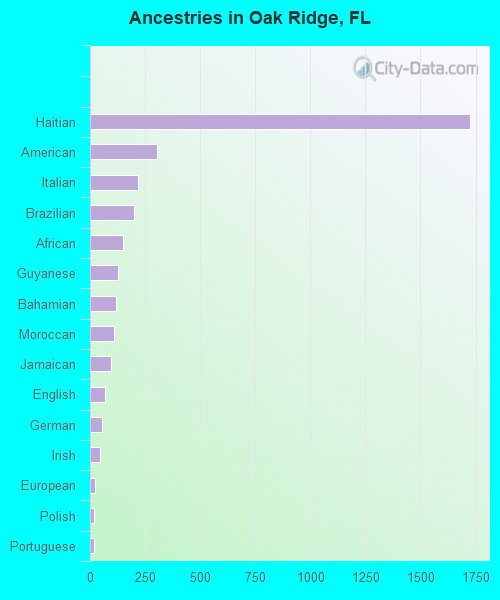
Ancestries in Oak Ridge
1,725 12.2% Haitian303 2.1% American220 1.6% Italian198 1.4% Brazilian152 1.1% African125 0.9% Guyanese118 0.8% Bahamian111 0.8% Moroccan94 0.7% Jamaican67 0.5% English55 0.4% German45 0.3% Irish22 0.2% European18 0.1% Polish17 0.1% Portuguese12 0.08% British West Indian10 0.07% Hungarian
Geographical mobility in Oak Ridge Same house 1 year ago 4,976 86.7% White (Caucasian)7,114 83.3% Black or African American365 100.0% American Indian / Alaska Native810 93.2% Asian5,006 81.3% Other race3,555 75.9% Two or more races1,521 87.1% White alone, not Hispanic / Latino11,016 85.2% Hispanic or LatinoMoved within same county 351 6.1% White / Caucasian764 8.9% Black or African American51 5.9% Asian614 10.0% Other race586 12.5% Two or more races95 5.4% White alone, not Hispanic / Latino864 6.7% Hispanic or LatinoMoved within same state 301 5.2% White / Caucasian403 4.7% Black or African American17 1.9% Asian117 1.9% Other race132 2.8% Two or more races86 4.9% White alone, not Hispanic / Latino419 3.2% Hispanic or LatinoMoved from different state 29 0.5% White / Caucasian544 8.8% Other race191 4.1% Two or more races31 1.8% White alone, not Hispanic / Latino537 4.2% Hispanic or LatinoMoved from abroad 40 0.7% White263 3.1% Black or African American27 0.4% Other race91 1.9% Two or more races7 0.4% White alone, not Hispanic / Latino139 1.1% Hispanic or Latino
Children Nativity (place of birth) in Oak Ridge
Children under 6 years - Living with two parents Both parents native 66 100.0% NativeBoth parents foreign-born 204 96.6% Native7 3.4% Foreign-bornOne native, one foreign-born parent 275 100.0% NativeChildren under 6 years - Living with one parent Native parent 384 95.2% Native19 4.8% Foreign-bornForeign-born parent 208 100.0% NativeChildren 6 to 17 years - Living with two parents Both parents native 25 94.5% Native1 5.5% Foreign-bornBoth parents foreign-born 876 81.8% Native195 18.2% Foreign-bornOne native, one foreign-born parent 454 100.0% NativeChildren 6 to 17 years - Living with one parent Native parent 1,130 100.0% NativeForeign-born parent 1,253 56.9% Native950 43.1% Foreign-born
Grandparents responsible for own grandchildren in Oak Ridge
Grandparents (30 to 59 years) White / Caucasian 115 100.0% Not responsible for grandchildrenBlack or African American 75 76.3% Responsible for grandchildren23 23.7% Not responsible for grandchildrenOther race 88 100.0% Not responsible for grandchildrenHispanic or Latino 302 100.0% Not responsible for grandchildrenGrandparents (60 years and over) White / Caucasian 52 90.3% Responsible for grandchildren6 9.7% Not responsible for grandchildrenBlack or African American 26 20.7% Responsible for grandchildren98 79.3% Not responsible for grandchildrenOther race 24 100.0% Not responsible for grandchildrenHispanic or Latino 232 81.7% Responsible for grandchildren52 18.3% Not responsible for grandchildren