Races in Northeast Leon, Florida (FL) Detailed Stats
Ancestries, Foreign-born residents, place of birth
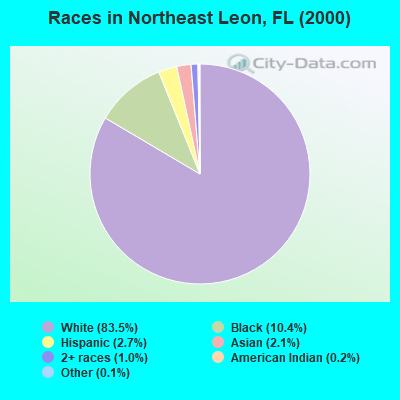
Race distribution in Northeast Leon

- 37,77183.5%White alone
- 4,70510.4%Black alone
- 1,2022.7%Hispanic
- 9632.1%Asian alone
- 4301.0%Two or more races
- 880.2%American Indian alone
- 470.1%Other race alone
- 140.03%Native Hawaiian and Other
Pacific Islander alone
2000
2022
-
- 10,458,50965.4%White alone
- 2,682,71516.8%Hispanic
- 2,264,26814.2%Black alone
- 261,6931.6%Asian alone
- 236,9541.5%Two or more races
- 42,3580.3%American Indian alone
- 28,9940.2%Other race alone
- 6,8870.04%Native Hawaiian and Other
Pacific Islander alone

-
- 11,309,40350.8%White alone
- 6,025,03927.1%Hispanic
- 3,241,01514.6%Black alone
- 861,6303.9%Two or more races
- 623,6922.8%Asian alone
- 152,0540.7%Other race alone
- 22,5040.1%American Indian alone
- 9,4860.04%Native Hawaiian and Other
Pacific Islander alone

Income and house value in Northeast Leon
- Median household income in 2022
- $119,611White non-Hispanic householders
- $85,530Black householders
- $92,223American Indian and Alaska Native householders
- $154,354Asian householders
- $172,923Some other race householders
- $156,240Two or more races householders
- $150,521Hispanic or Latino race householders
- Median 2022 house value
- $415,534White Non-Hispanic householders
- $365,487Black or African American householders
- $70,638American Indian or Alaska Native householders
- $518,489Asian householders
- $536,220Some other race householders
- $316,584Two or more races householders
- $409,243Hispanic or Latino householders
Household income for White non-Hispanic householders

Household income for Black householders

Household income for American Indian and Alaska Native householders

Household income for Asian householders

Household income for Two or more races householders

Household income for Hispanic or Latino race householders

Zip code: 32312