Races in Northampton, Massachusetts (MA) Detailed Stats
Data:
Races - White alone (%)
Races - White alone (% change since 2000)
Races - Black alone (%)
Races - Black alone (% change since 2000)
Races - American Indian alone (%)
Races - American Indian alone (% change since 2000)
Races - Asian alone (%)
Races - Asian alone (% change since 2000)
Races - Hispanic (%)
Races - Hispanic (% change since 2000)
Races - Native Hawaiian and Other Pacific Islander alone (%)
Races - Native Hawaiian and Other Pacific Islander alone (% change since 2000)
Races - Two or more races(%)
Races - Two or more races(% change since 2000)
Races - Other race alone (%)
Races - Other race alone (% change since 2000)
Racial diversity
Place of birth - Born in state of residence (%)
Place of birth - Born in state of residence (%) - White
Place of birth - Born in state of residence (%) - Black or African American
Place of birth - Born in state of residence (%) - Asian
Place of birth - Born in state of residence (%) - Hispanic or Latino
Place of birth - Born in state of residence (%) - American Indian and Alaska Native
Place of birth - Born in state of residence (%) - Multirace
Place of birth - Born in state of residence (%) - Other Race
Place of birth - Born in other state (%)
Place of birth - Born in other state (%) - White
Place of birth - Born in other state (%) - Black or African American
Place of birth - Born in other state (%) - Asian
Place of birth - Born in other state (%) - Hispanic or Latino
Place of birth - Born in other state (%) - American Indian and Alaska Native
Place of birth - Born in other state (%) - Multirace
Place of birth - Born in other state (%) - Other Race
Place of birth - Native, outside of US (%)
Place of birth - Native, outside of US (%) - White
Place of birth - Native, outside of US (%) - Black or African American
Place of birth - Native, outside of US (%) - Asian
Place of birth - Native, outside of US (%) - Hispanic or Latino
Place of birth - Native, outside of US (%) - American Indian and Alaska Native
Place of birth - Native, outside of US (%) - Multirace
Place of birth - Native, outside of US (%) - Other Race
Place of birth - Foreign born (%)
Place of birth - Foreign born (%) - White
Place of birth - Foreign born (%) - Black or African American
Place of birth - Foreign born (%) - Asian
Place of birth - Foreign born (%) - Hispanic or Latino
Place of birth - Foreign born (%) - American Indian and Alaska Native
Place of birth - Foreign born (%) - Multirace
Place of birth - Foreign born (%) - Other Race
Residents speaking English at home (%)
Residents speaking English at home - Born in the United States (%)
Residents speaking English at home - Native, born elsewhere (%)
Residents speaking English at home - Foreign born (%)
Residents speaking Spanish at home (%)
Residents speaking Spanish at home - Born in the United States (%)
Residents speaking Spanish at home - Native, born elsewhere (%)
Residents speaking Spanish at home - Foreign born (%)
Residents speaking other language at home (%)
Residents speaking other language at home - Born in the United States (%)
Residents speaking other language at home - Native, born elsewhere (%)
Residents speaking other language at home - Foreign born (%)
Marital status - Never married (%)
Marital status - Now married (%)
Marital status - Separated (%)
Marital status - Widowed (%)
Marital status - Divorced (%)
Ancestries Reported - Arab (%)
Ancestries Reported - Czech (%)
Ancestries Reported - Danish (%)
Ancestries Reported - Dutch (%)
Ancestries Reported - English (%)
Ancestries Reported - French (%)
Ancestries Reported - French Canadian (%)
Ancestries Reported - German (%)
Ancestries Reported - Greek (%)
Ancestries Reported - Hungarian (%)
Ancestries Reported - Irish (%)
Ancestries Reported - Italian (%)
Ancestries Reported - Lithuanian (%)
Ancestries Reported - Norwegian (%)
Ancestries Reported - Polish (%)
Ancestries Reported - Portuguese (%)
Ancestries Reported - Russian (%)
Ancestries Reported - Scotch-Irish (%)
Ancestries Reported - Scottish (%)
Ancestries Reported - Slovak (%)
Ancestries Reported - Subsaharan African (%)
Ancestries Reported - Swedish (%)
Ancestries Reported - Swiss (%)
Ancestries Reported - Ukrainian (%)
Ancestries Reported - United States (%)
Ancestries Reported - Welsh (%)
Ancestries Reported - West Indian (%)
Ancestries Reported - Other (%)
Geographical mobility - Same house 1 year ago (%)
Geographical mobility - Same house 1 year ago (%) - White
Geographical mobility - Same house 1 year ago (%) - Black or African American
Geographical mobility - Same house 1 year ago (%) - Asian
Geographical mobility - Same house 1 year ago (%) - Hispanic or Latino
Geographical mobility - Same house 1 year ago (%) - American Indian and Alaska Native
Geographical mobility - Same house 1 year ago (%) - Multirace
Geographical mobility - Same house 1 year ago (%) - Other Race
Geographical mobility - Moved within same county (%)
Geographical mobility - Moved within same county (%) - White
Geographical mobility - Moved within same county (%) - Black or African American
Geographical mobility - Moved within same county (%) - Asian
Geographical mobility - Moved within same county (%) - Hispanic or Latino
Geographical mobility - Moved within same county (%) - American Indian and Alaska Native
Geographical mobility - Moved within same county (%) - Multirace
Geographical mobility - Moved within same county (%) - Other Race
Geographical mobility - Moved from different county within same state (%)
Geographical mobility - Moved from different county within same state (%) - White
Geographical mobility - Moved from different county within same state (%) - Black or African American
Geographical mobility - Moved from different county within same state (%) - Asian
Geographical mobility - Moved from different county within same state (%) - Hispanic or Latino
Geographical mobility - Moved from different county within same state (%) - American Indian and Alaska Native
Geographical mobility - Moved from different county within same state (%) - Multirace
Geographical mobility - Moved from different county within same state (%) - Other Race
Geographical mobility - Moved from different state (%)
Geographical mobility - Moved from different state (%) - White
Geographical mobility - Moved from different state (%) - Black or African American
Geographical mobility - Moved from different state (%) - Asian
Geographical mobility - Moved from different state (%) - Hispanic or Latino
Geographical mobility - Moved from different state (%) - American Indian and Alaska Native
Geographical mobility - Moved from different state (%) - Multirace
Geographical mobility - Moved from different state (%) - Other Race
Geographical mobility - Moved from abroad (%)
Geographical mobility - Moved from abroad (%) - White
Geographical mobility - Moved from abroad (%) - Black or African American
Geographical mobility - Moved from abroad (%) - Asian
Geographical mobility - Moved from abroad (%) - Hispanic or Latino
Geographical mobility - Moved from abroad (%) - American Indian and Alaska Native
Geographical mobility - Moved from abroad (%) - Multirace
Geographical mobility - Moved from abroad (%) - Other Race
Place of birth for the foreign-born population - Ireland (%)
Place of birth for the foreign-born population - Denmark (%)
Place of birth for the foreign-born population - Norway (%)
Place of birth for the foreign-born population - Sweden (%)
Place of birth for the foreign-born population - United Kingdom (%)
Place of birth for the foreign-born population - England (%)
Place of birth for the foreign-born population - Scotland (%)
Place of birth for the foreign-born population - Other Northern Europe (%)
Place of birth for the foreign-born population - Austria (%)
Place of birth for the foreign-born population - Belgium (%)
Place of birth for the foreign-born population - France (%)
Place of birth for the foreign-born population - Germany (%)
Place of birth for the foreign-born population - Netherlands (%)
Place of birth for the foreign-born population - Switzerland (%)
Place of birth for the foreign-born population - Other Western Europe (%)
Place of birth for the foreign-born population - Greece (%)
Place of birth for the foreign-born population - Italy (%)
Place of birth for the foreign-born population - Portugal (%)
Place of birth for the foreign-born population - Spain (%)
Place of birth for the foreign-born population - Other Southern Europe (%)
Place of birth for the foreign-born population - Albania (%)
Place of birth for the foreign-born population - Belarus (%)
Place of birth for the foreign-born population - Bosnia and Herzegovina (%)
Place of birth for the foreign-born population - Bulgaria (%)
Place of birth for the foreign-born population - Croatia (%)
Place of birth for the foreign-born population - Czechoslovakia (%)
Place of birth for the foreign-born population - Hungary (%)
Place of birth for the foreign-born population - Latvia (%)
Place of birth for the foreign-born population - Lithuania (%)
Place of birth for the foreign-born population - North Macedonia (Macedonia) (%)
Place of birth for the foreign-born population - Moldova (%)
Place of birth for the foreign-born population - Poland (%)
Place of birth for the foreign-born population - Romania (%)
Place of birth for the foreign-born population - Russia (%)
Place of birth for the foreign-born population - Serbia (%)
Place of birth for the foreign-born population - Ukraine (%)
Place of birth for the foreign-born population - Other Eastern Europe (%)
Place of birth for the foreign-born population - China (%)
Place of birth for the foreign-born population - Hong Kong (%)
Place of birth for the foreign-born population - Taiwan (%)
Place of birth for the foreign-born population - Japan (%)
Place of birth for the foreign-born population - Korea (%)
Place of birth for the foreign-born population - Other Eastern Asia (%)
Place of birth for the foreign-born population - Afghanistan (%)
Place of birth for the foreign-born population - Bangladesh (%)
Place of birth for the foreign-born population - India (%)
Place of birth for the foreign-born population - Iran (%)
Place of birth for the foreign-born population - Kazakhstan (%)
Place of birth for the foreign-born population - Nepal (%)
Place of birth for the foreign-born population - Pakistan (%)
Place of birth for the foreign-born population - Sri Lanka (%)
Place of birth for the foreign-born population - Uzbekistan (%)
Place of birth for the foreign-born population - Other South Central Asia (%)
Place of birth for the foreign-born population - Burma (%)
Place of birth for the foreign-born population - Cambodia (%)
Place of birth for the foreign-born population - Indonesia (%)
Place of birth for the foreign-born population - Laos (%)
Place of birth for the foreign-born population - Malaysia (%)
Place of birth for the foreign-born population - Philippines (%)
Place of birth for the foreign-born population - Singapore (%)
Place of birth for the foreign-born population - Thailand (%)
Place of birth for the foreign-born population - Vietnam (%)
Place of birth for the foreign-born population - Other South Eastern Asia (%)
Place of birth for the foreign-born population - Armenia (%)
Place of birth for the foreign-born population - Iraq (%)
Place of birth for the foreign-born population - Israel (%)
Place of birth for the foreign-born population - Jordan (%)
Place of birth for the foreign-born population - Kuwait (%)
Place of birth for the foreign-born population - Lebanon (%)
Place of birth for the foreign-born population - Saudi Arabia (%)
Place of birth for the foreign-born population - Syria (%)
Place of birth for the foreign-born population - Turkey (%)
Place of birth for the foreign-born population - Yemen (%)
Place of birth for the foreign-born population - Other Western Asia (%)
Place of birth for the foreign-born population - Eritrea (%)
Place of birth for the foreign-born population - Ethiopia (%)
Place of birth for the foreign-born population - Kenya (%)
Place of birth for the foreign-born population - Somalia (%)
Place of birth for the foreign-born population - Uganda (%)
Place of birth for the foreign-born population - Zimbabwe (%)
Place of birth for the foreign-born population - Other Eastern Africa (%)
Place of birth for the foreign-born population - Cameroon (%)
Place of birth for the foreign-born population - Congo (%)
Place of birth for the foreign-born population - Democratic Republic of Congo (Zaire) (%)
Place of birth for the foreign-born population - Other Middle Africa (%)
Place of birth for the foreign-born population - Egypt (%)
Place of birth for the foreign-born population - Morocco (%)
Place of birth for the foreign-born population - Sudan (%)
Place of birth for the foreign-born population - Other Northern Africa (%)
Place of birth for the foreign-born population - South Africa (%)
Place of birth for the foreign-born population - Other Southern Africa (%)
Place of birth for the foreign-born population - Cabo Verde (%)
Place of birth for the foreign-born population - Ghana (%)
Place of birth for the foreign-born population - Liberia (%)
Place of birth for the foreign-born population - Nigeria (%)
Place of birth for the foreign-born population - Senegal (%)
Place of birth for the foreign-born population - Sierra Leone (%)
Place of birth for the foreign-born population - Other Western Africa (%)
Place of birth for the foreign-born population - Australia (%)
Place of birth for the foreign-born population - New Zealand (%)
Place of birth for the foreign-born population - Fiji (%)
Place of birth for the foreign-born population - Micronesia (%)
Place of birth for the foreign-born population - Bahamas (%)
Place of birth for the foreign-born population - Barbados (%)
Place of birth for the foreign-born population - Cuba (%)
Place of birth for the foreign-born population - Dominica (%)
Place of birth for the foreign-born population - Dominican Republic (%)
Place of birth for the foreign-born population - Grenada (%)
Place of birth for the foreign-born population - Haiti (%)
Place of birth for the foreign-born population - Jamaica (%)
Place of birth for the foreign-born population - St. Vincent and the Grenadines (%)
Place of birth for the foreign-born population - Trinidad and Tobago (%)
Place of birth for the foreign-born population - West Indies (%)
Place of birth for the foreign-born population - Other Caribbean (%)
Place of birth for the foreign-born population - Belize (%)
Place of birth for the foreign-born population - Costa Rica (%)
Place of birth for the foreign-born population - El Salvador (%)
Place of birth for the foreign-born population - Guatemala (%)
Place of birth for the foreign-born population - Honduras (%)
Place of birth for the foreign-born population - Mexico (%)
Place of birth for the foreign-born population - Nicaragua (%)
Place of birth for the foreign-born population - Panama (%)
Place of birth for the foreign-born population - Other Central America (%)
Place of birth for the foreign-born population - Argentina (%)
Place of birth for the foreign-born population - Bolivia (%)
Place of birth for the foreign-born population - Brazil (%)
Place of birth for the foreign-born population - Chile (%)
Place of birth for the foreign-born population - Colombia (%)
Place of birth for the foreign-born population - Ecuador (%)
Place of birth for the foreign-born population - Guyana (%)
Place of birth for the foreign-born population - Peru (%)
Place of birth for the foreign-born population - Uruguay (%)
Place of birth for the foreign-born population - Venezuela (%)
Place of birth for the foreign-born population - Other South America (%)
Place of birth for the foreign-born population - Canada (%)
Place of birth for the foreign-born population - Other Northern America (%)
Place of birth for the foreign-born population - Other (%)
Latest news about races in Northampton, MA collected exclusively by city-data.com from local newspapers, TV, and radio stations
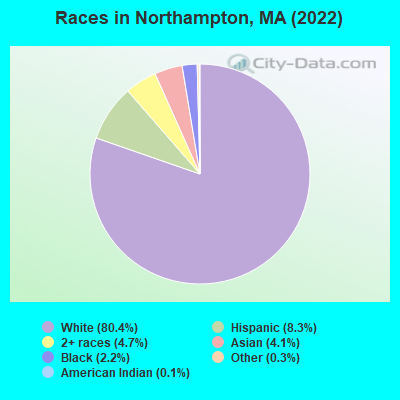
According to 2022 data, the most numerous races in Northampton, MA are White alone (23,994 residents), Hispanic (2,482 residents), and Asian alone (1,231 residents). 87.1% of Northampton residents speak English at home. 9.0% of Northampton, MA residents are foreign-born (2.8% born in Asia, 2.8% born in Latin America, 2.7% born in Europe), which is 101.0% less than the foreign-born rate of 18.0% across the entire state of Massachusetts.
Race distribution in Northampton
2000 2022
5,198,359 81.9% White alone 428,729 6.8% Hispanic 318,329 5.0% Black alone 236,786 3.7% Asian alone 110,338 1.7% Two or more races 43,586 0.7% Other race alone 11,264 0.2% American Indian alone 1,706 0.03% Native Hawaiian and Other
4,676,627 67.0% White alone 911,038 13.0% Hispanic 501,463 7.2% Asian alone 459,740 6.6% Black alone 341,889 4.9% Two or more races 84,403 1.2% Other race alone 5,838 0.08% American Indian alone 976 0.01% Native Hawaiian and Other
Income and house value in Northampton Median household income in 2022 $84,883 White non-Hispanic householders$60,167 American Indian and Alaska Native householders$92,901 Asian householders$35,987 Some other race householders$56,106 Two or more races householders$42,303 Hispanic or Latino race householdersMedian 2022 house value $409,279 White Non-Hispanic householders$740,560 Black or African American householders $460,900 Asian householders$423,177 Some other race householders$345,178 Two or more races householders$421,759 Hispanic or Latino householders
Median age by race in Northampton
43.4 Median age for White residents45.6 42.0 52.7 Median age for Black or African American residents44.2 20.9 74.8 Median age for American Indian / Alaska Native residents-606,870,228.4 37.5 23.6 Median age for Asian residents54.0 21.7 -514,227,641.8 Median age for Native Hawaiian / Pacific Islander residents-666,666,666.0 -508,717,948.2 37.4 Median age for Other race residents25.8 48.5 22.4 Median age for Two or more races residents25.0 22.3 44.7 Median age for White alone residents46.4 42.8 33.9 Median age for Hispanic or Latino residents33.0 35.8
Owner/renter occupied households by race in Northampton
House owners and renters - White residents 6,475 60.8% Owner occupied4,173 39.2% Renter occupiedHouse owners and renters - Black or African American residents 42 21.8% Owner occupied151 78.2% Renter occupiedHouse owners and renters - American Indian / Alaska Native residents 8 35.4% Owner occupied15 64.6% Renter occupiedHouse owners and renters - Asian residents 111 29.0% Owner occupied270 71.0% Renter occupiedHouse owners and renters - Other race residents 172 44.4% Owner occupied216 55.6% Renter occupiedHouse owners and renters - Two or more races residents 271 31.1% Owner occupied599 68.9% Renter occupiedHouse owners and renters - White alone residents 6,351 61.3% Owner occupied4,012 38.7% Renter occupiedHouse owners and renters - Hispanic or Latino residents 359 32.7% Owner occupied740 67.3% Renter occupied
Language usage in Northampton
English speakers - Total 87.1% of residents of Northampton speak English at home.
6.5% of residents speak Spanish at home 1,223 65.5% Speak English very well644 34.5% Speak English less than very well6.2% of residents speak other language at home 1,162 64.8% Speak English very well632 35.2% Speak English less than very well
English speakers - Born in the United States 92.9% of residents of Northampton speak English at home.
4.1% of residents speak Spanish at home 449 100.0% Speak English very well3.6% of residents speak other language at home 268 68.2% Speak English very well125 31.8% Speak English less than very well
English speakers - Native, born elsewhere 56.6% of residents of Northampton speak English at home.
40.8% of residents speak Spanish at home 186 63.5% Speak English very well107 36.5% Speak English less than very well6.1% of residents speak other language at home 44 100.0% Speak English very well
English speakers - Foreign-born 28.9% of residents of Northampton speak English at home.
28.2% of residents speak Spanish at home 323 40.5% Speak English very well475 59.5% Speak English less than very well42.6% of residents speak other language at home 717 59.4% Speak English very well490 40.6% Speak English less than very well
White (Caucasian) - Speak only English Native:
95.9% (22,233)Foreign-born:
40.8% (421)
White (Caucasian) - Speak another language Native:
3.9% (901)Foreign-born:
59.4% (613)
Black or African American - Speak only English Native:
93.1% (460)Foreign-born:
33.4% (32)
Black or African American - Speak another language Native:
7.6% (38)Foreign-born:
66.7% (63)
Asian - Speak only English Native:
65.1% (241)Foreign-born:
17.0% (143)
Asian - Speak another language Native:
40.9% (151)Foreign-born:
82.9% (695)
Other race - Speak only English Native:
17.3% (86)Foreign-born:
12.6% (79)
Other race - Speak another language Native:
90.7% (449)Foreign-born:
88.4% (557)
Two or more races - Speak only English Native:
95.8% (1,300)Foreign-born:
39.8% (84)
Two or more races - Speak another language Native:
7.4% (101)Foreign-born:
66.3% (140)
White alone - Speak only English Native:
96.5% (21,862)Foreign-born:
51.6% (447)
White alone - Speak another language Native:
3.5% (793)Foreign-born:
48.7% (422)
Hispanic or Latino - Speak only English Native:
44.7% (629)Foreign-born:
4.3% (36)
Hispanic or Latino - Speak another language Native:
48.4% (681)Foreign-born:
97.6% (826)
Foreign-born residents in Northampton 2,671 residents are foreign born (2.8% Asia , 2.8% Latin America , 2.7% Europe ).
This city:
9.0%Massachusetts:
17.6%
Marital status for residents in Northampton Marital status - White (Caucasian) population 15 years and over
Males 36.2% Never married49.6% Now married0.7% Separated2.3% Widowed11.3% DivorcedFemales 38.6% Never married35.8% Now married2.2% Separated8.1% Widowed15.3% DivorcedWomen who gave birth in the past 12 months Now married:
100.0% (170)Unmarried:
0.0% (0)
Women who did not give birth in the past 12 months Now married:
27.9% (1,996)Unmarried:
72.1% (5,158)
Marital status - Black or African American population 15 years and over
Males 51.9% Never married22.4% Now married5.5% Separated0.0% Widowed20.1% DivorcedFemales 75.9% Never married7.2% Now married0.0% Separated5.6% Widowed11.3% DivorcedWomen who did not give birth in the past 12 months Now married:
6.0% (9)Unmarried:
94.0% (140)
Marital status - American Indian / Alaska Native population 15 years and over
Males 0.0% Never married100.0% Now married0.0% Separated0.0% Widowed0.0% DivorcedFemales 11.1% Never married50.0% Now married0.0% Separated13.9% Widowed25.0% DivorcedWomen who did not give birth in the past 12 months Now married:
75.0% (14)Unmarried:
25.0% (5)
Marital status - Asian population 15 years and over
Males 29.1% Never married64.3% Now married0.0% Separated0.0% Widowed6.5% DivorcedFemales 74.3% Never married24.3% Now married0.0% Separated0.0% Widowed1.4% DivorcedWomen who did not give birth in the past 12 months Now married:
12.0% (84)Unmarried:
88.0% (619)
Marital status - Other race population 15 years and over
Males 35.0% Never married60.5% Now married0.0% Separated0.2% Widowed4.3% DivorcedFemales 35.0% Never married45.4% Now married0.0% Separated5.1% Widowed14.5% DivorcedWomen who gave birth in the past 12 months Now married:
66.7% (19)Unmarried:
33.3% (10)
Women who did not give birth in the past 12 months Now married:
49.1% (128)Unmarried:
50.9% (133)
Marital status - Two or more races population 15 years and over
Males 68.4% Never married29.7% Now married0.0% Separated1.9% Widowed0.0% DivorcedFemales 67.4% Never married24.9% Now married0.0% Separated0.7% Widowed7.0% DivorcedWomen who gave birth in the past 12 months Now married:
88.2% (20)Unmarried:
11.8% (3)
Women who did not give birth in the past 12 months Now married:
14.5% (81)Unmarried:
85.5% (475)
Marital status - White alone, not Hispanic / Latino population 15 years and over
Males 35.3% Never married50.1% Now married0.7% Separated2.3% Widowed11.5% DivorcedFemales 37.7% Never married36.5% Now married2.0% Separated8.4% Widowed15.4% DivorcedWomen who gave birth in the past 12 months Now married:
100.0% (158)Unmarried:
0.0% (0)
Women who did not give birth in the past 12 months Now married:
28.3% (1,930)Unmarried:
71.7% (4,883)
Marital status - Hispanic or Latino population 15 years and over
Males 48.0% Never married48.5% Now married0.0% Separated0.1% Widowed3.4% DivorcedFemales 55.6% Never married28.7% Now married3.7% Separated1.8% Widowed10.2% DivorcedWomen who gave birth in the past 12 months Now married:
44.8% (13)Unmarried:
55.2% (16)
Women who did not give birth in the past 12 months Now married:
28.2% (212)Unmarried:
71.8% (541)
Ancestries in Northampton
1,355 12.2% English1,208 10.9% Irish662 5.9% European647 5.8% American592 5.3% Italian562 5.0% Polish388 3.5% French Canadian257 2.3% French239 2.1% Eastern European238 2.1% German162 1.5% Scottish143 1.3% Russian127 1.1% British104 0.9% Lithuanian103 0.9% Dutch69 0.6% Brazilian69 0.6% Trinidadian and Tobagonian67 0.6% Greek65 0.6% Armenian65 0.6% Norwegian58 0.5% Finnish41 0.4% Icelander39 0.4% Scotch-Irish31 0.3% Canadian29 0.3% Czech28 0.3% Jamaican25 0.2% Ukrainian24 0.2% Danish23 0.2% Hungarian22 0.2% Iranian22 0.2% South African22 0.2% Swiss20 0.2% Swedish19 0.2% Portuguese15 0.1% Northern European14 0.1% Scandinavian14 0.1% Haitian13 0.1% Turkish13 0.1% Czechoslovakian12 0.1% Macedonian11 0.10% Kenyan11 0.10% Welsh9 0.08% Slovene8 0.07% Ghanaian8 0.07% Cape Verdean7 0.06% Austrian7 0.06% African6 0.05% Belgian6 0.05% West Indian2 0.02% Ethiopian2 0.02% Nigerian2 0.02% Cajun
Geographical mobility in Northampton Same house 1 year ago 20,647 83.3% White (Caucasian)367 55.7% Black or African American58 94.0% American Indian / Alaska Native777 62.0% Asian1,020 94.5% Other race1,120 62.3% Two or more races19,922 83.0% White alone, not Hispanic / Latino2,069 86.1% Hispanic or LatinoMoved within same county 1,628 6.6% White / Caucasian50 7.5% Black or African American4 5.7% American Indian / Alaska Native83 6.7% Asian1 0.1% Other race144 8.0% Two or more races1,645 6.9% White alone, not Hispanic / Latino23 1.0% Hispanic or LatinoMoved within same state 1,235 5.0% White / Caucasian77 11.7% Black or African American101 8.1% Asian7 100.0% Native Hawaiian / Pacific Islander25 2.3% Other race244 13.5% Two or more races1,171 4.9% White alone, not Hispanic / Latino226 9.4% Hispanic or LatinoMoved from different state 1,054 4.3% White / Caucasian71 10.8% Black or African American123 9.8% Asian19 1.7% Other race210 11.7% Two or more races1,052 4.4% White alone, not Hispanic / Latino31 1.3% Hispanic or LatinoMoved from abroad 120 0.5% White10 1.6% Black or African American158 12.6% Asian18 1.6% Other race74 4.1% Two or more races120 0.5% White alone, not Hispanic / Latino35 1.4% Hispanic or Latino
Children Nativity (place of birth) in Northampton
Children under 6 years - Living with two parents Both parents native 594 100.0% Native0 0.0% Foreign-bornBoth parents foreign-born 43 73.7% Native16 26.3% Foreign-bornOne native, one foreign-born parent 201 100.0% NativeChildren under 6 years - Living with one parent Native parent 173 100.0% NativeForeign-born parent 17 100.0% NativeChildren 6 to 17 years - Living with two parents Both parents native 1,623 100.0% NativeBoth parents foreign-born 42 100.0% NativeOne native, one foreign-born parent 203 100.0% NativeChildren 6 to 17 years - Living with one parent Native parent 757 99.7% Native2 0.3% Foreign-bornForeign-born parent 223 66.9% Native110 33.1% Foreign-born
Grandparents responsible for own grandchildren in Northampton
Grandparents (30 to 59 years) White / Caucasian 8 36.2% Responsible for grandchildren13 63.8% Not responsible for grandchildrenWhite alone, not Hispanic / Latino 8 33.9% Responsible for grandchildren15 66.1% Not responsible for grandchildrenGrandparents (60 years and over) White / Caucasian 106 63.2% Responsible for grandchildren61 36.8% Not responsible for grandchildrenWhite alone, not Hispanic / Latino 54 45.3% Responsible for grandchildren66 54.7% Not responsible for grandchildren