Races in North Westside, Florida (FL) Detailed Stats
Ancestries, Foreign-born residents, place of birth
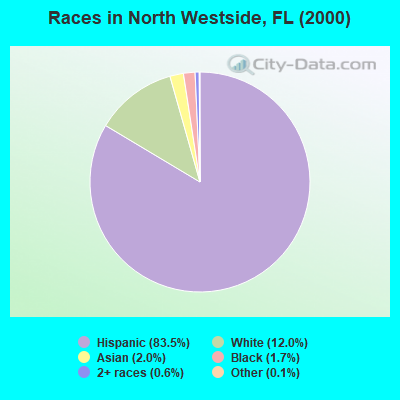
Race distribution in North Westside

- 84,57783.5%Hispanic
- 12,14012.0%White alone
- 2,0702.0%Asian alone
- 1,7441.7%Black alone
- 5900.6%Two or more races
- 1050.1%Other race alone
- 470.05%American Indian alone
- 120.01%Native Hawaiian and Other
Pacific Islander alone
2000
2022
-
- 10,458,50965.4%White alone
- 2,682,71516.8%Hispanic
- 2,264,26814.2%Black alone
- 261,6931.6%Asian alone
- 236,9541.5%Two or more races
- 42,3580.3%American Indian alone
- 28,9940.2%Other race alone
- 6,8870.04%Native Hawaiian and Other
Pacific Islander alone

-
- 11,309,40350.8%White alone
- 6,025,03927.1%Hispanic
- 3,241,01514.6%Black alone
- 861,6303.9%Two or more races
- 623,6922.8%Asian alone
- 152,0540.7%Other race alone
- 22,5040.1%American Indian alone
- 9,4860.04%Native Hawaiian and Other
Pacific Islander alone

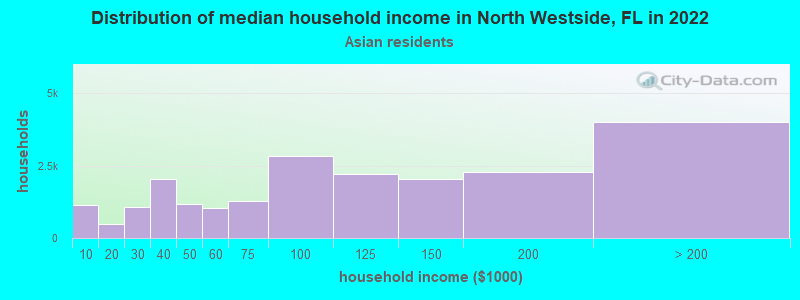
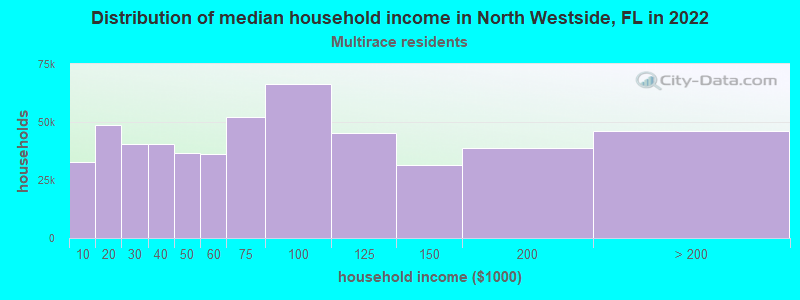
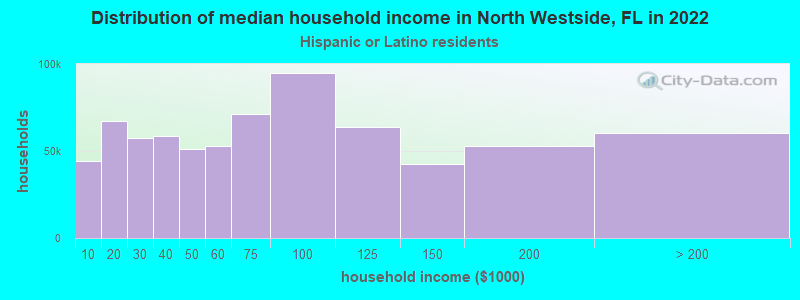
Income and house value in North Westside
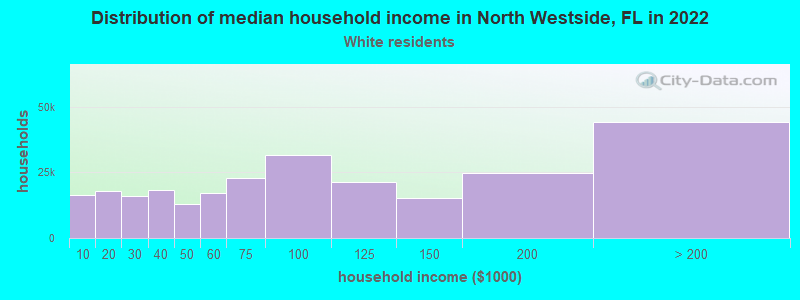
- Median household income in 2022
- $106,111White non-Hispanic householders
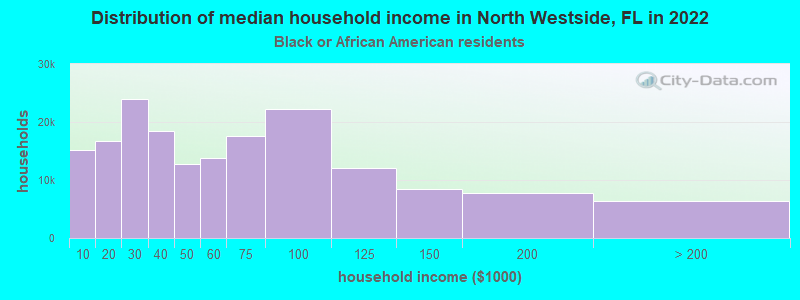
- $65,461Black householders
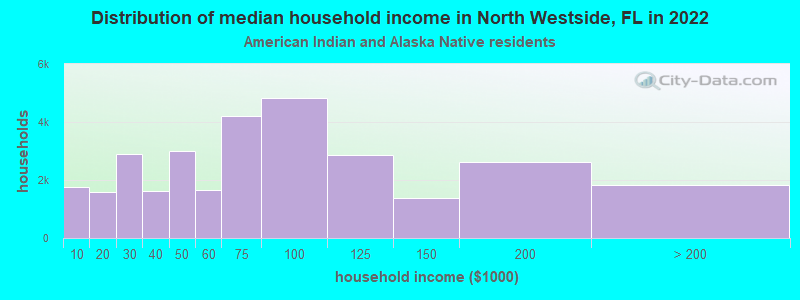
- $98,759American Indian and Alaska Native householders
- $121,135Asian householders
- $77,110Some other race householders
- $70,179Two or more races householders
- $68,379Hispanic or Latino race householders
- Median 2022 house value
- $630,695White Non-Hispanic householders
- $433,678Black or African American householders
- $150,165American Indian or Alaska Native householders
- $553,410Asian householders
- $436,481Some other race householders
- $474,523Two or more races householders
- $499,350Hispanic or Latino householders
Household income for White non-Hispanic householders
Household income for Black householders
Household income for American Indian and Alaska Native householders
Household income for Asian householders
Household income for Two or more races householders
Household income for Hispanic or Latino race householders
Zip code: 33178