Races in North Tulsa, Oklahoma (OK) Detailed Stats
Ancestries, Foreign-born residents, place of birth
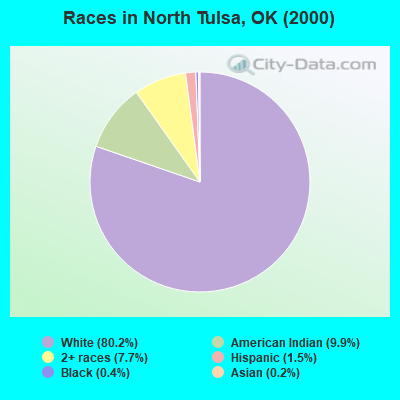
Race distribution in North Tulsa

- 8,24780.2%White alone
- 1,0159.9%American Indian alone
- 7897.7%Two or more races
- 1521.5%Hispanic
- 450.4%Black alone
- 250.2%Asian alone
- 40.04%Native Hawaiian and Other
Pacific Islander alone
2000
2022
-
- 2,556,36874.1%White alone
- 266,1587.7%American Indian alone
- 257,9817.5%Black alone
- 179,3045.2%Hispanic
- 140,2494.1%Two or more races
- 46,1721.3%Asian alone
- 2,3220.07%Other race alone
- 2,1000.06%Native Hawaiian and Other
Pacific Islander alone

-
- 2,517,40362.6%White alone
- 486,69212.1%Hispanic
- 364,4539.1%Two or more races
- 273,6506.8%American Indian alone
- 268,5436.7%Black alone
- 92,6722.3%Asian alone
- 10,7860.3%Other race alone
- 5,6010.1%Native Hawaiian and Other
Pacific Islander alone

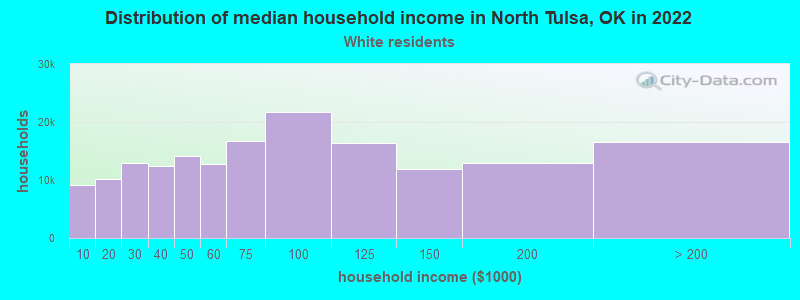
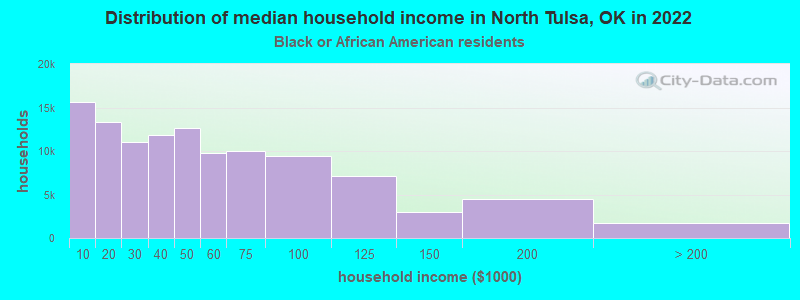
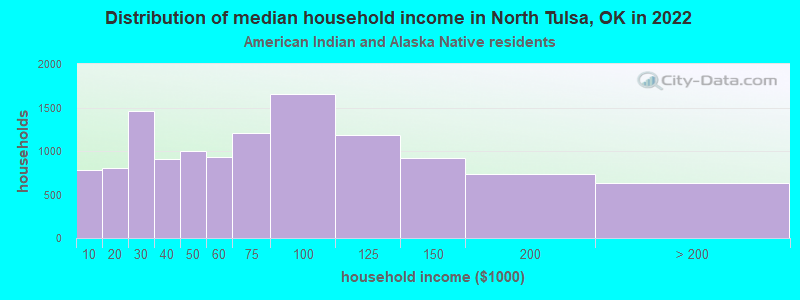
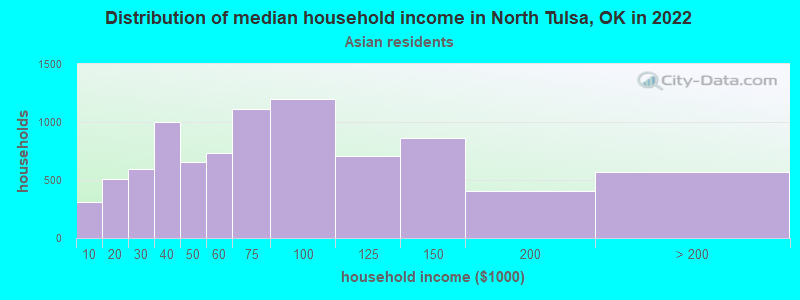
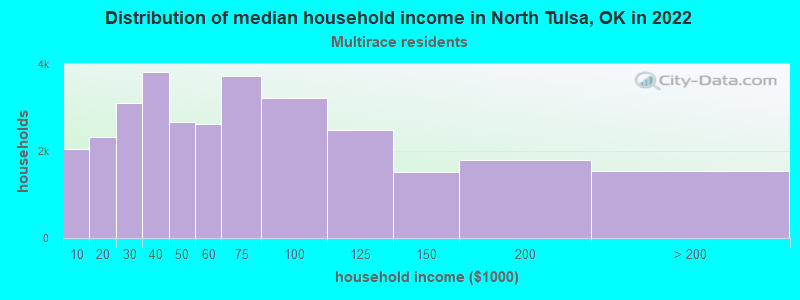
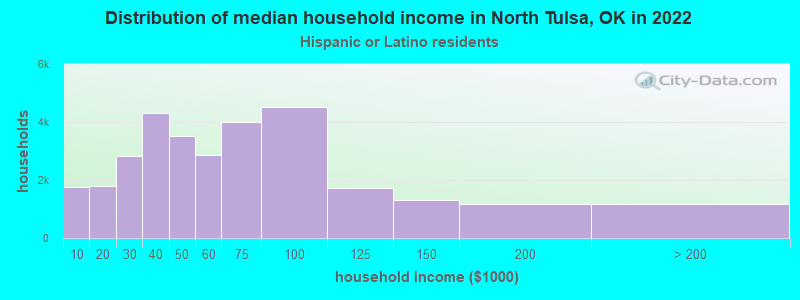
Income and house value in North Tulsa
- Median household income in 2022
- $64,091White non-Hispanic householders
- $168,329Black householders
- $65,457American Indian and Alaska Native householders
- $72,595Asian householders
- $53,189Two or more races householders
- $63,876Hispanic or Latino race householders
- Median 2022 house value
- $181,562White Non-Hispanic householders
- $84,538Black or African American householders
- $171,937American Indian or Alaska Native householders
- $297,574Asian householders
- $175,319Two or more races householders
- $221,100Hispanic or Latino householders
Household income for White non-Hispanic householders
Household income for Black householders
Household income for American Indian and Alaska Native householders
Household income for Asian householders
Household income for Two or more races householders
Household income for Hispanic or Latino race householders
Zip code: 74021