Races in North Tonawanda, New York (NY) Detailed Stats
Data:
Races - White alone (%)
Races - White alone (% change since 2000)
Races - Black alone (%)
Races - Black alone (% change since 2000)
Races - American Indian alone (%)
Races - American Indian alone (% change since 2000)
Races - Asian alone (%)
Races - Asian alone (% change since 2000)
Races - Hispanic (%)
Races - Hispanic (% change since 2000)
Races - Native Hawaiian and Other Pacific Islander alone (%)
Races - Native Hawaiian and Other Pacific Islander alone (% change since 2000)
Races - Two or more races(%)
Races - Two or more races(% change since 2000)
Races - Other race alone (%)
Races - Other race alone (% change since 2000)
Racial diversity
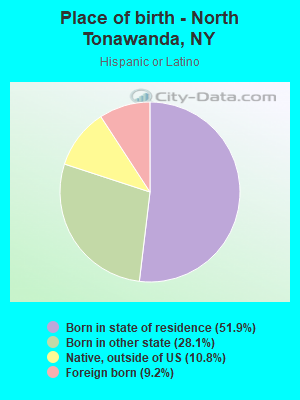
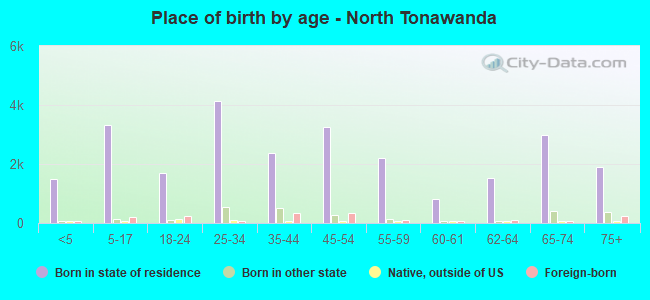
Place of birth - Born in state of residence (%)
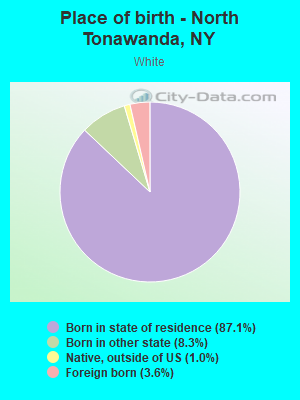
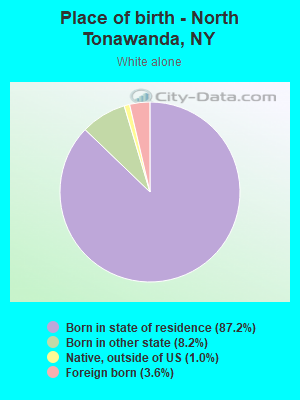
Place of birth - Born in state of residence (%) - White
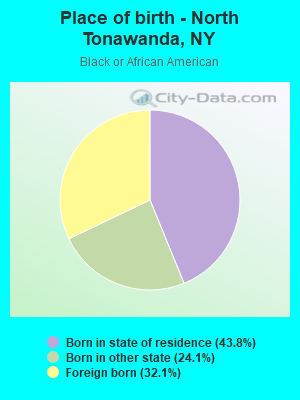
Place of birth - Born in state of residence (%) - Black or African American
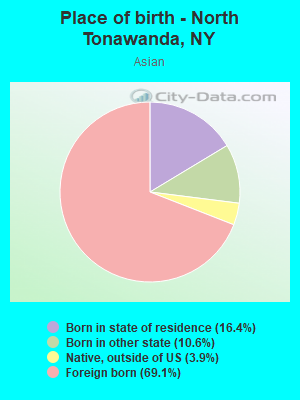
Place of birth - Born in state of residence (%) - Asian
Place of birth - Born in state of residence (%) - Hispanic or Latino
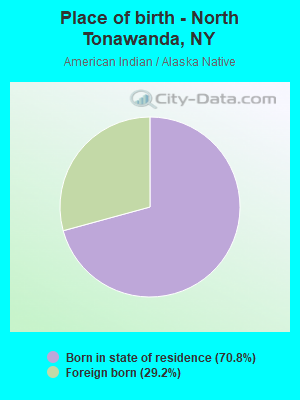
Place of birth - Born in state of residence (%) - American Indian and Alaska Native
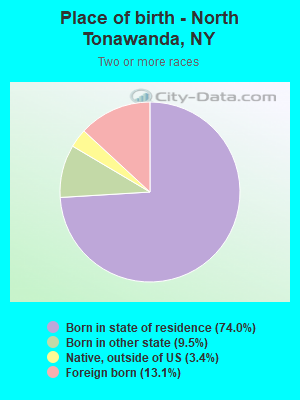
Place of birth - Born in state of residence (%) - Multirace
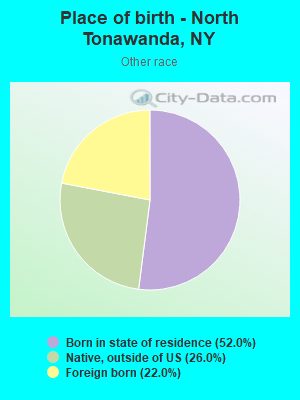
Place of birth - Born in state of residence (%) - Other Race
Place of birth - Born in other state (%)
Place of birth - Born in other state (%) - White
Place of birth - Born in other state (%) - Black or African American
Place of birth - Born in other state (%) - Asian
Place of birth - Born in other state (%) - Hispanic or Latino
Place of birth - Born in other state (%) - American Indian and Alaska Native
Place of birth - Born in other state (%) - Multirace
Place of birth - Born in other state (%) - Other Race
Place of birth - Native, outside of US (%)
Place of birth - Native, outside of US (%) - White
Place of birth - Native, outside of US (%) - Black or African American
Place of birth - Native, outside of US (%) - Asian
Place of birth - Native, outside of US (%) - Hispanic or Latino
Place of birth - Native, outside of US (%) - American Indian and Alaska Native
Place of birth - Native, outside of US (%) - Multirace
Place of birth - Native, outside of US (%) - Other Race
Place of birth - Foreign born (%)
Place of birth - Foreign born (%) - White
Place of birth - Foreign born (%) - Black or African American
Place of birth - Foreign born (%) - Asian
Place of birth - Foreign born (%) - Hispanic or Latino
Place of birth - Foreign born (%) - American Indian and Alaska Native
Place of birth - Foreign born (%) - Multirace
Place of birth - Foreign born (%) - Other Race
Residents speaking English at home (%)
Residents speaking English at home - Born in the United States (%)
Residents speaking English at home - Native, born elsewhere (%)
Residents speaking English at home - Foreign born (%)
Residents speaking Spanish at home (%)
Residents speaking Spanish at home - Born in the United States (%)
Residents speaking Spanish at home - Native, born elsewhere (%)
Residents speaking Spanish at home - Foreign born (%)
Residents speaking other language at home (%)
Residents speaking other language at home - Born in the United States (%)
Residents speaking other language at home - Native, born elsewhere (%)
Residents speaking other language at home - Foreign born (%)
Marital status - Never married (%)
Marital status - Now married (%)
Marital status - Separated (%)
Marital status - Widowed (%)
Marital status - Divorced (%)
Ancestries Reported - Arab (%)
Ancestries Reported - Czech (%)
Ancestries Reported - Danish (%)
Ancestries Reported - Dutch (%)
Ancestries Reported - English (%)
Ancestries Reported - French (%)
Ancestries Reported - French Canadian (%)
Ancestries Reported - German (%)
Ancestries Reported - Greek (%)
Ancestries Reported - Hungarian (%)
Ancestries Reported - Irish (%)
Ancestries Reported - Italian (%)
Ancestries Reported - Lithuanian (%)
Ancestries Reported - Norwegian (%)
Ancestries Reported - Polish (%)
Ancestries Reported - Portuguese (%)
Ancestries Reported - Russian (%)
Ancestries Reported - Scotch-Irish (%)
Ancestries Reported - Scottish (%)
Ancestries Reported - Slovak (%)
Ancestries Reported - Subsaharan African (%)
Ancestries Reported - Swedish (%)
Ancestries Reported - Swiss (%)
Ancestries Reported - Ukrainian (%)
Ancestries Reported - United States (%)
Ancestries Reported - Welsh (%)
Ancestries Reported - West Indian (%)
Ancestries Reported - Other (%)
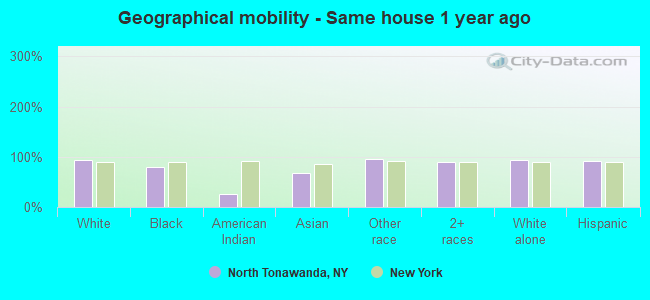
Geographical mobility - Same house 1 year ago (%)
Geographical mobility - Same house 1 year ago (%) - White
Geographical mobility - Same house 1 year ago (%) - Black or African American
Geographical mobility - Same house 1 year ago (%) - Asian
Geographical mobility - Same house 1 year ago (%) - Hispanic or Latino
Geographical mobility - Same house 1 year ago (%) - American Indian and Alaska Native
Geographical mobility - Same house 1 year ago (%) - Multirace
Geographical mobility - Same house 1 year ago (%) - Other Race
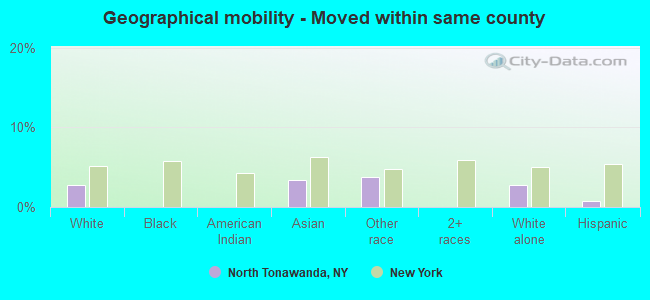
Geographical mobility - Moved within same county (%)
Geographical mobility - Moved within same county (%) - White
Geographical mobility - Moved within same county (%) - Black or African American
Geographical mobility - Moved within same county (%) - Asian
Geographical mobility - Moved within same county (%) - Hispanic or Latino
Geographical mobility - Moved within same county (%) - American Indian and Alaska Native
Geographical mobility - Moved within same county (%) - Multirace
Geographical mobility - Moved within same county (%) - Other Race
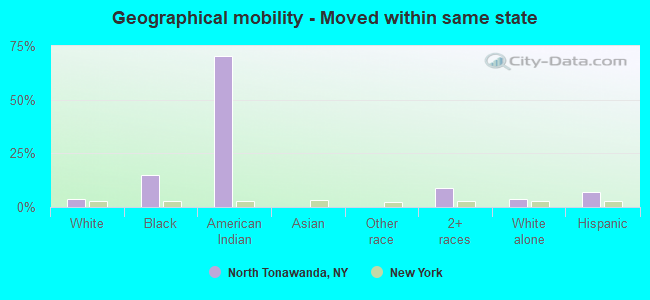
Geographical mobility - Moved from different county within same state (%)
Geographical mobility - Moved from different county within same state (%) - White
Geographical mobility - Moved from different county within same state (%) - Black or African American
Geographical mobility - Moved from different county within same state (%) - Asian
Geographical mobility - Moved from different county within same state (%) - Hispanic or Latino
Geographical mobility - Moved from different county within same state (%) - American Indian and Alaska Native
Geographical mobility - Moved from different county within same state (%) - Multirace
Geographical mobility - Moved from different county within same state (%) - Other Race
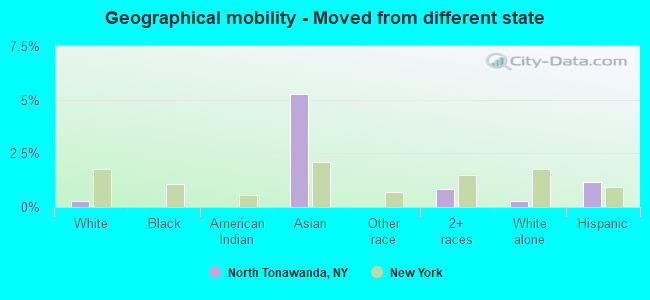
Geographical mobility - Moved from different state (%)
Geographical mobility - Moved from different state (%) - White
Geographical mobility - Moved from different state (%) - Black or African American
Geographical mobility - Moved from different state (%) - Asian
Geographical mobility - Moved from different state (%) - Hispanic or Latino
Geographical mobility - Moved from different state (%) - American Indian and Alaska Native
Geographical mobility - Moved from different state (%) - Multirace
Geographical mobility - Moved from different state (%) - Other Race
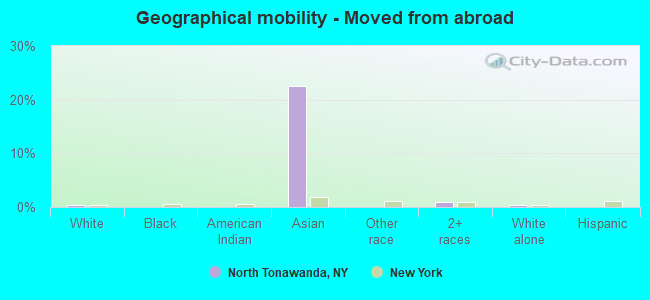
Geographical mobility - Moved from abroad (%)
Geographical mobility - Moved from abroad (%) - White
Geographical mobility - Moved from abroad (%) - Black or African American
Geographical mobility - Moved from abroad (%) - Asian
Geographical mobility - Moved from abroad (%) - Hispanic or Latino
Geographical mobility - Moved from abroad (%) - American Indian and Alaska Native
Geographical mobility - Moved from abroad (%) - Multirace
Geographical mobility - Moved from abroad (%) - Other Race
Place of birth for the foreign-born population - Ireland (%)
Place of birth for the foreign-born population - Denmark (%)
Place of birth for the foreign-born population - Norway (%)
Place of birth for the foreign-born population - Sweden (%)
Place of birth for the foreign-born population - United Kingdom (%)
Place of birth for the foreign-born population - England (%)
Place of birth for the foreign-born population - Scotland (%)
Place of birth for the foreign-born population - Other Northern Europe (%)
Place of birth for the foreign-born population - Austria (%)
Place of birth for the foreign-born population - Belgium (%)
Place of birth for the foreign-born population - France (%)
Place of birth for the foreign-born population - Germany (%)
Place of birth for the foreign-born population - Netherlands (%)
Place of birth for the foreign-born population - Switzerland (%)
Place of birth for the foreign-born population - Other Western Europe (%)
Place of birth for the foreign-born population - Greece (%)
Place of birth for the foreign-born population - Italy (%)
Place of birth for the foreign-born population - Portugal (%)
Place of birth for the foreign-born population - Spain (%)
Place of birth for the foreign-born population - Other Southern Europe (%)
Place of birth for the foreign-born population - Albania (%)
Place of birth for the foreign-born population - Belarus (%)
Place of birth for the foreign-born population - Bosnia and Herzegovina (%)
Place of birth for the foreign-born population - Bulgaria (%)
Place of birth for the foreign-born population - Croatia (%)
Place of birth for the foreign-born population - Czechoslovakia (%)
Place of birth for the foreign-born population - Hungary (%)
Place of birth for the foreign-born population - Latvia (%)
Place of birth for the foreign-born population - Lithuania (%)
Place of birth for the foreign-born population - North Macedonia (Macedonia) (%)
Place of birth for the foreign-born population - Moldova (%)
Place of birth for the foreign-born population - Poland (%)
Place of birth for the foreign-born population - Romania (%)
Place of birth for the foreign-born population - Russia (%)
Place of birth for the foreign-born population - Serbia (%)
Place of birth for the foreign-born population - Ukraine (%)
Place of birth for the foreign-born population - Other Eastern Europe (%)
Place of birth for the foreign-born population - China (%)
Place of birth for the foreign-born population - Hong Kong (%)
Place of birth for the foreign-born population - Taiwan (%)
Place of birth for the foreign-born population - Japan (%)
Place of birth for the foreign-born population - Korea (%)
Place of birth for the foreign-born population - Other Eastern Asia (%)
Place of birth for the foreign-born population - Afghanistan (%)
Place of birth for the foreign-born population - Bangladesh (%)
Place of birth for the foreign-born population - India (%)
Place of birth for the foreign-born population - Iran (%)
Place of birth for the foreign-born population - Kazakhstan (%)
Place of birth for the foreign-born population - Nepal (%)
Place of birth for the foreign-born population - Pakistan (%)
Place of birth for the foreign-born population - Sri Lanka (%)
Place of birth for the foreign-born population - Uzbekistan (%)
Place of birth for the foreign-born population - Other South Central Asia (%)
Place of birth for the foreign-born population - Burma (%)
Place of birth for the foreign-born population - Cambodia (%)
Place of birth for the foreign-born population - Indonesia (%)
Place of birth for the foreign-born population - Laos (%)
Place of birth for the foreign-born population - Malaysia (%)
Place of birth for the foreign-born population - Philippines (%)
Place of birth for the foreign-born population - Singapore (%)
Place of birth for the foreign-born population - Thailand (%)
Place of birth for the foreign-born population - Vietnam (%)
Place of birth for the foreign-born population - Other South Eastern Asia (%)
Place of birth for the foreign-born population - Armenia (%)
Place of birth for the foreign-born population - Iraq (%)
Place of birth for the foreign-born population - Israel (%)
Place of birth for the foreign-born population - Jordan (%)
Place of birth for the foreign-born population - Kuwait (%)
Place of birth for the foreign-born population - Lebanon (%)
Place of birth for the foreign-born population - Saudi Arabia (%)
Place of birth for the foreign-born population - Syria (%)
Place of birth for the foreign-born population - Turkey (%)
Place of birth for the foreign-born population - Yemen (%)
Place of birth for the foreign-born population - Other Western Asia (%)
Place of birth for the foreign-born population - Eritrea (%)
Place of birth for the foreign-born population - Ethiopia (%)
Place of birth for the foreign-born population - Kenya (%)
Place of birth for the foreign-born population - Somalia (%)
Place of birth for the foreign-born population - Uganda (%)
Place of birth for the foreign-born population - Zimbabwe (%)
Place of birth for the foreign-born population - Other Eastern Africa (%)
Place of birth for the foreign-born population - Cameroon (%)
Place of birth for the foreign-born population - Congo (%)
Place of birth for the foreign-born population - Democratic Republic of Congo (Zaire) (%)
Place of birth for the foreign-born population - Other Middle Africa (%)
Place of birth for the foreign-born population - Egypt (%)
Place of birth for the foreign-born population - Morocco (%)
Place of birth for the foreign-born population - Sudan (%)
Place of birth for the foreign-born population - Other Northern Africa (%)
Place of birth for the foreign-born population - South Africa (%)
Place of birth for the foreign-born population - Other Southern Africa (%)
Place of birth for the foreign-born population - Cabo Verde (%)
Place of birth for the foreign-born population - Ghana (%)
Place of birth for the foreign-born population - Liberia (%)
Place of birth for the foreign-born population - Nigeria (%)
Place of birth for the foreign-born population - Senegal (%)
Place of birth for the foreign-born population - Sierra Leone (%)
Place of birth for the foreign-born population - Other Western Africa (%)
Place of birth for the foreign-born population - Australia (%)
Place of birth for the foreign-born population - New Zealand (%)
Place of birth for the foreign-born population - Fiji (%)
Place of birth for the foreign-born population - Micronesia (%)
Place of birth for the foreign-born population - Bahamas (%)
Place of birth for the foreign-born population - Barbados (%)
Place of birth for the foreign-born population - Cuba (%)
Place of birth for the foreign-born population - Dominica (%)
Place of birth for the foreign-born population - Dominican Republic (%)
Place of birth for the foreign-born population - Grenada (%)
Place of birth for the foreign-born population - Haiti (%)
Place of birth for the foreign-born population - Jamaica (%)
Place of birth for the foreign-born population - St. Vincent and the Grenadines (%)
Place of birth for the foreign-born population - Trinidad and Tobago (%)
Place of birth for the foreign-born population - West Indies (%)
Place of birth for the foreign-born population - Other Caribbean (%)
Place of birth for the foreign-born population - Belize (%)
Place of birth for the foreign-born population - Costa Rica (%)
Place of birth for the foreign-born population - El Salvador (%)
Place of birth for the foreign-born population - Guatemala (%)
Place of birth for the foreign-born population - Honduras (%)
Place of birth for the foreign-born population - Mexico (%)
Place of birth for the foreign-born population - Nicaragua (%)
Place of birth for the foreign-born population - Panama (%)
Place of birth for the foreign-born population - Other Central America (%)
Place of birth for the foreign-born population - Argentina (%)
Place of birth for the foreign-born population - Bolivia (%)
Place of birth for the foreign-born population - Brazil (%)
Place of birth for the foreign-born population - Chile (%)
Place of birth for the foreign-born population - Colombia (%)
Place of birth for the foreign-born population - Ecuador (%)
Place of birth for the foreign-born population - Guyana (%)
Place of birth for the foreign-born population - Peru (%)
Place of birth for the foreign-born population - Uruguay (%)
Place of birth for the foreign-born population - Venezuela (%)
Place of birth for the foreign-born population - Other South America (%)
Place of birth for the foreign-born population - Canada (%)
Place of birth for the foreign-born population - Other Northern America (%)
Place of birth for the foreign-born population - Other (%)
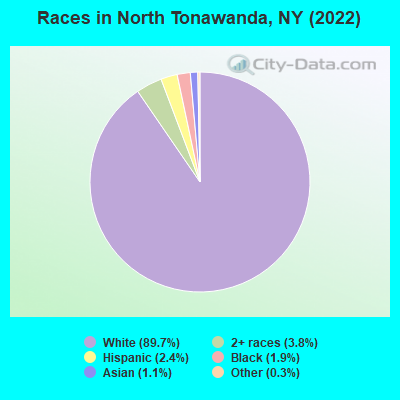
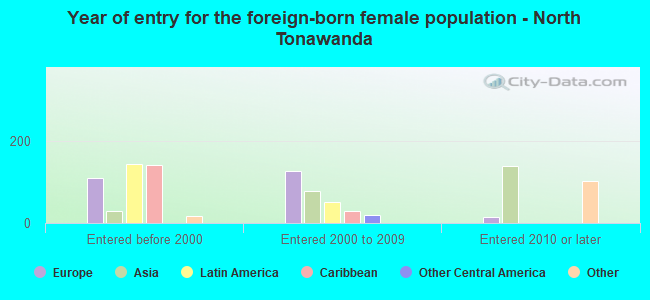
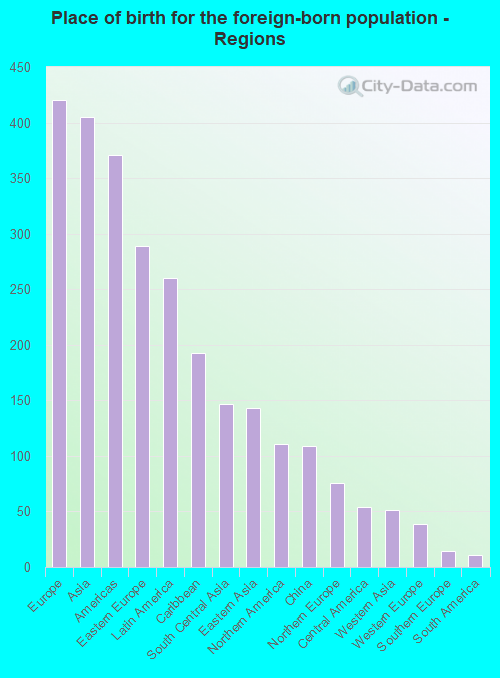
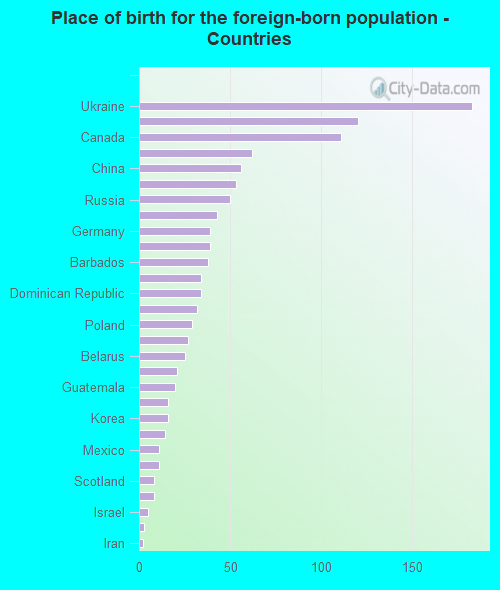
According to 2022 data, the most numerous races in North Tonawanda, NY are White alone (27,166 residents), Hispanic (713 residents), and Black alone (583 residents). 94.5% of North Tonawanda residents speak English at home. 4.0% of North Tonawanda, NY residents are foreign-born (1.4% born in Europe, 1.3% born in Asia, 0.9% born in Latin America), which is 456.6% less than the foreign-born rate of 22.0% across the entire state of New York.
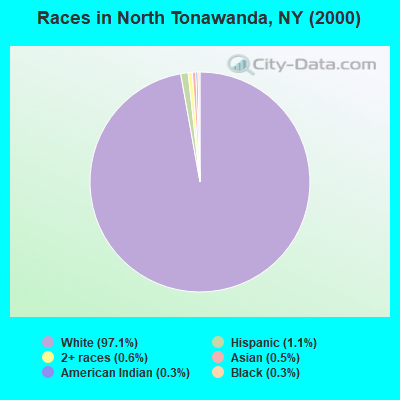
Race distribution in North Tonawanda
2000 2022
11,760,981 62.0% White alone 2,867,583 15.1% Hispanic 2,812,623 14.8% Black alone 1,035,926 5.5% Asian alone 366,116 1.9% Two or more races 75,499 0.4% Other race alone 52,499 0.3% American Indian alone 5,230 0.03% Native Hawaiian and Other
10,408,933 52.9% White alone 3,867,299 19.7% Hispanic 2,633,840 13.4% Black alone 1,776,286 9.0% Asian alone 732,670 3.7% Two or more races 216,110 1.1% Other race alone 35,082 0.2% American Indian alone 6,931 0.04% Native Hawaiian and Other
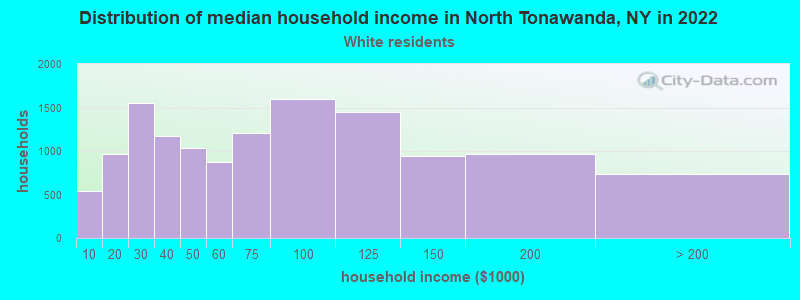
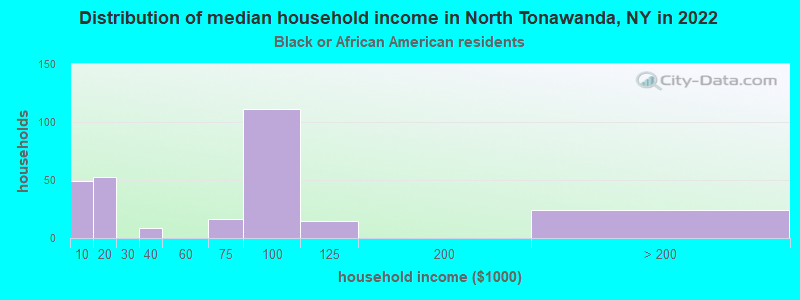
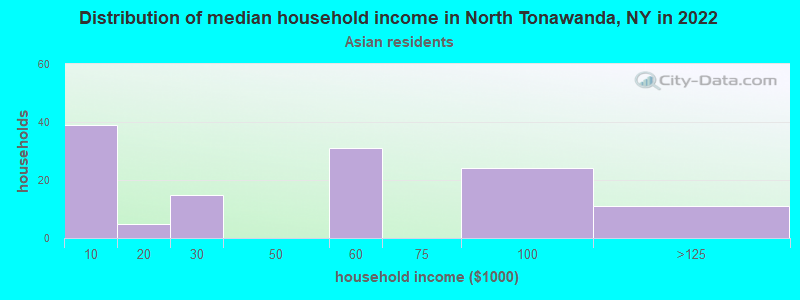
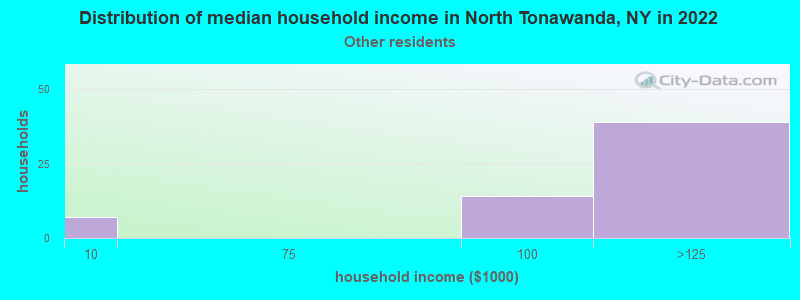
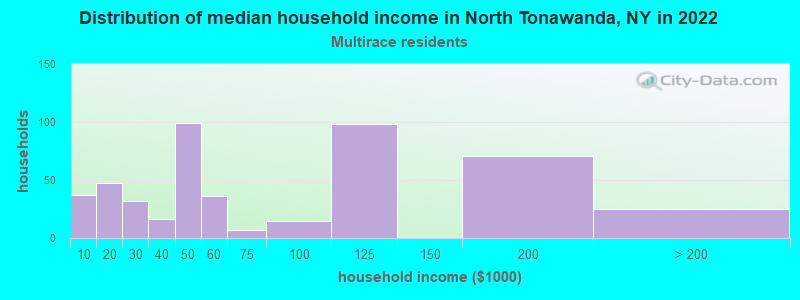
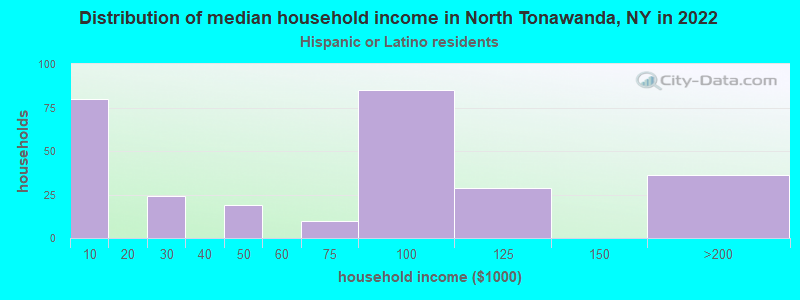
Income and house value in North Tonawanda Median household income in 2022 $63,842 White non-Hispanic householders$48,444 Asian householders$109,664 Some other race householders$97,678 Hispanic or Latino race householdersMedian 2022 house value $197,602 White Non-Hispanic householders$391,589 Black or African American householders $161,455 Asian householders$175,191 Some other race householders$183,384 Two or more races householders$207,964 Hispanic or Latino householders
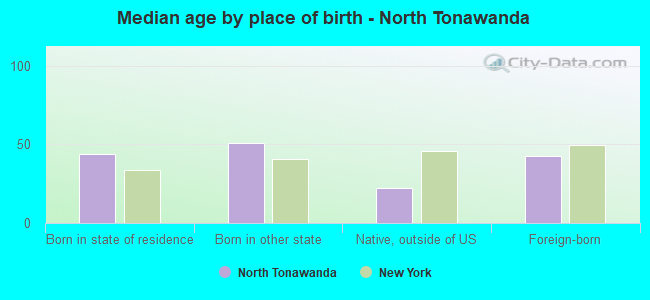
Median age by race in North Tonawanda
44.9 Median age for White residents42.0 48.9 58.3 Median age for Black or African American residents35.3 51.9 -616,302,186.3 Median age for American Indian / Alaska Native residents-449,999,999.5 -1,014,925,372.1 43.1 Median age for Asian residents52.7 38.4 -487,992,314.6 Median age for Native Hawaiian / Pacific Islander residents-666,666,666.0 -666,666,666.0 35.4 Median age for Other race residents38.6 24.5 26.9 Median age for Two or more races residents22.0 37.6 45.4 Median age for White alone residents42.0 49.1 41.0 Median age for Hispanic or Latino residents40.3 38.9
Owner/renter occupied households by race in North Tonawanda
House owners and renters - White residents 9,080 69.2% Owner occupied4,047 30.8% Renter occupiedHouse owners and renters - Black or African American residents 59 19.3% Owner occupied246 80.7% Renter occupiedHouse owners and renters - Asian residents 79 61.8% Owner occupied49 38.2% Renter occupiedHouse owners and renters - Other race residents 33 44.1% Owner occupied41 55.9% Renter occupiedHouse owners and renters - Two or more races residents 223 55.7% Owner occupied177 44.3% Renter occupiedHouse owners and renters - White alone residents 9,087 69.7% Owner occupied3,945 30.3% Renter occupiedHouse owners and renters - Hispanic or Latino residents 39 11.5% Owner occupied304 88.5% Renter occupied
Language usage in North Tonawanda
English speakers - Total 94.5% of residents of North Tonawanda speak English at home.
1.2% of residents speak Spanish at home 216 60.3% Speak English very well142 39.7% Speak English less than very well4.1% of residents speak other language at home 800 68.1% Speak English very well375 31.9% Speak English less than very well
English speakers - Born in the United States 91.2% of residents of North Tonawanda speak English at home.
8.6% of residents speak Spanish at home 204 91.1% Speak English very well20 8.9% Speak English less than very well1.0% of residents speak other language at home 25 100.0% Speak English very well
English speakers - Native, born elsewhere 59.5% of residents of North Tonawanda speak English at home.
19.8% of residents speak Spanish at home 8 11.0% Speak English very well65 89.0% Speak English less than very well14.7% of residents speak other language at home 54 100.0% Speak English very well
English speakers - Foreign-born 35.2% of residents of North Tonawanda speak English at home.
7.4% of residents speak Spanish at home 111 95.7% Speak English very well5 4.3% Speak English less than very well60.1% of residents speak other language at home 601 63.6% Speak English very well344 36.4% Speak English less than very well
White (Caucasian) - Speak only English Native:
99.2% (24,992)Foreign-born:
25.6% (248)
White (Caucasian) - Speak another language Native:
1.0% (244)Foreign-born:
77.9% (755)
Black or African American - Speak only English Native:
82.3% (423)Foreign-born:
79.9% (191)
American Indian / Alaska Native - Speak only English Native:
90.8% (13)Foreign-born:
64.1% (4)
Asian - Speak only English Native:
51.3% (33)Foreign-born:
36.6% (89)
Asian - Speak another language Native:
48.3% (31)Foreign-born:
63.8% (155)
Other race - Speak another language Native:
41.6% (47)Foreign-born:
99.8% (24)
Two or more races - Speak only English Native:
90.9% (921)Foreign-born:
15.7% (28)
Two or more races - Speak another language Native:
3.5% (35)Foreign-born:
64.1% (113)
White alone - Speak only English Native:
99.5% (24,901)Foreign-born:
25.4% (248)
White alone - Speak another language Native:
0.7% (179)Foreign-born:
78.9% (771)
Hispanic or Latino - Speak only English Native:
46.3% (248)Foreign-born:
34.3% (22)
Hispanic or Latino - Speak another language Native:
57.7% (309)Foreign-born:
75.5% (49)
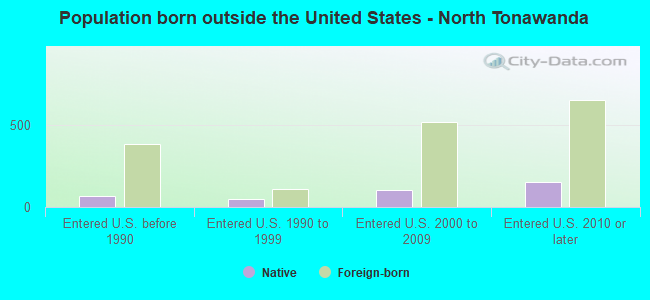
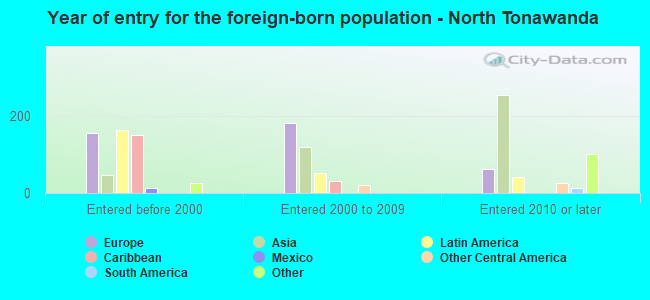
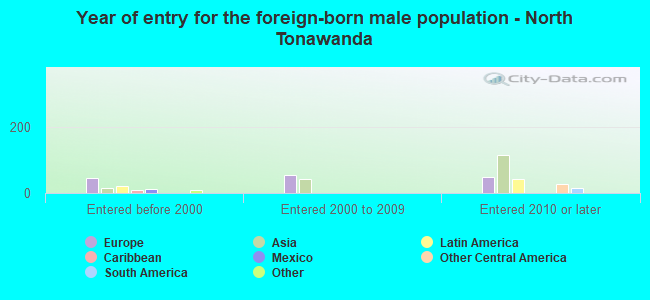
Foreign-born residents in North Tonawanda 1,197 residents are foreign born (1.4% Europe , 1.3% Asia , 0.9% Latin America ).
This city:
4.0%New York:
22.6%
Marital status for residents in North Tonawanda Marital status - White (Caucasian) population 15 years and over
Males 36.3% Never married49.9% Now married1.1% Separated3.0% Widowed9.6% DivorcedFemales 25.4% Never married49.2% Now married2.5% Separated10.0% Widowed12.9% DivorcedWomen who gave birth in the past 12 months Now married:
83.3% (268)Unmarried:
16.7% (54)
Women who did not give birth in the past 12 months Now married:
44.8% (2,289)Unmarried:
55.2% (2,821)
Marital status - Black or African American population 15 years and over
Males 46.8% Never married53.2% Now married0.0% Separated0.0% Widowed0.0% DivorcedFemales 55.9% Never married25.2% Now married18.8% Separated0.0% Widowed0.0% DivorcedWomen who did not give birth in the past 12 months Now married:
59.9% (86)Unmarried:
40.1% (57)
Marital status - American Indian / Alaska Native population 15 years and over
Males 0.0% Never married100.0% Now married0.0% Separated0.0% Widowed0.0% DivorcedFemales 0.0% Never married0.0% Now married0.0% Separated100.0% Widowed0.0% DivorcedMarital status - Asian population 15 years and over
Males 68.6% Never married31.4% Now married0.0% Separated0.0% Widowed0.0% DivorcedFemales 21.1% Never married64.1% Now married0.0% Separated4.9% Widowed9.9% DivorcedWomen who did not give birth in the past 12 months Now married:
59.6% (65)Unmarried:
40.4% (44)
Marital status - Other race population 15 years and over
Males 7.1% Never married92.9% Now married0.0% Separated0.0% Widowed0.0% DivorcedFemales 38.5% Never married42.3% Now married0.0% Separated0.0% Widowed19.2% DivorcedWomen who did not give birth in the past 12 months Now married:
52.4% (12)Unmarried:
47.6% (11)
Marital status - Two or more races population 15 years and over
Males 32.4% Never married48.5% Now married10.2% Separated0.0% Widowed8.9% DivorcedFemales 55.0% Never married24.2% Now married7.9% Separated3.0% Widowed9.8% DivorcedWomen who did not give birth in the past 12 months Now married:
14.7% (46)Unmarried:
85.3% (269)
Marital status - White alone, not Hispanic / Latino population 15 years and over
Males 36.6% Never married49.8% Now married1.1% Separated3.0% Widowed9.6% DivorcedFemales 25.6% Never married48.9% Now married2.5% Separated10.1% Widowed12.9% DivorcedWomen who gave birth in the past 12 months Now married:
83.3% (268)Unmarried:
16.7% (54)
Women who did not give birth in the past 12 months Now married:
44.7% (2,286)Unmarried:
55.3% (2,825)
Marital status - Hispanic or Latino population 15 years and over
Males 1.1% Never married87.9% Now married0.0% Separated4.6% Widowed6.3% DivorcedFemales 26.7% Never married41.5% Now married27.4% Separated0.7% Widowed3.6% DivorcedWomen who did not give birth in the past 12 months Now married:
52.9% (81)Unmarried:
47.1% (72)
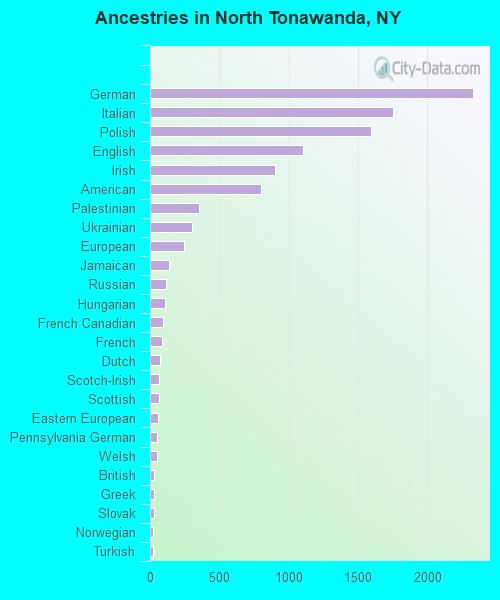
Ancestries in North Tonawanda
2,329 20.6% German1,755 15.5% Italian1,595 14.1% Polish1,102 9.7% English902 8.0% Irish798 7.0% American355 3.1% Palestinian300 2.6% Ukrainian242 2.1% European138 1.2% Jamaican116 1.0% Russian110 1.0% Hungarian97 0.9% French Canadian89 0.8% French70 0.6% Dutch65 0.6% Scotch-Irish65 0.6% Scottish57 0.5% Eastern European51 0.5% Pennsylvania German49 0.4% Welsh28 0.2% British27 0.2% Greek27 0.2% Slovak25 0.2% Norwegian24 0.2% Turkish17 0.2% Alsatian17 0.2% Swiss11 0.10% Croatian10 0.09% Portuguese8 0.07% Northern European7 0.06% Romanian6 0.05% Canadian
Children Nativity (place of birth) in North Tonawanda
Children under 6 years - Living with two parents Both parents native 1,100 100.0% Native0 0.0% Foreign-bornBoth parents foreign-born 26 73.7% Native9 26.3% Foreign-bornOne native, one foreign-born parent 63 100.0% NativeChildren under 6 years - Living with one parent Native parent 413 100.0% NativeChildren 6 to 17 years - Living with two parents Both parents native 2,093 99.5% Native10 0.5% Foreign-bornBoth parents foreign-born 85 86.1% Native14 13.9% Foreign-bornOne native, one foreign-born parent 13 100.0% NativeChildren 6 to 17 years - Living with one parent Native parent 877 100.0% NativeForeign-born parent 104 59.6% Native70 40.4% Foreign-born
Grandparents responsible for own grandchildren in North Tonawanda
Grandparents (30 to 59 years) White / Caucasian 26 81.6% Responsible for grandchildren6 18.4% Not responsible for grandchildrenWhite alone, not Hispanic / Latino 28 80.1% Responsible for grandchildren7 19.9% Not responsible for grandchildrenGrandparents (60 years and over) White / Caucasian 30 24.1% Responsible for grandchildren94 75.9% Not responsible for grandchildrenWhite alone, not Hispanic / Latino 32 24.2% Responsible for grandchildren100 75.8% Not responsible for grandchildren