Races in North Springfield, Virginia (VA) Detailed Stats
Data:
Races - White alone (%)
Races - White alone (% change since 2000)
Races - Black alone (%)
Races - Black alone (% change since 2000)
Races - American Indian alone (%)
Races - American Indian alone (% change since 2000)
Races - Asian alone (%)
Races - Asian alone (% change since 2000)
Races - Hispanic (%)
Races - Hispanic (% change since 2000)
Races - Native Hawaiian and Other Pacific Islander alone (%)
Races - Native Hawaiian and Other Pacific Islander alone (% change since 2000)
Races - Two or more races(%)
Races - Two or more races(% change since 2000)
Races - Other race alone (%)
Races - Other race alone (% change since 2000)
Racial diversity
Place of birth - Born in state of residence (%)
Place of birth - Born in state of residence (%) - White
Place of birth - Born in state of residence (%) - Black or African American
Place of birth - Born in state of residence (%) - Asian
Place of birth - Born in state of residence (%) - Hispanic or Latino
Place of birth - Born in state of residence (%) - American Indian and Alaska Native
Place of birth - Born in state of residence (%) - Multirace
Place of birth - Born in state of residence (%) - Other Race
Place of birth - Born in other state (%)
Place of birth - Born in other state (%) - White
Place of birth - Born in other state (%) - Black or African American
Place of birth - Born in other state (%) - Asian
Place of birth - Born in other state (%) - Hispanic or Latino
Place of birth - Born in other state (%) - American Indian and Alaska Native
Place of birth - Born in other state (%) - Multirace
Place of birth - Born in other state (%) - Other Race
Place of birth - Native, outside of US (%)
Place of birth - Native, outside of US (%) - White
Place of birth - Native, outside of US (%) - Black or African American
Place of birth - Native, outside of US (%) - Asian
Place of birth - Native, outside of US (%) - Hispanic or Latino
Place of birth - Native, outside of US (%) - American Indian and Alaska Native
Place of birth - Native, outside of US (%) - Multirace
Place of birth - Native, outside of US (%) - Other Race
Place of birth - Foreign born (%)
Place of birth - Foreign born (%) - White
Place of birth - Foreign born (%) - Black or African American
Place of birth - Foreign born (%) - Asian
Place of birth - Foreign born (%) - Hispanic or Latino
Place of birth - Foreign born (%) - American Indian and Alaska Native
Place of birth - Foreign born (%) - Multirace
Place of birth - Foreign born (%) - Other Race
Residents speaking English at home (%)
Residents speaking English at home - Born in the United States (%)
Residents speaking English at home - Native, born elsewhere (%)
Residents speaking English at home - Foreign born (%)
Residents speaking Spanish at home (%)
Residents speaking Spanish at home - Born in the United States (%)
Residents speaking Spanish at home - Native, born elsewhere (%)
Residents speaking Spanish at home - Foreign born (%)
Residents speaking other language at home (%)
Residents speaking other language at home - Born in the United States (%)
Residents speaking other language at home - Native, born elsewhere (%)
Residents speaking other language at home - Foreign born (%)
Marital status - Never married (%)
Marital status - Now married (%)
Marital status - Separated (%)
Marital status - Widowed (%)
Marital status - Divorced (%)
Ancestries Reported - Arab (%)
Ancestries Reported - Czech (%)
Ancestries Reported - Danish (%)
Ancestries Reported - Dutch (%)
Ancestries Reported - English (%)
Ancestries Reported - French (%)
Ancestries Reported - French Canadian (%)
Ancestries Reported - German (%)
Ancestries Reported - Greek (%)
Ancestries Reported - Hungarian (%)
Ancestries Reported - Irish (%)
Ancestries Reported - Italian (%)
Ancestries Reported - Lithuanian (%)
Ancestries Reported - Norwegian (%)
Ancestries Reported - Polish (%)
Ancestries Reported - Portuguese (%)
Ancestries Reported - Russian (%)
Ancestries Reported - Scotch-Irish (%)
Ancestries Reported - Scottish (%)
Ancestries Reported - Slovak (%)
Ancestries Reported - Subsaharan African (%)
Ancestries Reported - Swedish (%)
Ancestries Reported - Swiss (%)
Ancestries Reported - Ukrainian (%)
Ancestries Reported - United States (%)
Ancestries Reported - Welsh (%)
Ancestries Reported - West Indian (%)
Ancestries Reported - Other (%)
Geographical mobility - Same house 1 year ago (%)
Geographical mobility - Same house 1 year ago (%) - White
Geographical mobility - Same house 1 year ago (%) - Black or African American
Geographical mobility - Same house 1 year ago (%) - Asian
Geographical mobility - Same house 1 year ago (%) - Hispanic or Latino
Geographical mobility - Same house 1 year ago (%) - American Indian and Alaska Native
Geographical mobility - Same house 1 year ago (%) - Multirace
Geographical mobility - Same house 1 year ago (%) - Other Race
Geographical mobility - Moved within same county (%)
Geographical mobility - Moved within same county (%) - White
Geographical mobility - Moved within same county (%) - Black or African American
Geographical mobility - Moved within same county (%) - Asian
Geographical mobility - Moved within same county (%) - Hispanic or Latino
Geographical mobility - Moved within same county (%) - American Indian and Alaska Native
Geographical mobility - Moved within same county (%) - Multirace
Geographical mobility - Moved within same county (%) - Other Race
Geographical mobility - Moved from different county within same state (%)
Geographical mobility - Moved from different county within same state (%) - White
Geographical mobility - Moved from different county within same state (%) - Black or African American
Geographical mobility - Moved from different county within same state (%) - Asian
Geographical mobility - Moved from different county within same state (%) - Hispanic or Latino
Geographical mobility - Moved from different county within same state (%) - American Indian and Alaska Native
Geographical mobility - Moved from different county within same state (%) - Multirace
Geographical mobility - Moved from different county within same state (%) - Other Race
Geographical mobility - Moved from different state (%)
Geographical mobility - Moved from different state (%) - White
Geographical mobility - Moved from different state (%) - Black or African American
Geographical mobility - Moved from different state (%) - Asian
Geographical mobility - Moved from different state (%) - Hispanic or Latino
Geographical mobility - Moved from different state (%) - American Indian and Alaska Native
Geographical mobility - Moved from different state (%) - Multirace
Geographical mobility - Moved from different state (%) - Other Race
Geographical mobility - Moved from abroad (%)
Geographical mobility - Moved from abroad (%) - White
Geographical mobility - Moved from abroad (%) - Black or African American
Geographical mobility - Moved from abroad (%) - Asian
Geographical mobility - Moved from abroad (%) - Hispanic or Latino
Geographical mobility - Moved from abroad (%) - American Indian and Alaska Native
Geographical mobility - Moved from abroad (%) - Multirace
Geographical mobility - Moved from abroad (%) - Other Race
Place of birth for the foreign-born population - Ireland (%)
Place of birth for the foreign-born population - Denmark (%)
Place of birth for the foreign-born population - Norway (%)
Place of birth for the foreign-born population - Sweden (%)
Place of birth for the foreign-born population - United Kingdom (%)
Place of birth for the foreign-born population - England (%)
Place of birth for the foreign-born population - Scotland (%)
Place of birth for the foreign-born population - Other Northern Europe (%)
Place of birth for the foreign-born population - Austria (%)
Place of birth for the foreign-born population - Belgium (%)
Place of birth for the foreign-born population - France (%)
Place of birth for the foreign-born population - Germany (%)
Place of birth for the foreign-born population - Netherlands (%)
Place of birth for the foreign-born population - Switzerland (%)
Place of birth for the foreign-born population - Other Western Europe (%)
Place of birth for the foreign-born population - Greece (%)
Place of birth for the foreign-born population - Italy (%)
Place of birth for the foreign-born population - Portugal (%)
Place of birth for the foreign-born population - Spain (%)
Place of birth for the foreign-born population - Other Southern Europe (%)
Place of birth for the foreign-born population - Albania (%)
Place of birth for the foreign-born population - Belarus (%)
Place of birth for the foreign-born population - Bosnia and Herzegovina (%)
Place of birth for the foreign-born population - Bulgaria (%)
Place of birth for the foreign-born population - Croatia (%)
Place of birth for the foreign-born population - Czechoslovakia (%)
Place of birth for the foreign-born population - Hungary (%)
Place of birth for the foreign-born population - Latvia (%)
Place of birth for the foreign-born population - Lithuania (%)
Place of birth for the foreign-born population - North Macedonia (Macedonia) (%)
Place of birth for the foreign-born population - Moldova (%)
Place of birth for the foreign-born population - Poland (%)
Place of birth for the foreign-born population - Romania (%)
Place of birth for the foreign-born population - Russia (%)
Place of birth for the foreign-born population - Serbia (%)
Place of birth for the foreign-born population - Ukraine (%)
Place of birth for the foreign-born population - Other Eastern Europe (%)
Place of birth for the foreign-born population - China (%)
Place of birth for the foreign-born population - Hong Kong (%)
Place of birth for the foreign-born population - Taiwan (%)
Place of birth for the foreign-born population - Japan (%)
Place of birth for the foreign-born population - Korea (%)
Place of birth for the foreign-born population - Other Eastern Asia (%)
Place of birth for the foreign-born population - Afghanistan (%)
Place of birth for the foreign-born population - Bangladesh (%)
Place of birth for the foreign-born population - India (%)
Place of birth for the foreign-born population - Iran (%)
Place of birth for the foreign-born population - Kazakhstan (%)
Place of birth for the foreign-born population - Nepal (%)
Place of birth for the foreign-born population - Pakistan (%)
Place of birth for the foreign-born population - Sri Lanka (%)
Place of birth for the foreign-born population - Uzbekistan (%)
Place of birth for the foreign-born population - Other South Central Asia (%)
Place of birth for the foreign-born population - Burma (%)
Place of birth for the foreign-born population - Cambodia (%)
Place of birth for the foreign-born population - Indonesia (%)
Place of birth for the foreign-born population - Laos (%)
Place of birth for the foreign-born population - Malaysia (%)
Place of birth for the foreign-born population - Philippines (%)
Place of birth for the foreign-born population - Singapore (%)
Place of birth for the foreign-born population - Thailand (%)
Place of birth for the foreign-born population - Vietnam (%)
Place of birth for the foreign-born population - Other South Eastern Asia (%)
Place of birth for the foreign-born population - Armenia (%)
Place of birth for the foreign-born population - Iraq (%)
Place of birth for the foreign-born population - Israel (%)
Place of birth for the foreign-born population - Jordan (%)
Place of birth for the foreign-born population - Kuwait (%)
Place of birth for the foreign-born population - Lebanon (%)
Place of birth for the foreign-born population - Saudi Arabia (%)
Place of birth for the foreign-born population - Syria (%)
Place of birth for the foreign-born population - Turkey (%)
Place of birth for the foreign-born population - Yemen (%)
Place of birth for the foreign-born population - Other Western Asia (%)
Place of birth for the foreign-born population - Eritrea (%)
Place of birth for the foreign-born population - Ethiopia (%)
Place of birth for the foreign-born population - Kenya (%)
Place of birth for the foreign-born population - Somalia (%)
Place of birth for the foreign-born population - Uganda (%)
Place of birth for the foreign-born population - Zimbabwe (%)
Place of birth for the foreign-born population - Other Eastern Africa (%)
Place of birth for the foreign-born population - Cameroon (%)
Place of birth for the foreign-born population - Congo (%)
Place of birth for the foreign-born population - Democratic Republic of Congo (Zaire) (%)
Place of birth for the foreign-born population - Other Middle Africa (%)
Place of birth for the foreign-born population - Egypt (%)
Place of birth for the foreign-born population - Morocco (%)
Place of birth for the foreign-born population - Sudan (%)
Place of birth for the foreign-born population - Other Northern Africa (%)
Place of birth for the foreign-born population - South Africa (%)
Place of birth for the foreign-born population - Other Southern Africa (%)
Place of birth for the foreign-born population - Cabo Verde (%)
Place of birth for the foreign-born population - Ghana (%)
Place of birth for the foreign-born population - Liberia (%)
Place of birth for the foreign-born population - Nigeria (%)
Place of birth for the foreign-born population - Senegal (%)
Place of birth for the foreign-born population - Sierra Leone (%)
Place of birth for the foreign-born population - Other Western Africa (%)
Place of birth for the foreign-born population - Australia (%)
Place of birth for the foreign-born population - New Zealand (%)
Place of birth for the foreign-born population - Fiji (%)
Place of birth for the foreign-born population - Micronesia (%)
Place of birth for the foreign-born population - Bahamas (%)
Place of birth for the foreign-born population - Barbados (%)
Place of birth for the foreign-born population - Cuba (%)
Place of birth for the foreign-born population - Dominica (%)
Place of birth for the foreign-born population - Dominican Republic (%)
Place of birth for the foreign-born population - Grenada (%)
Place of birth for the foreign-born population - Haiti (%)
Place of birth for the foreign-born population - Jamaica (%)
Place of birth for the foreign-born population - St. Vincent and the Grenadines (%)
Place of birth for the foreign-born population - Trinidad and Tobago (%)
Place of birth for the foreign-born population - West Indies (%)
Place of birth for the foreign-born population - Other Caribbean (%)
Place of birth for the foreign-born population - Belize (%)
Place of birth for the foreign-born population - Costa Rica (%)
Place of birth for the foreign-born population - El Salvador (%)
Place of birth for the foreign-born population - Guatemala (%)
Place of birth for the foreign-born population - Honduras (%)
Place of birth for the foreign-born population - Mexico (%)
Place of birth for the foreign-born population - Nicaragua (%)
Place of birth for the foreign-born population - Panama (%)
Place of birth for the foreign-born population - Other Central America (%)
Place of birth for the foreign-born population - Argentina (%)
Place of birth for the foreign-born population - Bolivia (%)
Place of birth for the foreign-born population - Brazil (%)
Place of birth for the foreign-born population - Chile (%)
Place of birth for the foreign-born population - Colombia (%)
Place of birth for the foreign-born population - Ecuador (%)
Place of birth for the foreign-born population - Guyana (%)
Place of birth for the foreign-born population - Peru (%)
Place of birth for the foreign-born population - Uruguay (%)
Place of birth for the foreign-born population - Venezuela (%)
Place of birth for the foreign-born population - Other South America (%)
Place of birth for the foreign-born population - Canada (%)
Place of birth for the foreign-born population - Other Northern America (%)
Place of birth for the foreign-born population - Other (%)
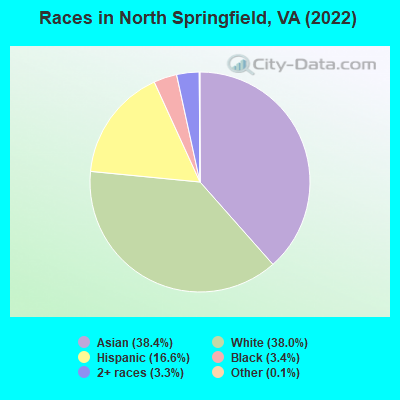
According to 2022 data, the most numerous races in North Springfield, VA are White alone (2,614 residents), Black alone (231 residents), and Hispanic (1,141 residents). 46.3% of North Springfield residents speak English at home. 35.1% of North Springfield, VA residents are foreign-born (22.1% born in Asia, 9.9% born in Latin America), which is 65.8% greater than the foreign-born rate of 12.0% across the entire state of Virginia.
Race distribution in North Springfield
2000 2022
4,965,637 70.2% White alone 1,376,378 19.4% Black alone 329,540 4.7% Hispanic 259,277 3.7% Asian alone 114,022 1.6% Two or more races 18,596 0.3% American Indian alone 11,685 0.2% Other race alone 3,380 0.05% Native Hawaiian and Other
5,095,130 58.7% White alone 1,594,785 18.4% Black alone 905,750 10.4% Hispanic 602,881 6.9% Asian alone 406,047 4.7% Two or more races 60,419 0.7% Other race alone 11,738 0.1% American Indian alone 6,869 0.08% Native Hawaiian and Other
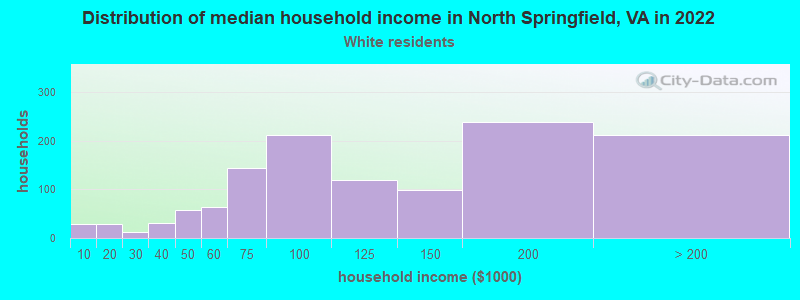
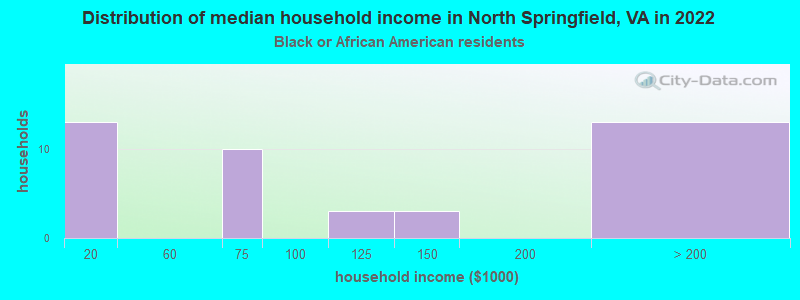
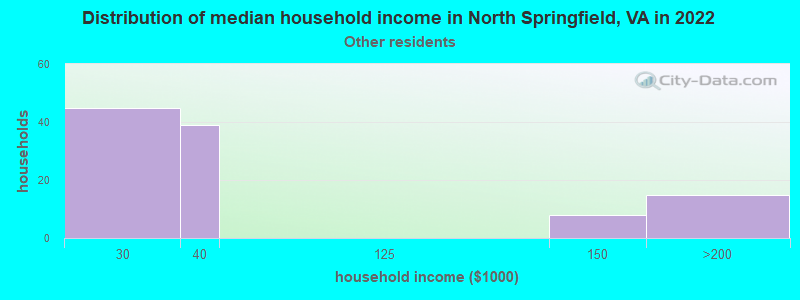
Income and house value in North Springfield Median household income in 2022 $114,686 White non-Hispanic householders$153,290 Asian householders$151,625 Two or more races householdersMedian 2022 house value $628,001 White Non-Hispanic householders$694,089 Black or African American householders $620,767 Asian householders$534,294 Native Hawaiian and other Pacific Islander householders$534,294 Some other race householders$698,692 Two or more races householders$561,584 Hispanic or Latino householders
Median age by race in North Springfield
41.1 Median age for White residents39.1 42.5 47.6 Median age for Black or African American residents46.8 41.7 29.1 Median age for American Indian / Alaska Native residents-964,539,006.1 25.8 39.2 Median age for Asian residents35.9 40.8 -666,666,666.0 Median age for Native Hawaiian / Pacific Islander residents-558,791,801.0 -584,518,166.9 37.0 Median age for Other race residents43.9 15.1 42.9 Median age for Two or more races residents45.2 33.0 47.4 Median age for White alone residents47.8 43.4 33.1 Median age for Hispanic or Latino residents34.5 32.1
Owner/renter occupied households by race in North Springfield
House owners and renters - White residents 1,016 81.8% Owner occupied227 18.2% Renter occupiedHouse owners and renters - Black or African American residents 13 31.1% Owner occupied29 68.9% Renter occupiedHouse owners and renters - American Indian / Alaska Native residents 17 100.0% Owner occupiedHouse owners and renters - Asian residents 605 97.8% Owner occupied14 2.2% Renter occupiedHouse owners and renters - Other race residents 35 32.2% Owner occupied73 67.8% Renter occupiedHouse owners and renters - Two or more races residents 127 51.0% Owner occupied122 49.0% Renter occupiedHouse owners and renters - White alone residents 1,031 85.1% Owner occupied181 14.9% Renter occupiedHouse owners and renters - Hispanic or Latino residents 106 34.5% Owner occupied201 65.5% Renter occupied
Language usage in North Springfield
English speakers - Total 46.3% of residents of North Springfield speak English at home.
15.3% of residents speak Spanish at home 521 54.3% Speak English very well438 45.7% Speak English less than very well37.9% of residents speak other language at home 1,685 70.7% Speak English very well697 29.3% Speak English less than very well
English speakers - Born in the United States 92.7% of residents of North Springfield speak English at home.
2.1% of residents speak Spanish at home 39 100.0% Speak English very well4.8% of residents speak other language at home 86 97.7% Speak English very well2 2.3% Speak English less than very well
English speakers - Native, born elsewhere 48.6% of residents of North Springfield speak English at home.
53.3% of residents speak other language at home 56 100.0% Speak English very well
English speakers - Foreign-born 7.6% of residents of North Springfield speak English at home.
25.8% of residents speak Spanish at home 215 34.5% Speak English very well409 65.5% Speak English less than very well65.5% of residents speak other language at home 971 61.3% Speak English very well612 38.7% Speak English less than very well
White (Caucasian) - Speak only English Native:
91.3% (2,109)Foreign-born:
20.2% (69)
White (Caucasian) - Speak another language Native:
8.1% (186)Foreign-born:
77.9% (266)
Black or African American - Speak only English Native:
98.0% (97)Foreign-born:
20.7% (23)
Asian - Speak only English Native:
19.0% (174)Foreign-born:
4.8% (70)
Asian - Speak another language Native:
83.6% (765)Foreign-born:
94.0% (1,372)
Other race - Speak only English Native:
5.9% (9)Foreign-born:
6.5% (14)
Other race - Speak another language Native:
82.7% (129)Foreign-born:
93.1% (196)
Two or more races - Speak another language Native:
21.6% (70)Foreign-born:
100.0% (250)
White alone - Speak only English Native:
95.9% (2,081)Foreign-born:
28.0% (75)
White alone - Speak another language Native:
4.2% (92)Foreign-born:
71.9% (192)
Hispanic or Latino - Speak only English Native:
35.7% (175)Foreign-born:
1.6% (9)
Hispanic or Latino - Speak another language Native:
62.3% (305)Foreign-born:
98.3% (543)
Foreign-born residents in North Springfield 2,413 residents are foreign born (22.1% Asia , 9.9% Latin America ).
This city:
35.1%Virginia:
12.6%
Marital status for residents in North Springfield Marital status - White (Caucasian) population 15 years and over
Males 36.9% Never married58.2% Now married0.0% Separated1.7% Widowed3.2% DivorcedFemales 24.3% Never married62.6% Now married0.0% Separated7.4% Widowed5.7% DivorcedWomen who gave birth in the past 12 months Now married:
100.0% (51)Unmarried:
0.0% (0)
Women who did not give birth in the past 12 months Now married:
51.1% (249)Unmarried:
48.9% (239)
Marital status - Black or African American population 15 years and over
Males 18.2% Never married72.7% Now married0.0% Separated0.0% Widowed9.1% DivorcedFemales 37.9% Never married26.4% Now married0.0% Separated0.0% Widowed35.6% DivorcedWomen who did not give birth in the past 12 months Now married:
17.4% (8)Unmarried:
82.6% (38)
Marital status - American Indian / Alaska Native population 15 years and over
Males 0.0% Never married100.0% Now married0.0% Separated0.0% Widowed0.0% DivorcedFemales 37.5% Never married0.0% Now married30.0% Separated0.0% Widowed32.5% DivorcedWomen who did not give birth in the past 12 months Now married:
44.4% (13)Unmarried:
55.6% (16)
Marital status - Asian population 15 years and over
Males 44.2% Never married50.5% Now married0.0% Separated2.1% Widowed3.2% DivorcedFemales 32.0% Never married43.3% Now married0.1% Separated2.0% Widowed22.6% DivorcedWomen who gave birth in the past 12 months Now married:
100.0% (13)Unmarried:
0.0% (0)
Women who did not give birth in the past 12 months Now married:
39.4% (192)Unmarried:
60.6% (295)
Marital status - Other race population 15 years and over
Males 17.8% Never married82.2% Now married0.0% Separated0.0% Widowed0.0% DivorcedFemales 0.0% Never married78.1% Now married21.9% Separated0.0% Widowed0.0% DivorcedWomen who did not give birth in the past 12 months Now married:
100.0% (68)Unmarried:
0.0% (0)
Marital status - Two or more races population 15 years and over
Males 20.9% Never married73.8% Now married0.0% Separated0.0% Widowed5.3% DivorcedFemales 51.9% Never married48.1% Now married0.0% Separated0.0% Widowed0.0% DivorcedWomen who did not give birth in the past 12 months Now married:
35.5% (29)Unmarried:
64.5% (53)
Marital status - White alone, not Hispanic / Latino population 15 years and over
Males 35.0% Never married59.2% Now married0.0% Separated2.0% Widowed3.8% DivorcedFemales 23.5% Never married62.4% Now married0.0% Separated8.0% Widowed6.1% DivorcedWomen who gave birth in the past 12 months Now married:
100.0% (55)Unmarried:
0.0% (0)
Women who did not give birth in the past 12 months Now married:
48.3% (214)Unmarried:
51.7% (230)
Marital status - Hispanic or Latino population 15 years and over
Males 30.1% Never married67.4% Now married0.0% Separated0.0% Widowed2.6% DivorcedFemales 28.1% Never married55.9% Now married10.9% Separated0.0% Widowed5.1% DivorcedWomen who did not give birth in the past 12 months Now married:
65.7% (137)Unmarried:
34.3% (72)
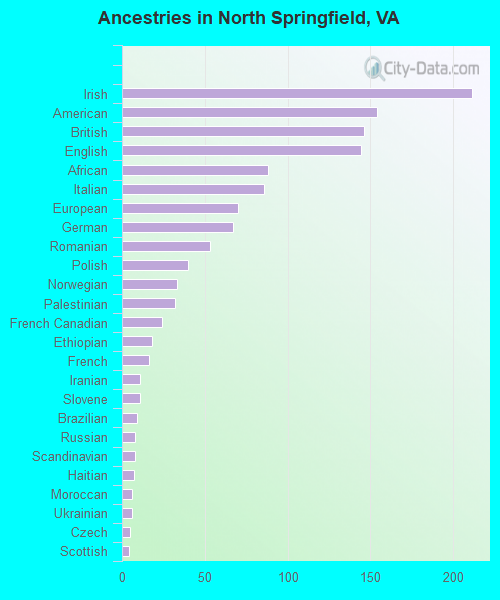
Ancestries in North Springfield
211 5.3% Irish154 3.8% American146 3.6% British144 3.6% English88 2.2% African86 2.1% Italian70 1.7% European67 1.7% German53 1.3% Romanian40 1.0% Polish33 0.8% Norwegian32 0.8% Palestinian24 0.6% French Canadian18 0.4% Ethiopian16 0.4% French11 0.3% Iranian11 0.3% Slovene9 0.2% Brazilian8 0.2% Russian8 0.2% Scandinavian7 0.2% Haitian6 0.1% Moroccan6 0.1% Ukrainian5 0.1% Czech4 0.10% Scottish4 0.10% Sierra Leonean
Children Nativity (place of birth) in North Springfield
Children under 6 years - Living with two parents Both parents native 194 100.0% NativeBoth parents foreign-born 432 100.0% NativeOne native, one foreign-born parent 22 100.0% NativeChildren under 6 years - Living with one parent Native parent 47 100.0% NativeForeign-born parent 39 100.0% NativeChildren 6 to 17 years - Living with two parents Both parents native 288 100.0% NativeBoth parents foreign-born 512 100.0% NativeOne native, one foreign-born parent 29 100.0% NativeChildren 6 to 17 years - Living with one parent Native parent 78 100.0% NativeForeign-born parent 84 51.3% Native80 48.7% Foreign-born
Grandparents responsible for own grandchildren in North Springfield
Grandparents (30 to 59 years) White / Caucasian 2 100.0% Not responsible for grandchildrenAmerican Indian / Alaska Native 12 100.0% Responsible for grandchildrenAsian 83 100.0% Not responsible for grandchildrenTwo or more races 16 100.0% Not responsible for grandchildrenWhite alone, not Hispanic / Latino 5 100.0% Not responsible for grandchildrenHispanic or Latino 10 52.2% Responsible for grandchildren9 47.8% Not responsible for grandchildren
Grandparents (60 years and over) White / Caucasian 29 100.0% Not responsible for grandchildrenAsian 26 100.0% Not responsible for grandchildrenWhite alone, not Hispanic / Latino 32 100.0% Not responsible for grandchildren