Races in North Peninsula, Florida (FL) Detailed Stats
Ancestries, Foreign-born residents, place of birth
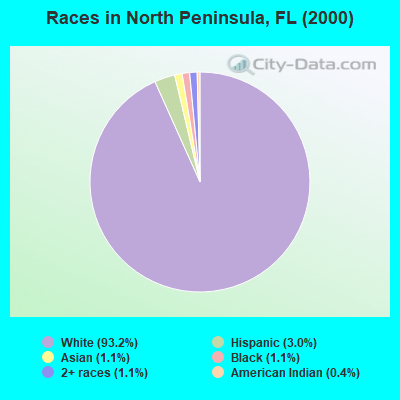
Race distribution in North Peninsula

- 26,19393.2%White alone
- 8313.0%Hispanic
- 3161.1%Black alone
- 3101.1%Two or more races
- 3231.1%Asian alone
- 990.4%American Indian alone
- 210.07%Other race alone
- 180.06%Native Hawaiian and Other
Pacific Islander alone
2000
2022
-
- 10,458,50965.4%White alone
- 2,682,71516.8%Hispanic
- 2,264,26814.2%Black alone
- 261,6931.6%Asian alone
- 236,9541.5%Two or more races
- 42,3580.3%American Indian alone
- 28,9940.2%Other race alone
- 6,8870.04%Native Hawaiian and Other
Pacific Islander alone

-
- 11,309,40350.8%White alone
- 6,025,03927.1%Hispanic
- 3,241,01514.6%Black alone
- 861,6303.9%Two or more races
- 623,6922.8%Asian alone
- 152,0540.7%Other race alone
- 22,5040.1%American Indian alone
- 9,4860.04%Native Hawaiian and Other
Pacific Islander alone

Income and house value in North Peninsula
- Median household income in 2022
- $62,033White non-Hispanic householders
- $61,970Black householders
- $44,885American Indian and Alaska Native householders
- over $200,000Asian householders
- $31,259Some other race householders
- $40,148Two or more races householders
- $43,275Hispanic or Latino race householders
- Median 2022 house value
- $344,198White Non-Hispanic householders
- $239,795Black or African American householders
- $313,578American Indian or Alaska Native householders
- $440,485Asian householders
- $415,030Native Hawaiian and other Pacific Islander householders
- $300,666Two or more races householders
- $341,984Hispanic or Latino householders
Household income for White non-Hispanic householders

Household income for Black householders

Household income for American Indian and Alaska Native householders

Household income for Asian householders

Household income for Native Hawaiian and other Pacific Islander householders

Household income for Two or more races householders

Household income for Hispanic or Latino race householders

Zip code: 32176