Races in North Olmsted, Ohio (OH) Detailed Stats
Data:
Races - White alone (%)
Races - White alone (% change since 2000)
Races - Black alone (%)
Races - Black alone (% change since 2000)
Races - American Indian alone (%)
Races - American Indian alone (% change since 2000)
Races - Asian alone (%)
Races - Asian alone (% change since 2000)
Races - Hispanic (%)
Races - Hispanic (% change since 2000)
Races - Native Hawaiian and Other Pacific Islander alone (%)
Races - Native Hawaiian and Other Pacific Islander alone (% change since 2000)
Races - Two or more races(%)
Races - Two or more races(% change since 2000)
Races - Other race alone (%)
Races - Other race alone (% change since 2000)
Racial diversity
Place of birth - Born in state of residence (%)
Place of birth - Born in state of residence (%) - White
Place of birth - Born in state of residence (%) - Black or African American
Place of birth - Born in state of residence (%) - Asian
Place of birth - Born in state of residence (%) - Hispanic or Latino
Place of birth - Born in state of residence (%) - American Indian and Alaska Native
Place of birth - Born in state of residence (%) - Multirace
Place of birth - Born in state of residence (%) - Other Race
Place of birth - Born in other state (%)
Place of birth - Born in other state (%) - White
Place of birth - Born in other state (%) - Black or African American
Place of birth - Born in other state (%) - Asian
Place of birth - Born in other state (%) - Hispanic or Latino
Place of birth - Born in other state (%) - American Indian and Alaska Native
Place of birth - Born in other state (%) - Multirace
Place of birth - Born in other state (%) - Other Race
Place of birth - Native, outside of US (%)
Place of birth - Native, outside of US (%) - White
Place of birth - Native, outside of US (%) - Black or African American
Place of birth - Native, outside of US (%) - Asian
Place of birth - Native, outside of US (%) - Hispanic or Latino
Place of birth - Native, outside of US (%) - American Indian and Alaska Native
Place of birth - Native, outside of US (%) - Multirace
Place of birth - Native, outside of US (%) - Other Race
Place of birth - Foreign born (%)
Place of birth - Foreign born (%) - White
Place of birth - Foreign born (%) - Black or African American
Place of birth - Foreign born (%) - Asian
Place of birth - Foreign born (%) - Hispanic or Latino
Place of birth - Foreign born (%) - American Indian and Alaska Native
Place of birth - Foreign born (%) - Multirace
Place of birth - Foreign born (%) - Other Race
Residents speaking English at home (%)
Residents speaking English at home - Born in the United States (%)
Residents speaking English at home - Native, born elsewhere (%)
Residents speaking English at home - Foreign born (%)
Residents speaking Spanish at home (%)
Residents speaking Spanish at home - Born in the United States (%)
Residents speaking Spanish at home - Native, born elsewhere (%)
Residents speaking Spanish at home - Foreign born (%)
Residents speaking other language at home (%)
Residents speaking other language at home - Born in the United States (%)
Residents speaking other language at home - Native, born elsewhere (%)
Residents speaking other language at home - Foreign born (%)
Marital status - Never married (%)
Marital status - Now married (%)
Marital status - Separated (%)
Marital status - Widowed (%)
Marital status - Divorced (%)
Ancestries Reported - Arab (%)
Ancestries Reported - Czech (%)
Ancestries Reported - Danish (%)
Ancestries Reported - Dutch (%)
Ancestries Reported - English (%)
Ancestries Reported - French (%)
Ancestries Reported - French Canadian (%)
Ancestries Reported - German (%)
Ancestries Reported - Greek (%)
Ancestries Reported - Hungarian (%)
Ancestries Reported - Irish (%)
Ancestries Reported - Italian (%)
Ancestries Reported - Lithuanian (%)
Ancestries Reported - Norwegian (%)
Ancestries Reported - Polish (%)
Ancestries Reported - Portuguese (%)
Ancestries Reported - Russian (%)
Ancestries Reported - Scotch-Irish (%)
Ancestries Reported - Scottish (%)
Ancestries Reported - Slovak (%)
Ancestries Reported - Subsaharan African (%)
Ancestries Reported - Swedish (%)
Ancestries Reported - Swiss (%)
Ancestries Reported - Ukrainian (%)
Ancestries Reported - United States (%)
Ancestries Reported - Welsh (%)
Ancestries Reported - West Indian (%)
Ancestries Reported - Other (%)
Geographical mobility - Same house 1 year ago (%)
Geographical mobility - Same house 1 year ago (%) - White
Geographical mobility - Same house 1 year ago (%) - Black or African American
Geographical mobility - Same house 1 year ago (%) - Asian
Geographical mobility - Same house 1 year ago (%) - Hispanic or Latino
Geographical mobility - Same house 1 year ago (%) - American Indian and Alaska Native
Geographical mobility - Same house 1 year ago (%) - Multirace
Geographical mobility - Same house 1 year ago (%) - Other Race
Geographical mobility - Moved within same county (%)
Geographical mobility - Moved within same county (%) - White
Geographical mobility - Moved within same county (%) - Black or African American
Geographical mobility - Moved within same county (%) - Asian
Geographical mobility - Moved within same county (%) - Hispanic or Latino
Geographical mobility - Moved within same county (%) - American Indian and Alaska Native
Geographical mobility - Moved within same county (%) - Multirace
Geographical mobility - Moved within same county (%) - Other Race
Geographical mobility - Moved from different county within same state (%)
Geographical mobility - Moved from different county within same state (%) - White
Geographical mobility - Moved from different county within same state (%) - Black or African American
Geographical mobility - Moved from different county within same state (%) - Asian
Geographical mobility - Moved from different county within same state (%) - Hispanic or Latino
Geographical mobility - Moved from different county within same state (%) - American Indian and Alaska Native
Geographical mobility - Moved from different county within same state (%) - Multirace
Geographical mobility - Moved from different county within same state (%) - Other Race
Geographical mobility - Moved from different state (%)
Geographical mobility - Moved from different state (%) - White
Geographical mobility - Moved from different state (%) - Black or African American
Geographical mobility - Moved from different state (%) - Asian
Geographical mobility - Moved from different state (%) - Hispanic or Latino
Geographical mobility - Moved from different state (%) - American Indian and Alaska Native
Geographical mobility - Moved from different state (%) - Multirace
Geographical mobility - Moved from different state (%) - Other Race
Geographical mobility - Moved from abroad (%)
Geographical mobility - Moved from abroad (%) - White
Geographical mobility - Moved from abroad (%) - Black or African American
Geographical mobility - Moved from abroad (%) - Asian
Geographical mobility - Moved from abroad (%) - Hispanic or Latino
Geographical mobility - Moved from abroad (%) - American Indian and Alaska Native
Geographical mobility - Moved from abroad (%) - Multirace
Geographical mobility - Moved from abroad (%) - Other Race
Place of birth for the foreign-born population - Ireland (%)
Place of birth for the foreign-born population - Denmark (%)
Place of birth for the foreign-born population - Norway (%)
Place of birth for the foreign-born population - Sweden (%)
Place of birth for the foreign-born population - United Kingdom (%)
Place of birth for the foreign-born population - England (%)
Place of birth for the foreign-born population - Scotland (%)
Place of birth for the foreign-born population - Other Northern Europe (%)
Place of birth for the foreign-born population - Austria (%)
Place of birth for the foreign-born population - Belgium (%)
Place of birth for the foreign-born population - France (%)
Place of birth for the foreign-born population - Germany (%)
Place of birth for the foreign-born population - Netherlands (%)
Place of birth for the foreign-born population - Switzerland (%)
Place of birth for the foreign-born population - Other Western Europe (%)
Place of birth for the foreign-born population - Greece (%)
Place of birth for the foreign-born population - Italy (%)
Place of birth for the foreign-born population - Portugal (%)
Place of birth for the foreign-born population - Spain (%)
Place of birth for the foreign-born population - Other Southern Europe (%)
Place of birth for the foreign-born population - Albania (%)
Place of birth for the foreign-born population - Belarus (%)
Place of birth for the foreign-born population - Bosnia and Herzegovina (%)
Place of birth for the foreign-born population - Bulgaria (%)
Place of birth for the foreign-born population - Croatia (%)
Place of birth for the foreign-born population - Czechoslovakia (%)
Place of birth for the foreign-born population - Hungary (%)
Place of birth for the foreign-born population - Latvia (%)
Place of birth for the foreign-born population - Lithuania (%)
Place of birth for the foreign-born population - North Macedonia (Macedonia) (%)
Place of birth for the foreign-born population - Moldova (%)
Place of birth for the foreign-born population - Poland (%)
Place of birth for the foreign-born population - Romania (%)
Place of birth for the foreign-born population - Russia (%)
Place of birth for the foreign-born population - Serbia (%)
Place of birth for the foreign-born population - Ukraine (%)
Place of birth for the foreign-born population - Other Eastern Europe (%)
Place of birth for the foreign-born population - China (%)
Place of birth for the foreign-born population - Hong Kong (%)
Place of birth for the foreign-born population - Taiwan (%)
Place of birth for the foreign-born population - Japan (%)
Place of birth for the foreign-born population - Korea (%)
Place of birth for the foreign-born population - Other Eastern Asia (%)
Place of birth for the foreign-born population - Afghanistan (%)
Place of birth for the foreign-born population - Bangladesh (%)
Place of birth for the foreign-born population - India (%)
Place of birth for the foreign-born population - Iran (%)
Place of birth for the foreign-born population - Kazakhstan (%)
Place of birth for the foreign-born population - Nepal (%)
Place of birth for the foreign-born population - Pakistan (%)
Place of birth for the foreign-born population - Sri Lanka (%)
Place of birth for the foreign-born population - Uzbekistan (%)
Place of birth for the foreign-born population - Other South Central Asia (%)
Place of birth for the foreign-born population - Burma (%)
Place of birth for the foreign-born population - Cambodia (%)
Place of birth for the foreign-born population - Indonesia (%)
Place of birth for the foreign-born population - Laos (%)
Place of birth for the foreign-born population - Malaysia (%)
Place of birth for the foreign-born population - Philippines (%)
Place of birth for the foreign-born population - Singapore (%)
Place of birth for the foreign-born population - Thailand (%)
Place of birth for the foreign-born population - Vietnam (%)
Place of birth for the foreign-born population - Other South Eastern Asia (%)
Place of birth for the foreign-born population - Armenia (%)
Place of birth for the foreign-born population - Iraq (%)
Place of birth for the foreign-born population - Israel (%)
Place of birth for the foreign-born population - Jordan (%)
Place of birth for the foreign-born population - Kuwait (%)
Place of birth for the foreign-born population - Lebanon (%)
Place of birth for the foreign-born population - Saudi Arabia (%)
Place of birth for the foreign-born population - Syria (%)
Place of birth for the foreign-born population - Turkey (%)
Place of birth for the foreign-born population - Yemen (%)
Place of birth for the foreign-born population - Other Western Asia (%)
Place of birth for the foreign-born population - Eritrea (%)
Place of birth for the foreign-born population - Ethiopia (%)
Place of birth for the foreign-born population - Kenya (%)
Place of birth for the foreign-born population - Somalia (%)
Place of birth for the foreign-born population - Uganda (%)
Place of birth for the foreign-born population - Zimbabwe (%)
Place of birth for the foreign-born population - Other Eastern Africa (%)
Place of birth for the foreign-born population - Cameroon (%)
Place of birth for the foreign-born population - Congo (%)
Place of birth for the foreign-born population - Democratic Republic of Congo (Zaire) (%)
Place of birth for the foreign-born population - Other Middle Africa (%)
Place of birth for the foreign-born population - Egypt (%)
Place of birth for the foreign-born population - Morocco (%)
Place of birth for the foreign-born population - Sudan (%)
Place of birth for the foreign-born population - Other Northern Africa (%)
Place of birth for the foreign-born population - South Africa (%)
Place of birth for the foreign-born population - Other Southern Africa (%)
Place of birth for the foreign-born population - Cabo Verde (%)
Place of birth for the foreign-born population - Ghana (%)
Place of birth for the foreign-born population - Liberia (%)
Place of birth for the foreign-born population - Nigeria (%)
Place of birth for the foreign-born population - Senegal (%)
Place of birth for the foreign-born population - Sierra Leone (%)
Place of birth for the foreign-born population - Other Western Africa (%)
Place of birth for the foreign-born population - Australia (%)
Place of birth for the foreign-born population - New Zealand (%)
Place of birth for the foreign-born population - Fiji (%)
Place of birth for the foreign-born population - Micronesia (%)
Place of birth for the foreign-born population - Bahamas (%)
Place of birth for the foreign-born population - Barbados (%)
Place of birth for the foreign-born population - Cuba (%)
Place of birth for the foreign-born population - Dominica (%)
Place of birth for the foreign-born population - Dominican Republic (%)
Place of birth for the foreign-born population - Grenada (%)
Place of birth for the foreign-born population - Haiti (%)
Place of birth for the foreign-born population - Jamaica (%)
Place of birth for the foreign-born population - St. Vincent and the Grenadines (%)
Place of birth for the foreign-born population - Trinidad and Tobago (%)
Place of birth for the foreign-born population - West Indies (%)
Place of birth for the foreign-born population - Other Caribbean (%)
Place of birth for the foreign-born population - Belize (%)
Place of birth for the foreign-born population - Costa Rica (%)
Place of birth for the foreign-born population - El Salvador (%)
Place of birth for the foreign-born population - Guatemala (%)
Place of birth for the foreign-born population - Honduras (%)
Place of birth for the foreign-born population - Mexico (%)
Place of birth for the foreign-born population - Nicaragua (%)
Place of birth for the foreign-born population - Panama (%)
Place of birth for the foreign-born population - Other Central America (%)
Place of birth for the foreign-born population - Argentina (%)
Place of birth for the foreign-born population - Bolivia (%)
Place of birth for the foreign-born population - Brazil (%)
Place of birth for the foreign-born population - Chile (%)
Place of birth for the foreign-born population - Colombia (%)
Place of birth for the foreign-born population - Ecuador (%)
Place of birth for the foreign-born population - Guyana (%)
Place of birth for the foreign-born population - Peru (%)
Place of birth for the foreign-born population - Uruguay (%)
Place of birth for the foreign-born population - Venezuela (%)
Place of birth for the foreign-born population - Other South America (%)
Place of birth for the foreign-born population - Canada (%)
Place of birth for the foreign-born population - Other Northern America (%)
Place of birth for the foreign-born population - Other (%)
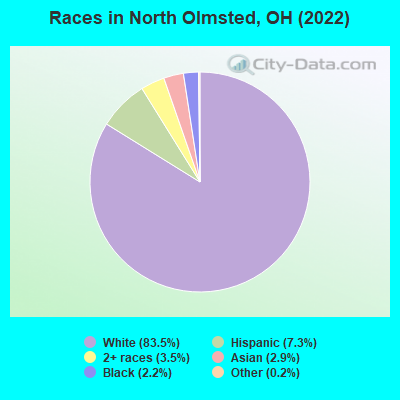
According to 2022 data, the most numerous races in North Olmsted, OH are White alone (26,469 residents), Black alone (689 residents), and Two or more races (1,113 residents). 86.1% of North Olmsted residents speak English at home. 10.3% of North Olmsted, OH residents are foreign-born (4.2% born in Asia, 3.6% born in Europe, 1.0% born in Latin America), which is 61.2% greater than the foreign-born rate of 4.0% across the entire state of Ohio.
Race distribution in North Olmsted
2000 2022
9,538,111 84.0% White alone 1,290,662 11.4% Black alone 217,123 1.9% Hispanic 137,770 1.2% Two or more races 131,670 1.2% Asian alone 21,985 0.2% American Indian alone 13,483 0.1% Other race alone 2,336 0.02% Native Hawaiian and Other
8,948,793 76.1% White alone 1,401,403 11.9% Black alone 529,291 4.5% Two or more races 517,232 4.4% Hispanic 293,387 2.5% Asian alone 52,805 0.4% Other race alone 9,785 0.08% American Indian alone 3,362 0.03% Native Hawaiian and Other
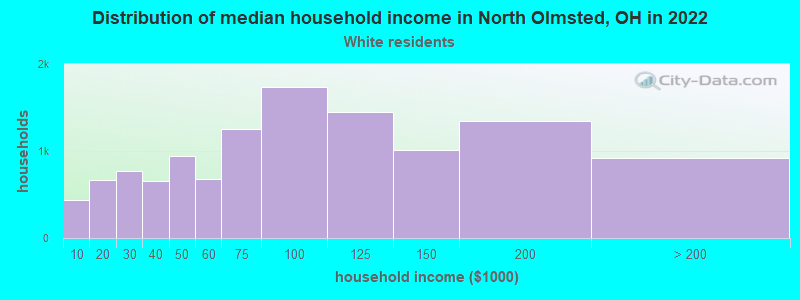
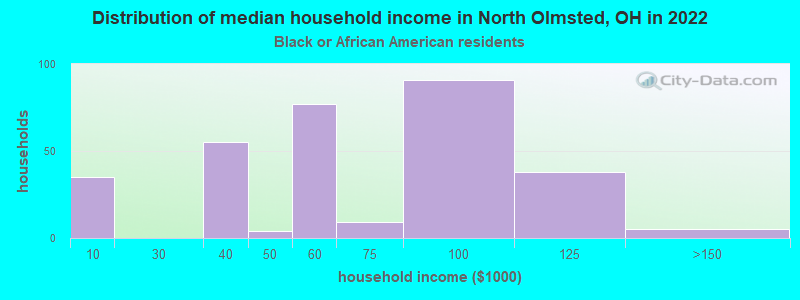
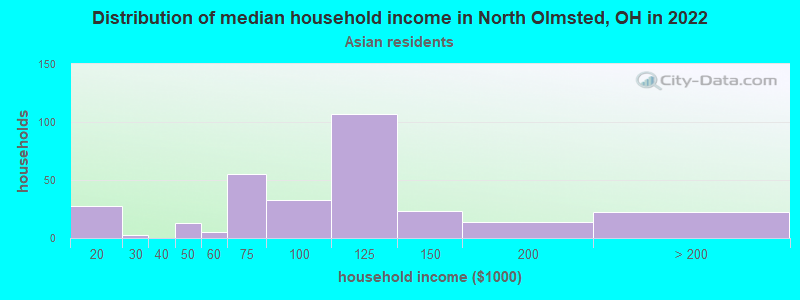
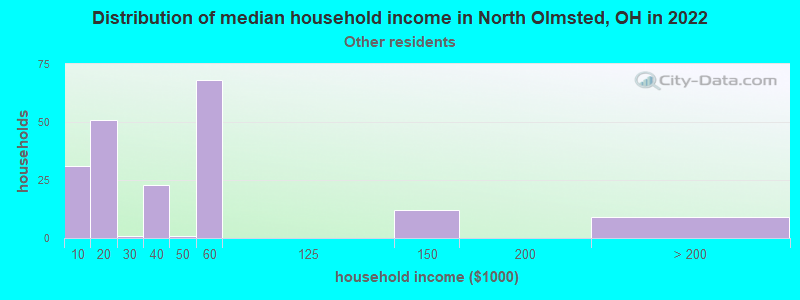
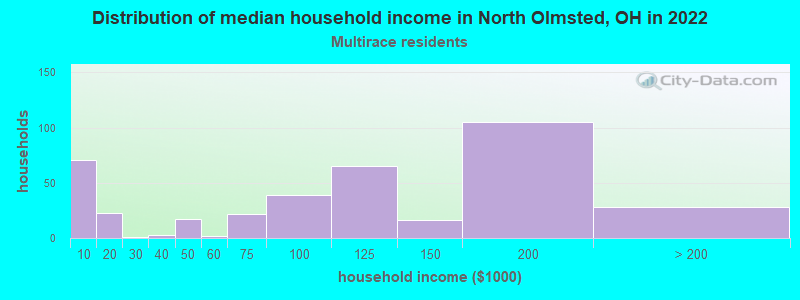
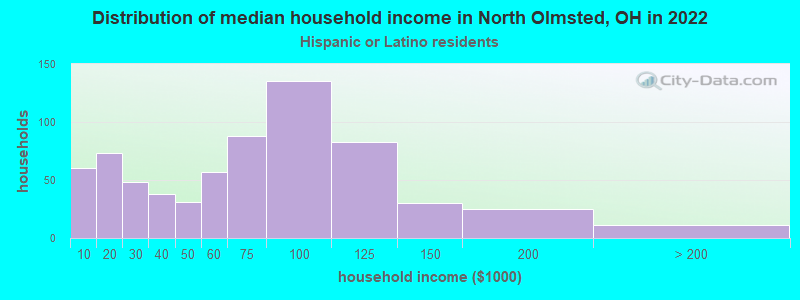
Income and house value in North Olmsted Median household income in 2022 $81,849 White non-Hispanic householders$61,024 Black householders$104,195 Asian householders$104,277 Two or more races householders$70,202 Hispanic or Latino race householdersMedian 2022 house value $215,420 White Non-Hispanic householders$198,907 Black or African American householders $237,538 Asian householders$161,035 Some other race householders$216,026 Two or more races householders$218,904 Hispanic or Latino householders
Median age by race in North Olmsted
46.2 Median age for White residents45.3 48.1 33.4 Median age for Black or African American residents27.1 44.9 -545,601,290.8 Median age for American Indian / Alaska Native residents-734,374,999.3 -499,999,999.5 47.2 Median age for Asian residents48.9 41.9 31.0 Median age for Native Hawaiian / Pacific Islander residents-750,242,953.6 -805,394,989.6 34.7 Median age for Other race residents27.9 35.9 17.4 Median age for Two or more races residents18.4 17.2 46.5 Median age for White alone residents45.3 48.7 24.2 Median age for Hispanic or Latino residents30.9 16.3
Owner/renter occupied households by race in North Olmsted
House owners and renters - White residents 9,473 79.4% Owner occupied2,463 20.6% Renter occupiedHouse owners and renters - Black or African American residents 116 39.6% Owner occupied177 60.4% Renter occupiedHouse owners and renters - Asian residents 268 84.9% Owner occupied48 15.1% Renter occupiedHouse owners and renters - Native Hawaiian / Pacific Islander residents 6 100.0% Owner occupiedHouse owners and renters - Other race residents 45 23.4% Owner occupied146 76.6% Renter occupiedHouse owners and renters - Two or more races residents 308 78.5% Owner occupied84 21.5% Renter occupiedHouse owners and renters - White alone residents 9,341 79.7% Owner occupied2,386 20.3% Renter occupiedHouse owners and renters - Hispanic or Latino residents 386 54.1% Owner occupied327 45.9% Renter occupied
Language usage in North Olmsted
English speakers - Total 86.1% of residents of North Olmsted speak English at home.
2.9% of residents speak Spanish at home 499 57.4% Speak English very well370 42.6% Speak English less than very well11.1% of residents speak other language at home 2,116 62.7% Speak English very well1,259 37.3% Speak English less than very well
English speakers - Born in the United States 92.0% of residents of North Olmsted speak English at home.
2.4% of residents speak Spanish at home 78 73.6% Speak English very well28 26.4% Speak English less than very well6.0% of residents speak other language at home 232 89.2% Speak English very well28 10.8% Speak English less than very well
English speakers - Native, born elsewhere 63.6% of residents of North Olmsted speak English at home.
28.2% of residents speak Spanish at home 149 59.1% Speak English very well103 40.9% Speak English less than very well12.6% of residents speak other language at home 6 5.3% Speak English very well107 94.7% Speak English less than very well
English speakers - Foreign-born 16.9% of residents of North Olmsted speak English at home.
11.8% of residents speak Spanish at home 110 29.9% Speak English very well258 70.1% Speak English less than very well71.4% of residents speak other language at home 1,278 57.2% Speak English very well956 42.8% Speak English less than very well
White (Caucasian) - Speak only English Native:
96.5% (22,866)Foreign-born:
21.8% (463)
White (Caucasian) - Speak another language Native:
3.6% (857)Foreign-born:
78.1% (1,660)
Black or African American - Speak only English Native:
90.0% (626)Foreign-born:
29.9% (18)
Black or African American - Speak another language Native:
7.2% (50)Foreign-born:
61.5% (37)
Asian - Speak only English Native:
68.2% (307)Foreign-born:
8.6% (43)
Asian - Speak another language Native:
29.3% (132)Foreign-born:
91.4% (463)
Other race - Speak only English Native:
45.0% (138)Foreign-born:
1.8% (2)
Other race - Speak another language Native:
51.4% (158)Foreign-born:
100.0% (107)
Two or more races - Speak another language Native:
16.1% (314)Foreign-born:
100.0% (136)
White alone - Speak only English Native:
96.0% (22,421)Foreign-born:
23.3% (470)
White alone - Speak another language Native:
4.0% (927)Foreign-born:
76.7% (1,550)
Hispanic or Latino - Speak only English Native:
70.4% (1,235)Foreign-born:
0.4% (2)
Hispanic or Latino - Speak another language Native:
30.5% (535)Foreign-born:
100.0% (377)
Foreign-born residents in North Olmsted 3,266 residents are foreign born (4.2% Asia , 3.6% Europe , 1.0% Latin America ).
Marital status for residents in North Olmsted Marital status - White (Caucasian) population 15 years and over
Males 32.4% Never married54.9% Now married0.5% Separated3.3% Widowed8.8% DivorcedFemales 25.2% Never married52.2% Now married0.4% Separated10.9% Widowed11.4% DivorcedWomen who gave birth in the past 12 months Now married:
90.4% (293)Unmarried:
9.6% (31)
Women who did not give birth in the past 12 months Now married:
45.9% (2,227)Unmarried:
54.1% (2,629)
Marital status - Black or African American population 15 years and over
Males 58.3% Never married20.7% Now married0.0% Separated1.3% Widowed19.7% DivorcedFemales 15.2% Never married37.9% Now married19.1% Separated7.0% Widowed20.7% DivorcedWomen who did not give birth in the past 12 months Now married:
69.5% (90)Unmarried:
30.5% (40)
Marital status - American Indian / Alaska Native population 15 years and over
Males 0.0% Never married0.0% Now married0.0% Separated0.0% Widowed100.0% DivorcedFemales 0.0% Never married100.0% Now married0.0% Separated0.0% Widowed0.0% DivorcedMarital status - Asian population 15 years and over
Males 12.0% Never married88.0% Now married0.0% Separated0.0% Widowed0.0% DivorcedFemales 25.3% Never married72.3% Now married0.0% Separated2.4% Widowed0.0% DivorcedWomen who gave birth in the past 12 months Now married:
100.0% (7)Unmarried:
0.0% (0)
Women who did not give birth in the past 12 months Now married:
64.4% (135)Unmarried:
35.6% (75)
Marital status - Native Hawaiian / Pacific Islander population 15 years and over
Males 0.0% Never married100.0% Now married0.0% Separated0.0% Widowed0.0% DivorcedFemales 57.1% Never married42.9% Now married0.0% Separated0.0% Widowed0.0% DivorcedWomen who did not give birth in the past 12 months Now married:
42.9% (6)Unmarried:
57.1% (8)
Marital status - Other race population 15 years and over
Males 75.8% Never married24.2% Now married0.0% Separated0.0% Widowed0.0% DivorcedFemales 10.5% Never married79.0% Now married0.0% Separated0.0% Widowed10.5% DivorcedWomen who did not give birth in the past 12 months Now married:
83.9% (104)Unmarried:
16.1% (20)
Marital status - Two or more races population 15 years and over
Males 53.4% Never married39.9% Now married0.0% Separated0.0% Widowed6.7% DivorcedFemales 57.6% Never married37.4% Now married1.0% Separated2.6% Widowed1.4% DivorcedWomen who gave birth in the past 12 months Now married:
32.0% (9)Unmarried:
68.0% (20)
Women who did not give birth in the past 12 months Now married:
21.4% (124)Unmarried:
78.6% (455)
Marital status - White alone, not Hispanic / Latino population 15 years and over
Males 31.8% Never married55.1% Now married0.5% Separated3.4% Widowed9.1% DivorcedFemales 25.1% Never married51.9% Now married0.4% Separated11.0% Widowed11.6% DivorcedWomen who gave birth in the past 12 months Now married:
87.7% (228)Unmarried:
12.3% (32)
Women who did not give birth in the past 12 months Now married:
45.9% (2,225)Unmarried:
54.1% (2,621)
Marital status - Hispanic or Latino population 15 years and over
Males 52.3% Never married47.7% Now married0.0% Separated0.0% Widowed0.0% DivorcedFemales 48.2% Never married47.1% Now married0.0% Separated1.8% Widowed2.9% DivorcedWomen who gave birth in the past 12 months Now married:
100.0% (79)Unmarried:
0.0% (0)
Women who did not give birth in the past 12 months Now married:
31.0% (174)Unmarried:
69.0% (387)
Ancestries in North Olmsted
1,497 11.4% Irish1,451 11.0% German794 6.0% American686 5.2% Polish607 4.6% Italian597 4.5% English485 3.7% Palestinian368 2.8% Scottish313 2.4% Hungarian274 2.1% Slovak261 2.0% Albanian245 1.9% European244 1.9% Lebanese211 1.6% Arab188 1.4% Greek178 1.4% Romanian135 1.0% Egyptian133 1.0% Somali96 0.7% Jordanian89 0.7% British77 0.6% Dutch75 0.6% Iraqi69 0.5% Slovene64 0.5% Croatian63 0.5% Israeli54 0.4% Eastern European52 0.4% Czech50 0.4% Scotch-Irish48 0.4% African40 0.3% Ukrainian40 0.3% French39 0.3% Norwegian30 0.2% Yugoslavian19 0.1% Swiss18 0.1% Brazilian18 0.1% Russian18 0.1% Lithuanian17 0.1% Iranian17 0.1% French Canadian16 0.1% Moroccan15 0.1% Austrian15 0.1% Danish14 0.1% Northern European11 0.08% Scandinavian10 0.08% Czechoslovakian9 0.07% Serbian8 0.06% Macedonian8 0.06% Slavic7 0.05% Latvian7 0.05% Swedish7 0.05% Welsh6 0.05% Celtic6 0.05% Finnish3 0.02% Canadian2 0.02% Syrian
Geographical mobility in North Olmsted Same house 1 year ago 23,883 89.2% White (Caucasian)760 97.2% Black or African American10 100.0% American Indian / Alaska Native898 96.4% Asian21 100.0% Native Hawaiian / Pacific Islander405 83.0% Other race2,134 98.6% Two or more races23,321 88.7% White alone, not Hispanic / Latino2,105 93.9% Hispanic or LatinoMoved within same county 1,650 6.2% White / Caucasian22 2.8% Black or African American6 0.6% Asian30 6.1% Other race29 1.3% Two or more races1,702 6.5% White alone, not Hispanic / Latino33 1.5% Hispanic or LatinoMoved within same state 436 1.6% White / Caucasian8 0.4% Two or more races427 1.6% White alone, not Hispanic / Latino14 0.6% Hispanic or LatinoMoved from different state 365 1.4% White / Caucasian5 0.6% Asian23 4.7% Other race377 1.4% White alone, not Hispanic / Latino45 2.0% Hispanic or LatinoMoved from abroad 314 1.2% White9 1.0% Asian407 1.5% White alone, not Hispanic / Latino
Children Nativity (place of birth) in North Olmsted
Children under 6 years - Living with two parents Both parents native 952 100.0% NativeBoth parents foreign-born 153 93.8% Native10 6.2% Foreign-bornOne native, one foreign-born parent 122 100.0% NativeChildren under 6 years - Living with one parent Native parent 338 100.0% NativeChildren 6 to 17 years - Living with two parents Both parents native 2,503 100.0% NativeBoth parents foreign-born 323 61.8% Native200 38.2% Foreign-bornOne native, one foreign-born parent 547 98.7% Native7 1.3% Foreign-bornChildren 6 to 17 years - Living with one parent Native parent 1,211 100.0% NativeForeign-born parent 245 53.9% Native209 46.1% Foreign-born
Grandparents responsible for own grandchildren in North Olmsted
Grandparents (30 to 59 years) White / Caucasian 101 83.6% Responsible for grandchildren20 16.4% Not responsible for grandchildrenBlack or African American 18 100.0% Responsible for grandchildrenAsian 45 100.0% Responsible for grandchildrenOther race 1 100.0% Responsible for grandchildrenWhite alone, not Hispanic / Latino 106 84.4% Responsible for grandchildren20 15.6% Not responsible for grandchildrenHispanic or Latino 1 100.0% Responsible for grandchildrenGrandparents (60 years and over) White / Caucasian 76 43.1% Responsible for grandchildren101 56.9% Not responsible for grandchildrenAsian 23 71.7% Responsible for grandchildren9 28.3% Not responsible for grandchildrenWhite alone, not Hispanic / Latino 78 42.6% Responsible for grandchildren105 57.4% Not responsible for grandchildren