Races in North New Hyde Park, New York (NY) Detailed Stats
Data:
Races - White alone (%)
Races - White alone (% change since 2000)
Races - Black alone (%)
Races - Black alone (% change since 2000)
Races - American Indian alone (%)
Races - American Indian alone (% change since 2000)
Races - Asian alone (%)
Races - Asian alone (% change since 2000)
Races - Hispanic (%)
Races - Hispanic (% change since 2000)
Races - Native Hawaiian and Other Pacific Islander alone (%)
Races - Native Hawaiian and Other Pacific Islander alone (% change since 2000)
Races - Two or more races(%)
Races - Two or more races(% change since 2000)
Races - Other race alone (%)
Races - Other race alone (% change since 2000)
Racial diversity
Place of birth - Born in state of residence (%)
Place of birth - Born in state of residence (%) - White
Place of birth - Born in state of residence (%) - Black or African American
Place of birth - Born in state of residence (%) - Asian
Place of birth - Born in state of residence (%) - Hispanic or Latino
Place of birth - Born in state of residence (%) - American Indian and Alaska Native
Place of birth - Born in state of residence (%) - Multirace
Place of birth - Born in state of residence (%) - Other Race
Place of birth - Born in other state (%)
Place of birth - Born in other state (%) - White
Place of birth - Born in other state (%) - Black or African American
Place of birth - Born in other state (%) - Asian
Place of birth - Born in other state (%) - Hispanic or Latino
Place of birth - Born in other state (%) - American Indian and Alaska Native
Place of birth - Born in other state (%) - Multirace
Place of birth - Born in other state (%) - Other Race
Place of birth - Native, outside of US (%)
Place of birth - Native, outside of US (%) - White
Place of birth - Native, outside of US (%) - Black or African American
Place of birth - Native, outside of US (%) - Asian
Place of birth - Native, outside of US (%) - Hispanic or Latino
Place of birth - Native, outside of US (%) - American Indian and Alaska Native
Place of birth - Native, outside of US (%) - Multirace
Place of birth - Native, outside of US (%) - Other Race
Place of birth - Foreign born (%)
Place of birth - Foreign born (%) - White
Place of birth - Foreign born (%) - Black or African American
Place of birth - Foreign born (%) - Asian
Place of birth - Foreign born (%) - Hispanic or Latino
Place of birth - Foreign born (%) - American Indian and Alaska Native
Place of birth - Foreign born (%) - Multirace
Place of birth - Foreign born (%) - Other Race
Residents speaking English at home (%)
Residents speaking English at home - Born in the United States (%)
Residents speaking English at home - Native, born elsewhere (%)
Residents speaking English at home - Foreign born (%)
Residents speaking Spanish at home (%)
Residents speaking Spanish at home - Born in the United States (%)
Residents speaking Spanish at home - Native, born elsewhere (%)
Residents speaking Spanish at home - Foreign born (%)
Residents speaking other language at home (%)
Residents speaking other language at home - Born in the United States (%)
Residents speaking other language at home - Native, born elsewhere (%)
Residents speaking other language at home - Foreign born (%)
Marital status - Never married (%)
Marital status - Now married (%)
Marital status - Separated (%)
Marital status - Widowed (%)
Marital status - Divorced (%)
Ancestries Reported - Arab (%)
Ancestries Reported - Czech (%)
Ancestries Reported - Danish (%)
Ancestries Reported - Dutch (%)
Ancestries Reported - English (%)
Ancestries Reported - French (%)
Ancestries Reported - French Canadian (%)
Ancestries Reported - German (%)
Ancestries Reported - Greek (%)
Ancestries Reported - Hungarian (%)
Ancestries Reported - Irish (%)
Ancestries Reported - Italian (%)
Ancestries Reported - Lithuanian (%)
Ancestries Reported - Norwegian (%)
Ancestries Reported - Polish (%)
Ancestries Reported - Portuguese (%)
Ancestries Reported - Russian (%)
Ancestries Reported - Scotch-Irish (%)
Ancestries Reported - Scottish (%)
Ancestries Reported - Slovak (%)
Ancestries Reported - Subsaharan African (%)
Ancestries Reported - Swedish (%)
Ancestries Reported - Swiss (%)
Ancestries Reported - Ukrainian (%)
Ancestries Reported - United States (%)
Ancestries Reported - Welsh (%)
Ancestries Reported - West Indian (%)
Ancestries Reported - Other (%)
Geographical mobility - Same house 1 year ago (%)
Geographical mobility - Same house 1 year ago (%) - White
Geographical mobility - Same house 1 year ago (%) - Black or African American
Geographical mobility - Same house 1 year ago (%) - Asian
Geographical mobility - Same house 1 year ago (%) - Hispanic or Latino
Geographical mobility - Same house 1 year ago (%) - American Indian and Alaska Native
Geographical mobility - Same house 1 year ago (%) - Multirace
Geographical mobility - Same house 1 year ago (%) - Other Race
Geographical mobility - Moved within same county (%)
Geographical mobility - Moved within same county (%) - White
Geographical mobility - Moved within same county (%) - Black or African American
Geographical mobility - Moved within same county (%) - Asian
Geographical mobility - Moved within same county (%) - Hispanic or Latino
Geographical mobility - Moved within same county (%) - American Indian and Alaska Native
Geographical mobility - Moved within same county (%) - Multirace
Geographical mobility - Moved within same county (%) - Other Race
Geographical mobility - Moved from different county within same state (%)
Geographical mobility - Moved from different county within same state (%) - White
Geographical mobility - Moved from different county within same state (%) - Black or African American
Geographical mobility - Moved from different county within same state (%) - Asian
Geographical mobility - Moved from different county within same state (%) - Hispanic or Latino
Geographical mobility - Moved from different county within same state (%) - American Indian and Alaska Native
Geographical mobility - Moved from different county within same state (%) - Multirace
Geographical mobility - Moved from different county within same state (%) - Other Race
Geographical mobility - Moved from different state (%)
Geographical mobility - Moved from different state (%) - White
Geographical mobility - Moved from different state (%) - Black or African American
Geographical mobility - Moved from different state (%) - Asian
Geographical mobility - Moved from different state (%) - Hispanic or Latino
Geographical mobility - Moved from different state (%) - American Indian and Alaska Native
Geographical mobility - Moved from different state (%) - Multirace
Geographical mobility - Moved from different state (%) - Other Race
Geographical mobility - Moved from abroad (%)
Geographical mobility - Moved from abroad (%) - White
Geographical mobility - Moved from abroad (%) - Black or African American
Geographical mobility - Moved from abroad (%) - Asian
Geographical mobility - Moved from abroad (%) - Hispanic or Latino
Geographical mobility - Moved from abroad (%) - American Indian and Alaska Native
Geographical mobility - Moved from abroad (%) - Multirace
Geographical mobility - Moved from abroad (%) - Other Race
Place of birth for the foreign-born population - Ireland (%)
Place of birth for the foreign-born population - Denmark (%)
Place of birth for the foreign-born population - Norway (%)
Place of birth for the foreign-born population - Sweden (%)
Place of birth for the foreign-born population - United Kingdom (%)
Place of birth for the foreign-born population - England (%)
Place of birth for the foreign-born population - Scotland (%)
Place of birth for the foreign-born population - Other Northern Europe (%)
Place of birth for the foreign-born population - Austria (%)
Place of birth for the foreign-born population - Belgium (%)
Place of birth for the foreign-born population - France (%)
Place of birth for the foreign-born population - Germany (%)
Place of birth for the foreign-born population - Netherlands (%)
Place of birth for the foreign-born population - Switzerland (%)
Place of birth for the foreign-born population - Other Western Europe (%)
Place of birth for the foreign-born population - Greece (%)
Place of birth for the foreign-born population - Italy (%)
Place of birth for the foreign-born population - Portugal (%)
Place of birth for the foreign-born population - Spain (%)
Place of birth for the foreign-born population - Other Southern Europe (%)
Place of birth for the foreign-born population - Albania (%)
Place of birth for the foreign-born population - Belarus (%)
Place of birth for the foreign-born population - Bosnia and Herzegovina (%)
Place of birth for the foreign-born population - Bulgaria (%)
Place of birth for the foreign-born population - Croatia (%)
Place of birth for the foreign-born population - Czechoslovakia (%)
Place of birth for the foreign-born population - Hungary (%)
Place of birth for the foreign-born population - Latvia (%)
Place of birth for the foreign-born population - Lithuania (%)
Place of birth for the foreign-born population - North Macedonia (Macedonia) (%)
Place of birth for the foreign-born population - Moldova (%)
Place of birth for the foreign-born population - Poland (%)
Place of birth for the foreign-born population - Romania (%)
Place of birth for the foreign-born population - Russia (%)
Place of birth for the foreign-born population - Serbia (%)
Place of birth for the foreign-born population - Ukraine (%)
Place of birth for the foreign-born population - Other Eastern Europe (%)
Place of birth for the foreign-born population - China (%)
Place of birth for the foreign-born population - Hong Kong (%)
Place of birth for the foreign-born population - Taiwan (%)
Place of birth for the foreign-born population - Japan (%)
Place of birth for the foreign-born population - Korea (%)
Place of birth for the foreign-born population - Other Eastern Asia (%)
Place of birth for the foreign-born population - Afghanistan (%)
Place of birth for the foreign-born population - Bangladesh (%)
Place of birth for the foreign-born population - India (%)
Place of birth for the foreign-born population - Iran (%)
Place of birth for the foreign-born population - Kazakhstan (%)
Place of birth for the foreign-born population - Nepal (%)
Place of birth for the foreign-born population - Pakistan (%)
Place of birth for the foreign-born population - Sri Lanka (%)
Place of birth for the foreign-born population - Uzbekistan (%)
Place of birth for the foreign-born population - Other South Central Asia (%)
Place of birth for the foreign-born population - Burma (%)
Place of birth for the foreign-born population - Cambodia (%)
Place of birth for the foreign-born population - Indonesia (%)
Place of birth for the foreign-born population - Laos (%)
Place of birth for the foreign-born population - Malaysia (%)
Place of birth for the foreign-born population - Philippines (%)
Place of birth for the foreign-born population - Singapore (%)
Place of birth for the foreign-born population - Thailand (%)
Place of birth for the foreign-born population - Vietnam (%)
Place of birth for the foreign-born population - Other South Eastern Asia (%)
Place of birth for the foreign-born population - Armenia (%)
Place of birth for the foreign-born population - Iraq (%)
Place of birth for the foreign-born population - Israel (%)
Place of birth for the foreign-born population - Jordan (%)
Place of birth for the foreign-born population - Kuwait (%)
Place of birth for the foreign-born population - Lebanon (%)
Place of birth for the foreign-born population - Saudi Arabia (%)
Place of birth for the foreign-born population - Syria (%)
Place of birth for the foreign-born population - Turkey (%)
Place of birth for the foreign-born population - Yemen (%)
Place of birth for the foreign-born population - Other Western Asia (%)
Place of birth for the foreign-born population - Eritrea (%)
Place of birth for the foreign-born population - Ethiopia (%)
Place of birth for the foreign-born population - Kenya (%)
Place of birth for the foreign-born population - Somalia (%)
Place of birth for the foreign-born population - Uganda (%)
Place of birth for the foreign-born population - Zimbabwe (%)
Place of birth for the foreign-born population - Other Eastern Africa (%)
Place of birth for the foreign-born population - Cameroon (%)
Place of birth for the foreign-born population - Congo (%)
Place of birth for the foreign-born population - Democratic Republic of Congo (Zaire) (%)
Place of birth for the foreign-born population - Other Middle Africa (%)
Place of birth for the foreign-born population - Egypt (%)
Place of birth for the foreign-born population - Morocco (%)
Place of birth for the foreign-born population - Sudan (%)
Place of birth for the foreign-born population - Other Northern Africa (%)
Place of birth for the foreign-born population - South Africa (%)
Place of birth for the foreign-born population - Other Southern Africa (%)
Place of birth for the foreign-born population - Cabo Verde (%)
Place of birth for the foreign-born population - Ghana (%)
Place of birth for the foreign-born population - Liberia (%)
Place of birth for the foreign-born population - Nigeria (%)
Place of birth for the foreign-born population - Senegal (%)
Place of birth for the foreign-born population - Sierra Leone (%)
Place of birth for the foreign-born population - Other Western Africa (%)
Place of birth for the foreign-born population - Australia (%)
Place of birth for the foreign-born population - New Zealand (%)
Place of birth for the foreign-born population - Fiji (%)
Place of birth for the foreign-born population - Micronesia (%)
Place of birth for the foreign-born population - Bahamas (%)
Place of birth for the foreign-born population - Barbados (%)
Place of birth for the foreign-born population - Cuba (%)
Place of birth for the foreign-born population - Dominica (%)
Place of birth for the foreign-born population - Dominican Republic (%)
Place of birth for the foreign-born population - Grenada (%)
Place of birth for the foreign-born population - Haiti (%)
Place of birth for the foreign-born population - Jamaica (%)
Place of birth for the foreign-born population - St. Vincent and the Grenadines (%)
Place of birth for the foreign-born population - Trinidad and Tobago (%)
Place of birth for the foreign-born population - West Indies (%)
Place of birth for the foreign-born population - Other Caribbean (%)
Place of birth for the foreign-born population - Belize (%)
Place of birth for the foreign-born population - Costa Rica (%)
Place of birth for the foreign-born population - El Salvador (%)
Place of birth for the foreign-born population - Guatemala (%)
Place of birth for the foreign-born population - Honduras (%)
Place of birth for the foreign-born population - Mexico (%)
Place of birth for the foreign-born population - Nicaragua (%)
Place of birth for the foreign-born population - Panama (%)
Place of birth for the foreign-born population - Other Central America (%)
Place of birth for the foreign-born population - Argentina (%)
Place of birth for the foreign-born population - Bolivia (%)
Place of birth for the foreign-born population - Brazil (%)
Place of birth for the foreign-born population - Chile (%)
Place of birth for the foreign-born population - Colombia (%)
Place of birth for the foreign-born population - Ecuador (%)
Place of birth for the foreign-born population - Guyana (%)
Place of birth for the foreign-born population - Peru (%)
Place of birth for the foreign-born population - Uruguay (%)
Place of birth for the foreign-born population - Venezuela (%)
Place of birth for the foreign-born population - Other South America (%)
Place of birth for the foreign-born population - Canada (%)
Place of birth for the foreign-born population - Other Northern America (%)
Place of birth for the foreign-born population - Other (%)
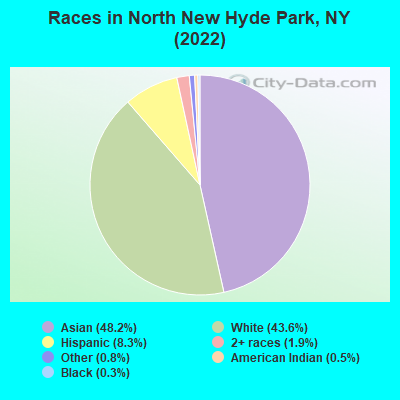
According to 2022 data, the most numerous races in North New Hyde Park, NY are White alone (6,358 residents), Hispanic (1,206 residents), and Black alone (51 residents). 57.5% of North New Hyde Park residents speak English at home. 31.7% of North New Hyde Park, NY residents are foreign-born (23.6% born in Asia, 5.2% born in Europe), which is 30.7% greater than the foreign-born rate of 22.0% across the entire state of New York.
Race distribution in North New Hyde Park
2000 2022
11,760,981 62.0% White alone 2,867,583 15.1% Hispanic 2,812,623 14.8% Black alone 1,035,926 5.5% Asian alone 366,116 1.9% Two or more races 75,499 0.4% Other race alone 52,499 0.3% American Indian alone 5,230 0.03% Native Hawaiian and Other
10,408,933 52.9% White alone 3,867,299 19.7% Hispanic 2,633,840 13.4% Black alone 1,776,286 9.0% Asian alone 732,670 3.7% Two or more races 216,110 1.1% Other race alone 35,082 0.2% American Indian alone 6,931 0.04% Native Hawaiian and Other
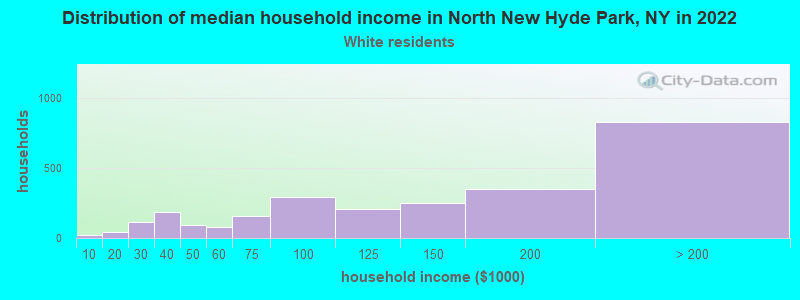
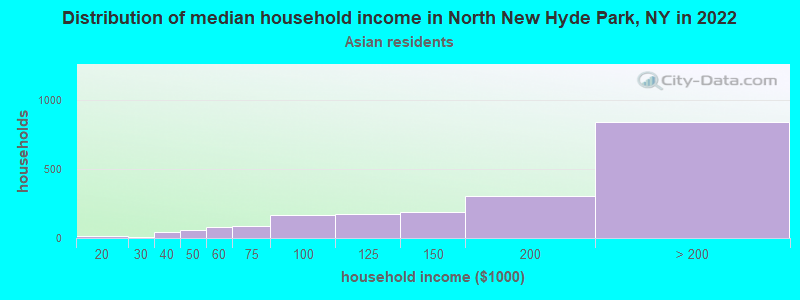
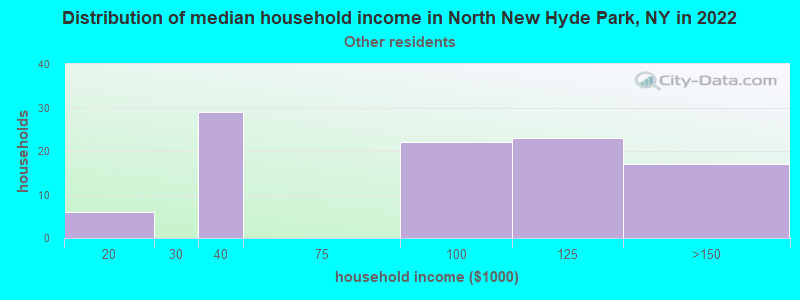
Income and house value in North New Hyde Park Median household income in 2022 $134,874 White non-Hispanic householders$168,677 Asian householders$83,938 Some other race householders$104,415 Hispanic or Latino race householdersMedian 2022 house value $809,321 White Non-Hispanic householders$570,052 Black or African American householders $808,105 Asian householders$889,281 Some other race householders$978,057 Two or more races householders$792,600 Hispanic or Latino householders
Median age by race in North New Hyde Park
55.6 Median age for White residents56.0 55.5 52.8 Median age for Black or African American residents-666,666,666.0 53.8 33.0 Median age for American Indian / Alaska Native residents-607,543,322.5 31.9 36.9 Median age for Asian residents38.6 35.6 -487,992,314.6 Median age for Native Hawaiian / Pacific Islander residents-477,502,295.2 -497,387,669.3 55.7 Median age for Other race residents35.1 53.7 39.1 Median age for Two or more races residents38.4 41.4 55.7 Median age for White alone residents56.5 55.5 33.6 Median age for Hispanic or Latino residents33.1 43.0
Owner/renter occupied households by race in North New Hyde Park
House owners and renters - White residents 2,487 96.0% Owner occupied103 4.0% Renter occupiedHouse owners and renters - Black or African American residents 10 100.0% Renter occupiedHouse owners and renters - American Indian / Alaska Native residents 31 100.0% Owner occupiedHouse owners and renters - Asian residents 1,948 98.3% Owner occupied33 1.7% Renter occupiedHouse owners and renters - Other race residents 99 89.1% Owner occupied12 10.9% Renter occupiedHouse owners and renters - Two or more races residents 194 100.0% Owner occupiedHouse owners and renters - White alone residents 2,430 95.6% Owner occupied111 4.4% Renter occupiedHouse owners and renters - Hispanic or Latino residents 297 96.4% Owner occupied11 3.6% Renter occupied
Language usage in North New Hyde Park
English speakers - Total 57.5% of residents of North New Hyde Park speak English at home.
4.2% of residents speak Spanish at home 398 67.2% Speak English very well194 32.8% Speak English less than very well39.7% of residents speak other language at home 3,711 66.1% Speak English very well1,904 33.9% Speak English less than very well
English speakers - Born in the United States 52.6% of residents of North New Hyde Park speak English at home.
5.4% of residents speak Spanish at home 25 100.0% Speak English very well39.6% of residents speak other language at home 170 93.4% Speak English very well12 6.6% Speak English less than very well
English speakers - Native, born elsewhere 60.5% of residents of North New Hyde Park speak English at home.
22.3% of residents speak Spanish at home 53 100.0% Speak English very well16.8% of residents speak other language at home 16 40.0% Speak English very well24 60.0% Speak English less than very well
English speakers - Foreign-born 17.2% of residents of North New Hyde Park speak English at home.
5.6% of residents speak Spanish at home 96 35.8% Speak English very well172 64.2% Speak English less than very well81.1% of residents speak other language at home 2,144 55.3% Speak English very well1,736 44.7% Speak English less than very well
White (Caucasian) - Speak only English Native:
88.5% (5,181)Foreign-born:
54.0% (355)
White (Caucasian) - Speak another language Native:
10.3% (605)Foreign-born:
51.4% (337)
Black or African American - Speak another language Native:
67.7% (35)Foreign-born:
100.0% (28)
Asian - Speak only English Native:
62.5% (1,644)Foreign-born:
10.5% (416)
Asian - Speak another language Native:
38.4% (1,010)Foreign-born:
89.9% (3,575)
Other race - Speak only English Native:
57.6% (129)Foreign-born:
21.7% (21)
Other race - Speak another language Native:
45.1% (101)Foreign-born:
73.8% (71)
Two or more races - Speak only English Native:
61.0% (354)Foreign-born:
6.1% (18)
Two or more races - Speak another language Native:
40.2% (234)Foreign-born:
95.8% (280)
White alone - Speak only English Native:
87.2% (4,741)Foreign-born:
45.9% (376)
White alone - Speak another language Native:
12.1% (657)Foreign-born:
53.7% (440)
Hispanic or Latino - Speak only English Native:
68.5% (624)Foreign-born:
7.8% (24)
Hispanic or Latino - Speak another language Native:
31.0% (282)Foreign-born:
92.2% (285)
Foreign-born residents in North New Hyde Park 4,633 residents are foreign born (23.6% Asia , 5.2% Europe ).
This city:
31.7%New York:
22.6%
Marital status for residents in North New Hyde Park Marital status - White (Caucasian) population 15 years and over
Males 30.4% Never married65.2% Now married1.8% Separated1.1% Widowed1.6% DivorcedFemales 31.2% Never married54.9% Now married0.3% Separated9.8% Widowed3.9% DivorcedWomen who gave birth in the past 12 months Now married:
100.0% (36)Unmarried:
0.0% (0)
Women who did not give birth in the past 12 months Now married:
30.6% (378)Unmarried:
69.4% (856)
Marital status - American Indian / Alaska Native population 15 years and over
Males 0.0% Never married100.0% Now married0.0% Separated0.0% Widowed0.0% DivorcedFemales 69.4% Never married30.6% Now married0.0% Separated0.0% Widowed0.0% DivorcedWomen who did not give birth in the past 12 months Now married:
0.0% (0)Unmarried:
100.0% (72)
Marital status - Asian population 15 years and over
Males 28.6% Never married64.5% Now married1.7% Separated3.9% Widowed1.3% DivorcedFemales 35.9% Never married56.5% Now married0.5% Separated5.4% Widowed1.7% DivorcedWomen who gave birth in the past 12 months Now married:
100.0% (105)Unmarried:
0.0% (0)
Women who did not give birth in the past 12 months Now married:
43.8% (877)Unmarried:
56.2% (1,126)
Marital status - Other race population 15 years and over
Males 31.1% Never married55.3% Now married0.0% Separated13.7% Widowed0.0% DivorcedFemales 20.7% Never married79.3% Now married0.0% Separated0.0% Widowed0.0% DivorcedWomen who did not give birth in the past 12 months Now married:
34.5% (11)Unmarried:
65.5% (22)
Marital status - Two or more races population 15 years and over
Males 32.7% Never married67.3% Now married0.0% Separated0.0% Widowed0.0% DivorcedFemales 36.5% Never married45.4% Now married0.0% Separated18.1% Widowed0.0% DivorcedWomen who did not give birth in the past 12 months Now married:
20.8% (41)Unmarried:
79.2% (156)
Marital status - White alone, not Hispanic / Latino population 15 years and over
Males 27.9% Never married67.2% Now married2.0% Separated1.2% Widowed1.7% DivorcedFemales 28.6% Never married57.6% Now married0.0% Separated10.1% Widowed3.8% DivorcedWomen who gave birth in the past 12 months Now married:
100.0% (38)Unmarried:
0.0% (0)
Women who did not give birth in the past 12 months Now married:
33.8% (391)Unmarried:
66.2% (765)
Marital status - Hispanic or Latino population 15 years and over
Males 47.1% Never married49.0% Now married0.0% Separated3.8% Widowed0.0% DivorcedFemales 41.8% Never married41.8% Now married1.9% Separated12.3% Widowed2.1% DivorcedWomen who did not give birth in the past 12 months Now married:
19.6% (53)Unmarried:
80.4% (215)
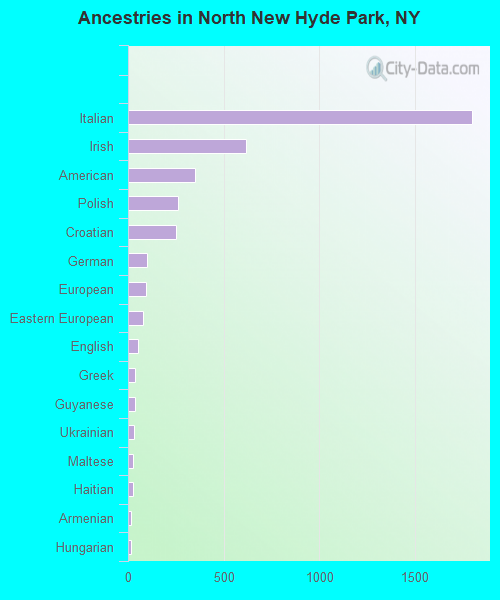
Ancestries in North New Hyde Park
1,799 22.1% Italian616 7.6% Irish352 4.3% American264 3.2% Polish253 3.1% Croatian98 1.2% German96 1.2% European81 1.0% Eastern European54 0.7% English36 0.4% Greek35 0.4% Guyanese29 0.4% Ukrainian28 0.3% Maltese27 0.3% Haitian18 0.2% Armenian17 0.2% Hungarian14 0.2% Egyptian12 0.1% Russian8 0.10% Cypriot7 0.09% Austrian6 0.07% French5 0.06% Canadian
Children Nativity (place of birth) in North New Hyde Park
Children under 6 years - Living with two parents Both parents native 121 100.0% NativeBoth parents foreign-born 170 100.0% NativeOne native, one foreign-born parent 234 100.0% NativeChildren under 6 years - Living with one parent Foreign-born parent 32 100.0% NativeChildren 6 to 17 years - Living with two parents Both parents native 431 100.0% NativeBoth parents foreign-born 649 97.4% Native17 2.6% Foreign-bornOne native, one foreign-born parent 766 100.0% NativeChildren 6 to 17 years - Living with one parent Native parent 57 100.0% NativeForeign-born parent 118 58.7% Native83 41.3% Foreign-born
Grandparents responsible for own grandchildren in North New Hyde Park
Grandparents (30 to 59 years) Asian 30 100.0% Not responsible for grandchildrenGrandparents (60 years and over) Asian 50 29.9% Responsible for grandchildren117 70.1% Not responsible for grandchildren