Races in North Miami Beach, Florida (FL) Detailed Stats
Data:
Races - White alone (%)
Races - White alone (% change since 2000)
Races - Black alone (%)
Races - Black alone (% change since 2000)
Races - American Indian alone (%)
Races - American Indian alone (% change since 2000)
Races - Asian alone (%)
Races - Asian alone (% change since 2000)
Races - Hispanic (%)
Races - Hispanic (% change since 2000)
Races - Native Hawaiian and Other Pacific Islander alone (%)
Races - Native Hawaiian and Other Pacific Islander alone (% change since 2000)
Races - Two or more races(%)
Races - Two or more races(% change since 2000)
Races - Other race alone (%)
Races - Other race alone (% change since 2000)
Racial diversity
Place of birth - Born in state of residence (%)
Place of birth - Born in state of residence (%) - White
Place of birth - Born in state of residence (%) - Black or African American
Place of birth - Born in state of residence (%) - Asian
Place of birth - Born in state of residence (%) - Hispanic or Latino
Place of birth - Born in state of residence (%) - American Indian and Alaska Native
Place of birth - Born in state of residence (%) - Multirace
Place of birth - Born in state of residence (%) - Other Race
Place of birth - Born in other state (%)
Place of birth - Born in other state (%) - White
Place of birth - Born in other state (%) - Black or African American
Place of birth - Born in other state (%) - Asian
Place of birth - Born in other state (%) - Hispanic or Latino
Place of birth - Born in other state (%) - American Indian and Alaska Native
Place of birth - Born in other state (%) - Multirace
Place of birth - Born in other state (%) - Other Race
Place of birth - Native, outside of US (%)
Place of birth - Native, outside of US (%) - White
Place of birth - Native, outside of US (%) - Black or African American
Place of birth - Native, outside of US (%) - Asian
Place of birth - Native, outside of US (%) - Hispanic or Latino
Place of birth - Native, outside of US (%) - American Indian and Alaska Native
Place of birth - Native, outside of US (%) - Multirace
Place of birth - Native, outside of US (%) - Other Race
Place of birth - Foreign born (%)
Place of birth - Foreign born (%) - White
Place of birth - Foreign born (%) - Black or African American
Place of birth - Foreign born (%) - Asian
Place of birth - Foreign born (%) - Hispanic or Latino
Place of birth - Foreign born (%) - American Indian and Alaska Native
Place of birth - Foreign born (%) - Multirace
Place of birth - Foreign born (%) - Other Race
Residents speaking English at home (%)
Residents speaking English at home - Born in the United States (%)
Residents speaking English at home - Native, born elsewhere (%)
Residents speaking English at home - Foreign born (%)
Residents speaking Spanish at home (%)
Residents speaking Spanish at home - Born in the United States (%)
Residents speaking Spanish at home - Native, born elsewhere (%)
Residents speaking Spanish at home - Foreign born (%)
Residents speaking other language at home (%)
Residents speaking other language at home - Born in the United States (%)
Residents speaking other language at home - Native, born elsewhere (%)
Residents speaking other language at home - Foreign born (%)
Marital status - Never married (%)
Marital status - Now married (%)
Marital status - Separated (%)
Marital status - Widowed (%)
Marital status - Divorced (%)
Ancestries Reported - Arab (%)
Ancestries Reported - Czech (%)
Ancestries Reported - Danish (%)
Ancestries Reported - Dutch (%)
Ancestries Reported - English (%)
Ancestries Reported - French (%)
Ancestries Reported - French Canadian (%)
Ancestries Reported - German (%)
Ancestries Reported - Greek (%)
Ancestries Reported - Hungarian (%)
Ancestries Reported - Irish (%)
Ancestries Reported - Italian (%)
Ancestries Reported - Lithuanian (%)
Ancestries Reported - Norwegian (%)
Ancestries Reported - Polish (%)
Ancestries Reported - Portuguese (%)
Ancestries Reported - Russian (%)
Ancestries Reported - Scotch-Irish (%)
Ancestries Reported - Scottish (%)
Ancestries Reported - Slovak (%)
Ancestries Reported - Subsaharan African (%)
Ancestries Reported - Swedish (%)
Ancestries Reported - Swiss (%)
Ancestries Reported - Ukrainian (%)
Ancestries Reported - United States (%)
Ancestries Reported - Welsh (%)
Ancestries Reported - West Indian (%)
Ancestries Reported - Other (%)
Geographical mobility - Same house 1 year ago (%)
Geographical mobility - Same house 1 year ago (%) - White
Geographical mobility - Same house 1 year ago (%) - Black or African American
Geographical mobility - Same house 1 year ago (%) - Asian
Geographical mobility - Same house 1 year ago (%) - Hispanic or Latino
Geographical mobility - Same house 1 year ago (%) - American Indian and Alaska Native
Geographical mobility - Same house 1 year ago (%) - Multirace
Geographical mobility - Same house 1 year ago (%) - Other Race
Geographical mobility - Moved within same county (%)
Geographical mobility - Moved within same county (%) - White
Geographical mobility - Moved within same county (%) - Black or African American
Geographical mobility - Moved within same county (%) - Asian
Geographical mobility - Moved within same county (%) - Hispanic or Latino
Geographical mobility - Moved within same county (%) - American Indian and Alaska Native
Geographical mobility - Moved within same county (%) - Multirace
Geographical mobility - Moved within same county (%) - Other Race
Geographical mobility - Moved from different county within same state (%)
Geographical mobility - Moved from different county within same state (%) - White
Geographical mobility - Moved from different county within same state (%) - Black or African American
Geographical mobility - Moved from different county within same state (%) - Asian
Geographical mobility - Moved from different county within same state (%) - Hispanic or Latino
Geographical mobility - Moved from different county within same state (%) - American Indian and Alaska Native
Geographical mobility - Moved from different county within same state (%) - Multirace
Geographical mobility - Moved from different county within same state (%) - Other Race
Geographical mobility - Moved from different state (%)
Geographical mobility - Moved from different state (%) - White
Geographical mobility - Moved from different state (%) - Black or African American
Geographical mobility - Moved from different state (%) - Asian
Geographical mobility - Moved from different state (%) - Hispanic or Latino
Geographical mobility - Moved from different state (%) - American Indian and Alaska Native
Geographical mobility - Moved from different state (%) - Multirace
Geographical mobility - Moved from different state (%) - Other Race
Geographical mobility - Moved from abroad (%)
Geographical mobility - Moved from abroad (%) - White
Geographical mobility - Moved from abroad (%) - Black or African American
Geographical mobility - Moved from abroad (%) - Asian
Geographical mobility - Moved from abroad (%) - Hispanic or Latino
Geographical mobility - Moved from abroad (%) - American Indian and Alaska Native
Geographical mobility - Moved from abroad (%) - Multirace
Geographical mobility - Moved from abroad (%) - Other Race
Place of birth for the foreign-born population - Ireland (%)
Place of birth for the foreign-born population - Denmark (%)
Place of birth for the foreign-born population - Norway (%)
Place of birth for the foreign-born population - Sweden (%)
Place of birth for the foreign-born population - United Kingdom (%)
Place of birth for the foreign-born population - England (%)
Place of birth for the foreign-born population - Scotland (%)
Place of birth for the foreign-born population - Other Northern Europe (%)
Place of birth for the foreign-born population - Austria (%)
Place of birth for the foreign-born population - Belgium (%)
Place of birth for the foreign-born population - France (%)
Place of birth for the foreign-born population - Germany (%)
Place of birth for the foreign-born population - Netherlands (%)
Place of birth for the foreign-born population - Switzerland (%)
Place of birth for the foreign-born population - Other Western Europe (%)
Place of birth for the foreign-born population - Greece (%)
Place of birth for the foreign-born population - Italy (%)
Place of birth for the foreign-born population - Portugal (%)
Place of birth for the foreign-born population - Spain (%)
Place of birth for the foreign-born population - Other Southern Europe (%)
Place of birth for the foreign-born population - Albania (%)
Place of birth for the foreign-born population - Belarus (%)
Place of birth for the foreign-born population - Bosnia and Herzegovina (%)
Place of birth for the foreign-born population - Bulgaria (%)
Place of birth for the foreign-born population - Croatia (%)
Place of birth for the foreign-born population - Czechoslovakia (%)
Place of birth for the foreign-born population - Hungary (%)
Place of birth for the foreign-born population - Latvia (%)
Place of birth for the foreign-born population - Lithuania (%)
Place of birth for the foreign-born population - North Macedonia (Macedonia) (%)
Place of birth for the foreign-born population - Moldova (%)
Place of birth for the foreign-born population - Poland (%)
Place of birth for the foreign-born population - Romania (%)
Place of birth for the foreign-born population - Russia (%)
Place of birth for the foreign-born population - Serbia (%)
Place of birth for the foreign-born population - Ukraine (%)
Place of birth for the foreign-born population - Other Eastern Europe (%)
Place of birth for the foreign-born population - China (%)
Place of birth for the foreign-born population - Hong Kong (%)
Place of birth for the foreign-born population - Taiwan (%)
Place of birth for the foreign-born population - Japan (%)
Place of birth for the foreign-born population - Korea (%)
Place of birth for the foreign-born population - Other Eastern Asia (%)
Place of birth for the foreign-born population - Afghanistan (%)
Place of birth for the foreign-born population - Bangladesh (%)
Place of birth for the foreign-born population - India (%)
Place of birth for the foreign-born population - Iran (%)
Place of birth for the foreign-born population - Kazakhstan (%)
Place of birth for the foreign-born population - Nepal (%)
Place of birth for the foreign-born population - Pakistan (%)
Place of birth for the foreign-born population - Sri Lanka (%)
Place of birth for the foreign-born population - Uzbekistan (%)
Place of birth for the foreign-born population - Other South Central Asia (%)
Place of birth for the foreign-born population - Burma (%)
Place of birth for the foreign-born population - Cambodia (%)
Place of birth for the foreign-born population - Indonesia (%)
Place of birth for the foreign-born population - Laos (%)
Place of birth for the foreign-born population - Malaysia (%)
Place of birth for the foreign-born population - Philippines (%)
Place of birth for the foreign-born population - Singapore (%)
Place of birth for the foreign-born population - Thailand (%)
Place of birth for the foreign-born population - Vietnam (%)
Place of birth for the foreign-born population - Other South Eastern Asia (%)
Place of birth for the foreign-born population - Armenia (%)
Place of birth for the foreign-born population - Iraq (%)
Place of birth for the foreign-born population - Israel (%)
Place of birth for the foreign-born population - Jordan (%)
Place of birth for the foreign-born population - Kuwait (%)
Place of birth for the foreign-born population - Lebanon (%)
Place of birth for the foreign-born population - Saudi Arabia (%)
Place of birth for the foreign-born population - Syria (%)
Place of birth for the foreign-born population - Turkey (%)
Place of birth for the foreign-born population - Yemen (%)
Place of birth for the foreign-born population - Other Western Asia (%)
Place of birth for the foreign-born population - Eritrea (%)
Place of birth for the foreign-born population - Ethiopia (%)
Place of birth for the foreign-born population - Kenya (%)
Place of birth for the foreign-born population - Somalia (%)
Place of birth for the foreign-born population - Uganda (%)
Place of birth for the foreign-born population - Zimbabwe (%)
Place of birth for the foreign-born population - Other Eastern Africa (%)
Place of birth for the foreign-born population - Cameroon (%)
Place of birth for the foreign-born population - Congo (%)
Place of birth for the foreign-born population - Democratic Republic of Congo (Zaire) (%)
Place of birth for the foreign-born population - Other Middle Africa (%)
Place of birth for the foreign-born population - Egypt (%)
Place of birth for the foreign-born population - Morocco (%)
Place of birth for the foreign-born population - Sudan (%)
Place of birth for the foreign-born population - Other Northern Africa (%)
Place of birth for the foreign-born population - South Africa (%)
Place of birth for the foreign-born population - Other Southern Africa (%)
Place of birth for the foreign-born population - Cabo Verde (%)
Place of birth for the foreign-born population - Ghana (%)
Place of birth for the foreign-born population - Liberia (%)
Place of birth for the foreign-born population - Nigeria (%)
Place of birth for the foreign-born population - Senegal (%)
Place of birth for the foreign-born population - Sierra Leone (%)
Place of birth for the foreign-born population - Other Western Africa (%)
Place of birth for the foreign-born population - Australia (%)
Place of birth for the foreign-born population - New Zealand (%)
Place of birth for the foreign-born population - Fiji (%)
Place of birth for the foreign-born population - Micronesia (%)
Place of birth for the foreign-born population - Bahamas (%)
Place of birth for the foreign-born population - Barbados (%)
Place of birth for the foreign-born population - Cuba (%)
Place of birth for the foreign-born population - Dominica (%)
Place of birth for the foreign-born population - Dominican Republic (%)
Place of birth for the foreign-born population - Grenada (%)
Place of birth for the foreign-born population - Haiti (%)
Place of birth for the foreign-born population - Jamaica (%)
Place of birth for the foreign-born population - St. Vincent and the Grenadines (%)
Place of birth for the foreign-born population - Trinidad and Tobago (%)
Place of birth for the foreign-born population - West Indies (%)
Place of birth for the foreign-born population - Other Caribbean (%)
Place of birth for the foreign-born population - Belize (%)
Place of birth for the foreign-born population - Costa Rica (%)
Place of birth for the foreign-born population - El Salvador (%)
Place of birth for the foreign-born population - Guatemala (%)
Place of birth for the foreign-born population - Honduras (%)
Place of birth for the foreign-born population - Mexico (%)
Place of birth for the foreign-born population - Nicaragua (%)
Place of birth for the foreign-born population - Panama (%)
Place of birth for the foreign-born population - Other Central America (%)
Place of birth for the foreign-born population - Argentina (%)
Place of birth for the foreign-born population - Bolivia (%)
Place of birth for the foreign-born population - Brazil (%)
Place of birth for the foreign-born population - Chile (%)
Place of birth for the foreign-born population - Colombia (%)
Place of birth for the foreign-born population - Ecuador (%)
Place of birth for the foreign-born population - Guyana (%)
Place of birth for the foreign-born population - Peru (%)
Place of birth for the foreign-born population - Uruguay (%)
Place of birth for the foreign-born population - Venezuela (%)
Place of birth for the foreign-born population - Other South America (%)
Place of birth for the foreign-born population - Canada (%)
Place of birth for the foreign-born population - Other Northern America (%)
Place of birth for the foreign-born population - Other (%)
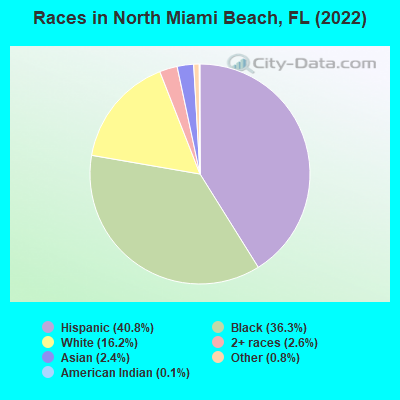
According to 2022 data, the most numerous races in North Miami Beach, FL are White alone (6,978 residents), Hispanic (17,543 residents), and Black alone (15,601 residents). 27.9% of North Miami Beach residents speak English at home. 54.3% of North Miami Beach, FL residents are foreign-born (48.4% born in Latin America), which is 61.3% greater than the foreign-born rate of 21.0% across the entire state of Florida.
Race distribution in North Miami Beach
2000 2022
15,273 37.4% Black alone 12,245 30.0% Hispanic 10,104 24.8% White alone 1,615 4.0% Asian alone 1,317 3.2% Two or more races 141 0.3% Other race alone 66 0.2% American Indian alone 25 0.06% Native Hawaiian and Other
17,543 40.8% Hispanic 15,601 36.3% Black alone 6,978 16.2% White alone 1,113 2.6% Two or more races 1,020 2.4% Asian alone 329 0.8% Other race alone 51 0.1% American Indian alone 40 0.09% Native Hawaiian and Other
2000 2022
10,458,509 65.4% White alone 2,682,715 16.8% Hispanic 2,264,268 14.2% Black alone 261,693 1.6% Asian alone 236,954 1.5% Two or more races 42,358 0.3% American Indian alone 28,994 0.2% Other race alone 6,887 0.04% Native Hawaiian and Other
11,309,403 50.8% White alone 6,025,039 27.1% Hispanic 3,241,015 14.6% Black alone 861,630 3.9% Two or more races 623,692 2.8% Asian alone 152,054 0.7% Other race alone 22,504 0.1% American Indian alone 9,486 0.04% Native Hawaiian and Other
Income and house value in North Miami Beach Median household income in 2022 $82,783 White non-Hispanic householders$54,071 Black householders$58,121 Asian householders$58,835 Some other race householders$51,158 Two or more races householders$55,703 Hispanic or Latino race householdersMedian 2022 house value $365,550 White Non-Hispanic householders$357,401 Black or African American householders$378,744 American Indian or Alaska Native householders $342,267 Asian householders$343,043 Some other race householders$353,908 Two or more races householders$367,878 Hispanic or Latino householders
Median age by race in North Miami Beach
36.5 Median age for White residents35.7 37.9 34.9 Median age for Black or African American residents34.5 36.0 35.8 Median age for American Indian / Alaska Native residents29.9 36.3 48.7 Median age for Asian residents33.3 48.3 -679,849,340.2 Median age for Native Hawaiian / Pacific Islander residents-858,307,848.3 -443,298,968.6 46.7 Median age for Other race residents36.3 47.9 42.0 Median age for Two or more races residents43.0 37.4 36.2 Median age for White alone residents35.0 37.3 41.6 Median age for Hispanic or Latino residents40.9 43.1
Owner/renter occupied households by race in North Miami Beach
House owners and renters - White residents 2,194 61.6% Owner occupied1,366 38.4% Renter occupiedHouse owners and renters - Black or African American residents 1,904 40.5% Owner occupied2,795 59.5% Renter occupiedHouse owners and renters - American Indian / Alaska Native residents 37 35.0% Owner occupied69 65.0% Renter occupiedHouse owners and renters - Asian residents 201 52.5% Owner occupied182 47.5% Renter occupiedHouse owners and renters - Native Hawaiian / Pacific Islander residents 30 100.0% Renter occupiedHouse owners and renters - Other race residents 416 55.1% Owner occupied339 44.9% Renter occupiedHouse owners and renters - Two or more races residents 2,237 43.3% Owner occupied2,931 56.7% Renter occupiedHouse owners and renters - White alone residents 1,876 66.6% Owner occupied942 33.4% Renter occupiedHouse owners and renters - Hispanic or Latino residents 3,207 46.8% Owner occupied3,649 53.2% Renter occupied
Language usage in North Miami Beach
English speakers - Total 27.9% of residents of North Miami Beach speak English at home.
40.4% of residents speak Spanish at home 8,021 49.2% Speak English very well8,296 50.8% Speak English less than very well32.0% of residents speak other language at home 8,854 68.5% Speak English very well4,067 31.5% Speak English less than very well
English speakers - Born in the United States 72.0% of residents of North Miami Beach speak English at home.
17.3% of residents speak Spanish at home 743 90.8% Speak English very well75 9.2% Speak English less than very well10.9% of residents speak other language at home 516 100.0% Speak English very well
English speakers - Native, born elsewhere 32.1% of residents of North Miami Beach speak English at home.
55.1% of residents speak Spanish at home 430 57.9% Speak English very well313 42.1% Speak English less than very well14.6% of residents speak other language at home 197 100.0% Speak English very well
English speakers - Foreign-born 11.1% of residents of North Miami Beach speak English at home.
50.0% of residents speak Spanish at home 4,036 34.9% Speak English very well7,538 65.1% Speak English less than very well38.7% of residents speak other language at home 5,211 58.2% Speak English very well3,743 41.8% Speak English less than very well
White (Caucasian) - Speak only English Native:
67.4% (3,801)Foreign-born:
8.2% (237)
White (Caucasian) - Speak another language Native:
36.9% (2,084)Foreign-born:
91.3% (2,651)
Black or African American - Speak only English Native:
55.4% (3,454)Foreign-born:
20.1% (1,654)
Black or African American - Speak another language Native:
44.5% (2,774)Foreign-born:
79.0% (6,498)
American Indian / Alaska Native - Speak another language Native:
2.2% (2)Foreign-born:
98.3% (91)
Asian - Speak only English Native:
33.5% (83)Foreign-born:
4.6% (38)
Asian - Speak another language Native:
65.3% (162)Foreign-born:
98.2% (813)
Other race - Speak only English Native:
36.0% (302)Foreign-born:
9.6% (121)
Other race - Speak another language Native:
64.2% (539)Foreign-born:
90.4% (1,142)
Two or more races - Speak only English Native:
26.9% (915)Foreign-born:
6.4% (577)
Two or more races - Speak another language Native:
72.9% (2,485)Foreign-born:
93.9% (8,523)
White alone - Speak only English Native:
74.3% (3,719)Foreign-born:
21.8% (292)
White alone - Speak another language Native:
25.6% (1,282)Foreign-born:
77.0% (1,031)
Hispanic or Latino - Speak only English Native:
18.0% (883)Foreign-born:
3.3% (392)
Hispanic or Latino - Speak another language Native:
82.0% (4,020)Foreign-born:
96.6% (11,389)
Foreign-born residents in North Miami Beach 23,357 residents are foreign born (48.4% Latin America ).
This city:
54.3%Florida:
21.1%
Marital status for residents in North Miami Beach Marital status - White (Caucasian) population 15 years and over
Males 44.8% Never married40.3% Now married0.9% Separated1.4% Widowed12.6% DivorcedFemales 33.5% Never married39.9% Now married5.7% Separated7.9% Widowed13.1% DivorcedWomen who gave birth in the past 12 months Now married:
87.1% (140)Unmarried:
12.9% (21)
Women who did not give birth in the past 12 months Now married:
37.2% (690)Unmarried:
62.8% (1,165)
Marital status - Black or African American population 15 years and over
Males 43.4% Never married43.9% Now married6.3% Separated1.1% Widowed5.3% DivorcedFemales 46.5% Never married35.1% Now married3.3% Separated8.5% Widowed6.7% DivorcedWomen who gave birth in the past 12 months Now married:
63.7% (101)Unmarried:
36.3% (58)
Women who did not give birth in the past 12 months Now married:
31.6% (1,222)Unmarried:
68.4% (2,639)
Marital status - American Indian / Alaska Native population 15 years and over
Males 1.8% Never married98.2% Now married0.0% Separated0.0% Widowed0.0% DivorcedFemales 65.6% Never married34.4% Now married0.0% Separated0.0% Widowed0.0% DivorcedWomen who did not give birth in the past 12 months Now married:
0.0% (0)Unmarried:
100.0% (64)
Marital status - Asian population 15 years and over
Males 42.6% Never married48.1% Now married0.0% Separated0.0% Widowed9.3% DivorcedFemales 17.4% Never married47.6% Now married9.3% Separated12.3% Widowed13.4% DivorcedWomen who gave birth in the past 12 months Now married:
100.0% (26)Unmarried:
0.0% (0)
Women who did not give birth in the past 12 months Now married:
40.9% (101)Unmarried:
59.1% (146)
Marital status - Other race population 15 years and over
Males 44.4% Never married37.1% Now married0.0% Separated1.9% Widowed16.6% DivorcedFemales 29.0% Never married24.6% Now married5.2% Separated31.1% Widowed10.1% DivorcedWomen who gave birth in the past 12 months Now married:
100.0% (78)Unmarried:
0.0% (0)
Women who did not give birth in the past 12 months Now married:
30.7% (160)Unmarried:
69.3% (361)
Marital status - Two or more races population 15 years and over
Males 35.8% Never married50.6% Now married2.0% Separated0.9% Widowed10.8% DivorcedFemales 27.7% Never married47.5% Now married1.7% Separated3.4% Widowed19.7% DivorcedWomen who gave birth in the past 12 months Now married:
33.3% (45)Unmarried:
66.7% (89)
Women who did not give birth in the past 12 months Now married:
43.1% (1,218)Unmarried:
56.9% (1,610)
Marital status - White alone, not Hispanic / Latino population 15 years and over
Males 44.9% Never married41.4% Now married1.2% Separated0.9% Widowed11.6% DivorcedFemales 32.8% Never married43.5% Now married0.3% Separated10.6% Widowed12.8% DivorcedWomen who gave birth in the past 12 months Now married:
82.1% (106)Unmarried:
17.9% (23)
Women who did not give birth in the past 12 months Now married:
32.8% (418)Unmarried:
67.2% (857)
Marital status - Hispanic or Latino population 15 years and over
Males 41.3% Never married44.2% Now married1.2% Separated0.8% Widowed12.5% DivorcedFemales 28.8% Never married41.5% Now married6.4% Separated8.1% Widowed15.1% DivorcedWomen who gave birth in the past 12 months Now married:
94.6% (240)Unmarried:
5.4% (14)
Women who did not give birth in the past 12 months Now married:
42.1% (1,559)Unmarried:
57.9% (2,144)
Ancestries in North Miami Beach
8,743 28.4% Haitian1,232 4.0% Jamaican1,030 3.3% American616 2.0% Italian419 1.4% Brazilian364 1.2% English355 1.2% Israeli336 1.1% Bahamian205 0.7% German188 0.6% Ukrainian179 0.6% Polish176 0.6% Eastern European162 0.5% Russian152 0.5% African141 0.5% Trinidadian and Tobagonian105 0.3% French85 0.3% Portuguese80 0.3% West Indian54 0.2% French Canadian54 0.2% Guyanese46 0.1% European45 0.1% Hungarian44 0.1% Lithuanian43 0.1% Greek43 0.1% Turkish39 0.1% Iranian38 0.1% Irish30 0.10% Sudanese28 0.09% Swiss24 0.08% Austrian17 0.06% Romanian17 0.06% Danish12 0.04% New Zealander11 0.04% Lebanese10 0.03% Syrian8 0.03% Scottish8 0.03% Canadian7 0.02% Scandinavian6 0.02% Slovene5 0.02% Dutch5 0.02% British West Indian3 0.01% Norwegian
Geographical mobility in North Miami Beach Same house 1 year ago 7,542 86.0% White (Caucasian)14,176 91.4% Black or African American147 81.4% American Indian / Alaska Native1,044 96.3% Asian27 100.0% Native Hawaiian / Pacific Islander1,674 78.3% Other race11,460 89.5% Two or more races5,752 84.7% White alone, not Hispanic / Latino15,335 88.4% Hispanic or LatinoMoved within same county 694 7.9% White / Caucasian461 3.0% Black or African American30 16.4% American Indian / Alaska Native62 5.7% Asian83 3.9% Other race604 4.7% Two or more races624 9.2% White alone, not Hispanic / Latino960 5.5% Hispanic or LatinoMoved within same state 63 0.7% White / Caucasian228 1.5% Black or African American10 0.9% Asian57 2.7% Other race253 2.0% Two or more races47 0.7% White alone, not Hispanic / Latino278 1.6% Hispanic or LatinoMoved from different state 395 4.5% White / Caucasian90 0.6% Black or African American185 8.6% Other race89 0.7% Two or more races350 5.2% White alone, not Hispanic / Latino231 1.3% Hispanic or LatinoMoved from abroad 140 1.6% White996 6.4% Black or African American146 6.8% Other race449 3.5% Two or more races49 0.7% White alone, not Hispanic / Latino690 4.0% Hispanic or Latino
Children Nativity (place of birth) in North Miami Beach
Children under 6 years - Living with two parents Both parents native 618 100.0% NativeBoth parents foreign-born 1,199 92.3% Native100 7.7% Foreign-bornOne native, one foreign-born parent 102 100.0% NativeChildren under 6 years - Living with one parent Native parent 360 97.8% Native8 2.2% Foreign-bornForeign-born parent 535 75.7% Native171 24.3% Foreign-bornChildren 6 to 17 years - Living with two parents Both parents native 534 99.9% Native0 0.1% Foreign-bornBoth parents foreign-born 1,381 53.7% Native1,190 46.3% Foreign-bornOne native, one foreign-born parent 419 84.6% Native76 15.4% Foreign-bornChildren 6 to 17 years - Living with one parent Native parent 222 100.0% NativeForeign-born parent 2,039 57.9% Native1,485 42.1% Foreign-born
Place of birth for residents in North Miami Beach 20,980 Americas20,924 Latin America11,963 Caribbean6,768 South America2,191 Central America1,396 Asia942 Europe584 South Eastern Asia429 Eastern Europe361 South Central Asia313 Eastern Asia313 China191 Southern Europe177 Western Europe142 Northern Europe136 Western Asia55 Northern America37 Africa26 Northern Africa10 Southern Africa6,910 Haiti2,425 Cuba2,027 Peru1,999 Colombia1,178 Jamaica988 Dominican Republic855 Argentina819 Venezuela698 Honduras666 Nicaragua519 Philippines437 Brazil269 Uruguay264 China263 Bahamas261 Guatemala254 Ecuador213 Mexico194 India178 Costa Rica166 Bangladesh149 Ukraine126 Israel120 Trinidad and Tobago116 El Salvador114 France93 Spain89 Italy87 Russia69 Belarus63 United Kingdom60 England55 Canada54 Panama54 Guyana42 Germany40 Hong Kong40 Chile36 Thailand31 Poland26 Sudan24 Hungary16 Moldova13 Denmark11 Indonesia11 Romania10 Netherlands10 South Africa8 Cambodia8 Belgium7 Taiwan7 Portugal6 Vietnam4 Syria4 Turkey3 Sweden
Grandparents responsible for own grandchildren in North Miami Beach
Grandparents (30 to 59 years) White / Caucasian 41 100.0% Not responsible for grandchildrenBlack or African American 10 18.6% Responsible for grandchildren45 81.4% Not responsible for grandchildrenNative Hawaiian / Pacific Islander 36 100.0% Responsible for grandchildrenTwo or more races 27 100.0% Not responsible for grandchildrenWhite alone, not Hispanic / Latino 4 100.0% Not responsible for grandchildrenHispanic or Latino 72 100.0% Not responsible for grandchildrenGrandparents (60 years and over) White / Caucasian 52 22.3% Responsible for grandchildren182 77.7% Not responsible for grandchildrenBlack or African American 66 16.6% Responsible for grandchildren330 83.4% Not responsible for grandchildrenTwo or more races 146 65.8% Responsible for grandchildren76 34.2% Not responsible for grandchildrenWhite alone, not Hispanic / Latino 37 64.4% Responsible for grandchildren20 35.6% Not responsible for grandchildrenHispanic or Latino 155 33.3% Responsible for grandchildren311 66.7% Not responsible for grandchildren