Races in North Massapequa, New York (NY) Detailed Stats
Data:
Races - White alone (%)
Races - White alone (% change since 2000)
Races - Black alone (%)
Races - Black alone (% change since 2000)
Races - American Indian alone (%)
Races - American Indian alone (% change since 2000)
Races - Asian alone (%)
Races - Asian alone (% change since 2000)
Races - Hispanic (%)
Races - Hispanic (% change since 2000)
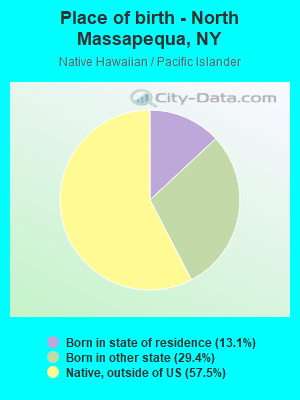
Races - Native Hawaiian and Other Pacific Islander alone (%)
Races - Native Hawaiian and Other Pacific Islander alone (% change since 2000)
Races - Two or more races(%)
Races - Two or more races(% change since 2000)
Races - Other race alone (%)
Races - Other race alone (% change since 2000)
Racial diversity
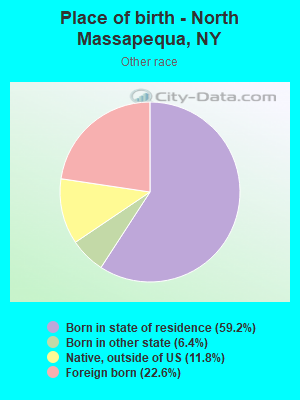
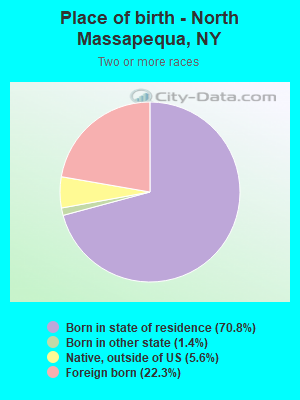
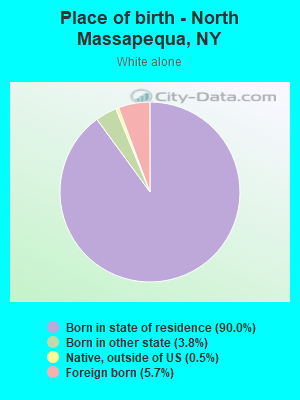
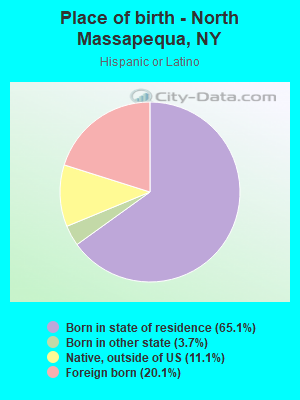
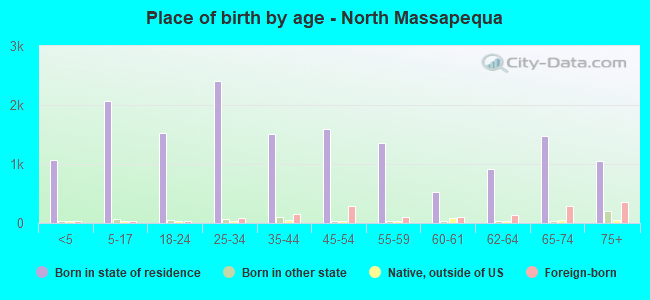
Place of birth - Born in state of residence (%)
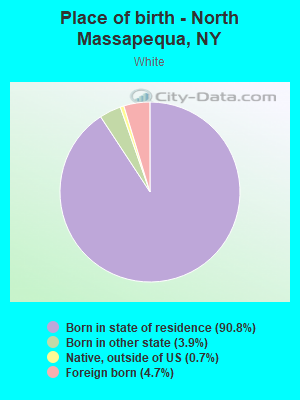
Place of birth - Born in state of residence (%) - White
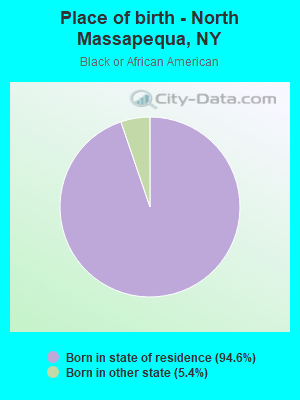
Place of birth - Born in state of residence (%) - Black or African American
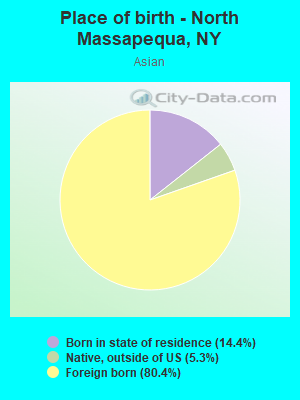
Place of birth - Born in state of residence (%) - Asian
Place of birth - Born in state of residence (%) - Hispanic or Latino
Place of birth - Born in state of residence (%) - American Indian and Alaska Native
Place of birth - Born in state of residence (%) - Multirace
Place of birth - Born in state of residence (%) - Other Race
Place of birth - Born in other state (%)
Place of birth - Born in other state (%) - White
Place of birth - Born in other state (%) - Black or African American
Place of birth - Born in other state (%) - Asian
Place of birth - Born in other state (%) - Hispanic or Latino
Place of birth - Born in other state (%) - American Indian and Alaska Native
Place of birth - Born in other state (%) - Multirace
Place of birth - Born in other state (%) - Other Race
Place of birth - Native, outside of US (%)
Place of birth - Native, outside of US (%) - White
Place of birth - Native, outside of US (%) - Black or African American
Place of birth - Native, outside of US (%) - Asian
Place of birth - Native, outside of US (%) - Hispanic or Latino
Place of birth - Native, outside of US (%) - American Indian and Alaska Native
Place of birth - Native, outside of US (%) - Multirace
Place of birth - Native, outside of US (%) - Other Race
Place of birth - Foreign born (%)
Place of birth - Foreign born (%) - White
Place of birth - Foreign born (%) - Black or African American
Place of birth - Foreign born (%) - Asian
Place of birth - Foreign born (%) - Hispanic or Latino
Place of birth - Foreign born (%) - American Indian and Alaska Native
Place of birth - Foreign born (%) - Multirace
Place of birth - Foreign born (%) - Other Race
Residents speaking English at home (%)
Residents speaking English at home - Born in the United States (%)
Residents speaking English at home - Native, born elsewhere (%)
Residents speaking English at home - Foreign born (%)
Residents speaking Spanish at home (%)
Residents speaking Spanish at home - Born in the United States (%)
Residents speaking Spanish at home - Native, born elsewhere (%)
Residents speaking Spanish at home - Foreign born (%)
Residents speaking other language at home (%)
Residents speaking other language at home - Born in the United States (%)
Residents speaking other language at home - Native, born elsewhere (%)
Residents speaking other language at home - Foreign born (%)
Marital status - Never married (%)
Marital status - Now married (%)
Marital status - Separated (%)
Marital status - Widowed (%)
Marital status - Divorced (%)
Ancestries Reported - Arab (%)
Ancestries Reported - Czech (%)
Ancestries Reported - Danish (%)
Ancestries Reported - Dutch (%)
Ancestries Reported - English (%)
Ancestries Reported - French (%)
Ancestries Reported - French Canadian (%)
Ancestries Reported - German (%)
Ancestries Reported - Greek (%)
Ancestries Reported - Hungarian (%)
Ancestries Reported - Irish (%)
Ancestries Reported - Italian (%)
Ancestries Reported - Lithuanian (%)
Ancestries Reported - Norwegian (%)
Ancestries Reported - Polish (%)
Ancestries Reported - Portuguese (%)
Ancestries Reported - Russian (%)
Ancestries Reported - Scotch-Irish (%)
Ancestries Reported - Scottish (%)
Ancestries Reported - Slovak (%)
Ancestries Reported - Subsaharan African (%)
Ancestries Reported - Swedish (%)
Ancestries Reported - Swiss (%)
Ancestries Reported - Ukrainian (%)
Ancestries Reported - United States (%)
Ancestries Reported - Welsh (%)
Ancestries Reported - West Indian (%)
Ancestries Reported - Other (%)
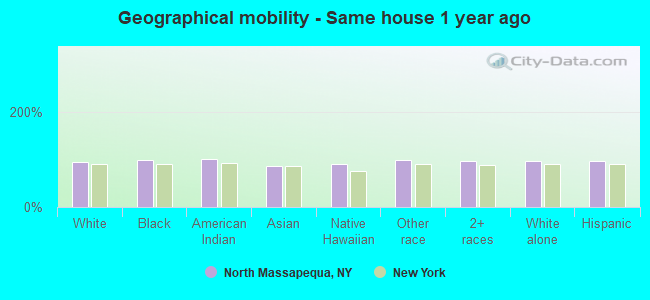
Geographical mobility - Same house 1 year ago (%)
Geographical mobility - Same house 1 year ago (%) - White
Geographical mobility - Same house 1 year ago (%) - Black or African American
Geographical mobility - Same house 1 year ago (%) - Asian
Geographical mobility - Same house 1 year ago (%) - Hispanic or Latino
Geographical mobility - Same house 1 year ago (%) - American Indian and Alaska Native
Geographical mobility - Same house 1 year ago (%) - Multirace
Geographical mobility - Same house 1 year ago (%) - Other Race
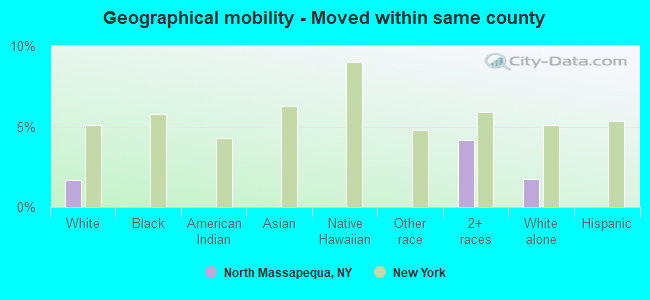
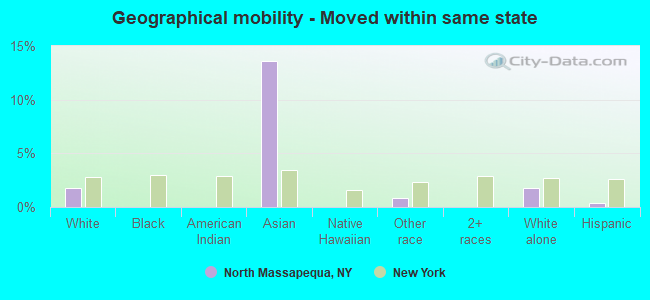
Geographical mobility - Moved within same county (%)
Geographical mobility - Moved within same county (%) - White
Geographical mobility - Moved within same county (%) - Black or African American
Geographical mobility - Moved within same county (%) - Asian
Geographical mobility - Moved within same county (%) - Hispanic or Latino
Geographical mobility - Moved within same county (%) - American Indian and Alaska Native
Geographical mobility - Moved within same county (%) - Multirace
Geographical mobility - Moved within same county (%) - Other Race
Geographical mobility - Moved from different county within same state (%)
Geographical mobility - Moved from different county within same state (%) - White
Geographical mobility - Moved from different county within same state (%) - Black or African American
Geographical mobility - Moved from different county within same state (%) - Asian
Geographical mobility - Moved from different county within same state (%) - Hispanic or Latino
Geographical mobility - Moved from different county within same state (%) - American Indian and Alaska Native
Geographical mobility - Moved from different county within same state (%) - Multirace
Geographical mobility - Moved from different county within same state (%) - Other Race
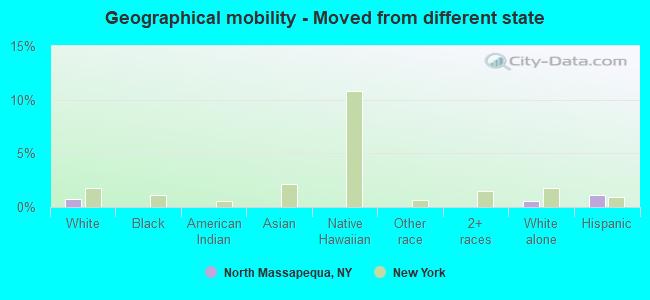
Geographical mobility - Moved from different state (%)
Geographical mobility - Moved from different state (%) - White
Geographical mobility - Moved from different state (%) - Black or African American
Geographical mobility - Moved from different state (%) - Asian
Geographical mobility - Moved from different state (%) - Hispanic or Latino
Geographical mobility - Moved from different state (%) - American Indian and Alaska Native
Geographical mobility - Moved from different state (%) - Multirace
Geographical mobility - Moved from different state (%) - Other Race
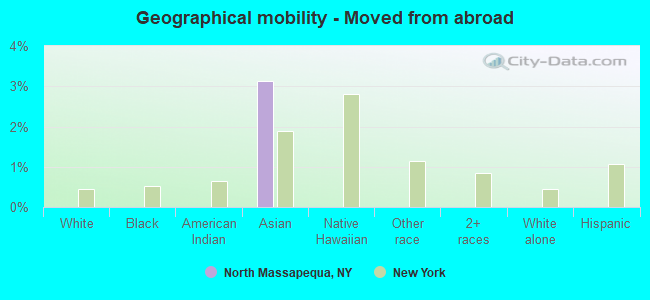
Geographical mobility - Moved from abroad (%)
Geographical mobility - Moved from abroad (%) - White
Geographical mobility - Moved from abroad (%) - Black or African American
Geographical mobility - Moved from abroad (%) - Asian
Geographical mobility - Moved from abroad (%) - Hispanic or Latino
Geographical mobility - Moved from abroad (%) - American Indian and Alaska Native
Geographical mobility - Moved from abroad (%) - Multirace
Geographical mobility - Moved from abroad (%) - Other Race
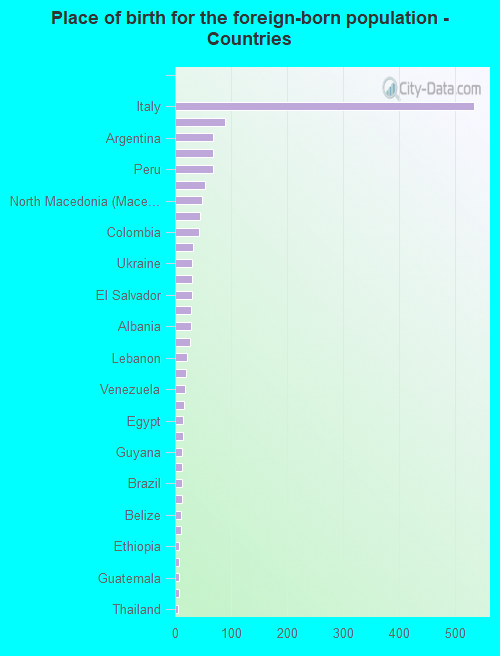
Place of birth for the foreign-born population - Ireland (%)
Place of birth for the foreign-born population - Denmark (%)
Place of birth for the foreign-born population - Norway (%)
Place of birth for the foreign-born population - Sweden (%)
Place of birth for the foreign-born population - United Kingdom (%)
Place of birth for the foreign-born population - England (%)
Place of birth for the foreign-born population - Scotland (%)
Place of birth for the foreign-born population - Other Northern Europe (%)
Place of birth for the foreign-born population - Austria (%)
Place of birth for the foreign-born population - Belgium (%)
Place of birth for the foreign-born population - France (%)
Place of birth for the foreign-born population - Germany (%)
Place of birth for the foreign-born population - Netherlands (%)
Place of birth for the foreign-born population - Switzerland (%)
Place of birth for the foreign-born population - Other Western Europe (%)
Place of birth for the foreign-born population - Greece (%)
Place of birth for the foreign-born population - Italy (%)
Place of birth for the foreign-born population - Portugal (%)
Place of birth for the foreign-born population - Spain (%)
Place of birth for the foreign-born population - Other Southern Europe (%)
Place of birth for the foreign-born population - Albania (%)
Place of birth for the foreign-born population - Belarus (%)
Place of birth for the foreign-born population - Bosnia and Herzegovina (%)
Place of birth for the foreign-born population - Bulgaria (%)
Place of birth for the foreign-born population - Croatia (%)
Place of birth for the foreign-born population - Czechoslovakia (%)
Place of birth for the foreign-born population - Hungary (%)
Place of birth for the foreign-born population - Latvia (%)
Place of birth for the foreign-born population - Lithuania (%)
Place of birth for the foreign-born population - North Macedonia (Macedonia) (%)
Place of birth for the foreign-born population - Moldova (%)
Place of birth for the foreign-born population - Poland (%)
Place of birth for the foreign-born population - Romania (%)
Place of birth for the foreign-born population - Russia (%)
Place of birth for the foreign-born population - Serbia (%)
Place of birth for the foreign-born population - Ukraine (%)
Place of birth for the foreign-born population - Other Eastern Europe (%)
Place of birth for the foreign-born population - China (%)
Place of birth for the foreign-born population - Hong Kong (%)
Place of birth for the foreign-born population - Taiwan (%)
Place of birth for the foreign-born population - Japan (%)
Place of birth for the foreign-born population - Korea (%)
Place of birth for the foreign-born population - Other Eastern Asia (%)
Place of birth for the foreign-born population - Afghanistan (%)
Place of birth for the foreign-born population - Bangladesh (%)
Place of birth for the foreign-born population - India (%)
Place of birth for the foreign-born population - Iran (%)
Place of birth for the foreign-born population - Kazakhstan (%)
Place of birth for the foreign-born population - Nepal (%)
Place of birth for the foreign-born population - Pakistan (%)
Place of birth for the foreign-born population - Sri Lanka (%)
Place of birth for the foreign-born population - Uzbekistan (%)
Place of birth for the foreign-born population - Other South Central Asia (%)
Place of birth for the foreign-born population - Burma (%)
Place of birth for the foreign-born population - Cambodia (%)
Place of birth for the foreign-born population - Indonesia (%)
Place of birth for the foreign-born population - Laos (%)
Place of birth for the foreign-born population - Malaysia (%)
Place of birth for the foreign-born population - Philippines (%)
Place of birth for the foreign-born population - Singapore (%)
Place of birth for the foreign-born population - Thailand (%)
Place of birth for the foreign-born population - Vietnam (%)
Place of birth for the foreign-born population - Other South Eastern Asia (%)
Place of birth for the foreign-born population - Armenia (%)
Place of birth for the foreign-born population - Iraq (%)
Place of birth for the foreign-born population - Israel (%)
Place of birth for the foreign-born population - Jordan (%)
Place of birth for the foreign-born population - Kuwait (%)
Place of birth for the foreign-born population - Lebanon (%)
Place of birth for the foreign-born population - Saudi Arabia (%)
Place of birth for the foreign-born population - Syria (%)
Place of birth for the foreign-born population - Turkey (%)
Place of birth for the foreign-born population - Yemen (%)
Place of birth for the foreign-born population - Other Western Asia (%)
Place of birth for the foreign-born population - Eritrea (%)
Place of birth for the foreign-born population - Ethiopia (%)
Place of birth for the foreign-born population - Kenya (%)
Place of birth for the foreign-born population - Somalia (%)
Place of birth for the foreign-born population - Uganda (%)
Place of birth for the foreign-born population - Zimbabwe (%)
Place of birth for the foreign-born population - Other Eastern Africa (%)
Place of birth for the foreign-born population - Cameroon (%)
Place of birth for the foreign-born population - Congo (%)
Place of birth for the foreign-born population - Democratic Republic of Congo (Zaire) (%)
Place of birth for the foreign-born population - Other Middle Africa (%)
Place of birth for the foreign-born population - Egypt (%)
Place of birth for the foreign-born population - Morocco (%)
Place of birth for the foreign-born population - Sudan (%)
Place of birth for the foreign-born population - Other Northern Africa (%)
Place of birth for the foreign-born population - South Africa (%)
Place of birth for the foreign-born population - Other Southern Africa (%)
Place of birth for the foreign-born population - Cabo Verde (%)
Place of birth for the foreign-born population - Ghana (%)
Place of birth for the foreign-born population - Liberia (%)
Place of birth for the foreign-born population - Nigeria (%)
Place of birth for the foreign-born population - Senegal (%)
Place of birth for the foreign-born population - Sierra Leone (%)
Place of birth for the foreign-born population - Other Western Africa (%)
Place of birth for the foreign-born population - Australia (%)
Place of birth for the foreign-born population - New Zealand (%)
Place of birth for the foreign-born population - Fiji (%)
Place of birth for the foreign-born population - Micronesia (%)
Place of birth for the foreign-born population - Bahamas (%)
Place of birth for the foreign-born population - Barbados (%)
Place of birth for the foreign-born population - Cuba (%)
Place of birth for the foreign-born population - Dominica (%)
Place of birth for the foreign-born population - Dominican Republic (%)
Place of birth for the foreign-born population - Grenada (%)
Place of birth for the foreign-born population - Haiti (%)
Place of birth for the foreign-born population - Jamaica (%)
Place of birth for the foreign-born population - St. Vincent and the Grenadines (%)
Place of birth for the foreign-born population - Trinidad and Tobago (%)
Place of birth for the foreign-born population - West Indies (%)
Place of birth for the foreign-born population - Other Caribbean (%)
Place of birth for the foreign-born population - Belize (%)
Place of birth for the foreign-born population - Costa Rica (%)
Place of birth for the foreign-born population - El Salvador (%)
Place of birth for the foreign-born population - Guatemala (%)
Place of birth for the foreign-born population - Honduras (%)
Place of birth for the foreign-born population - Mexico (%)
Place of birth for the foreign-born population - Nicaragua (%)
Place of birth for the foreign-born population - Panama (%)
Place of birth for the foreign-born population - Other Central America (%)
Place of birth for the foreign-born population - Argentina (%)
Place of birth for the foreign-born population - Bolivia (%)
Place of birth for the foreign-born population - Brazil (%)
Place of birth for the foreign-born population - Chile (%)
Place of birth for the foreign-born population - Colombia (%)
Place of birth for the foreign-born population - Ecuador (%)
Place of birth for the foreign-born population - Guyana (%)
Place of birth for the foreign-born population - Peru (%)
Place of birth for the foreign-born population - Uruguay (%)
Place of birth for the foreign-born population - Venezuela (%)
Place of birth for the foreign-born population - Other South America (%)
Place of birth for the foreign-born population - Canada (%)
Place of birth for the foreign-born population - Other Northern America (%)
Place of birth for the foreign-born population - Other (%)
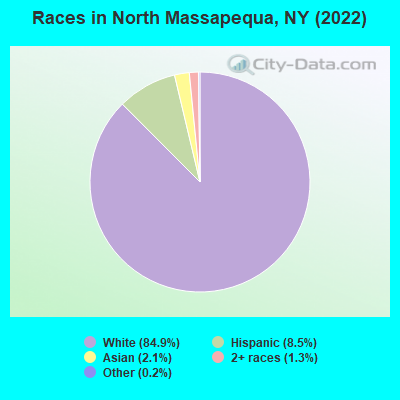
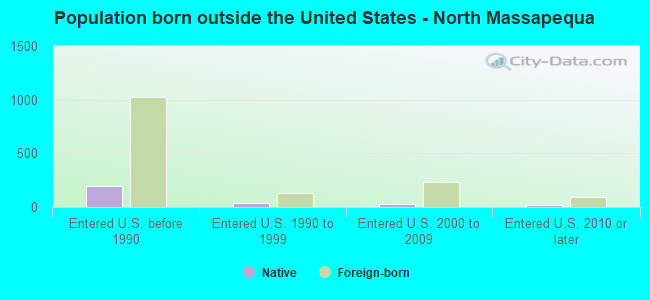
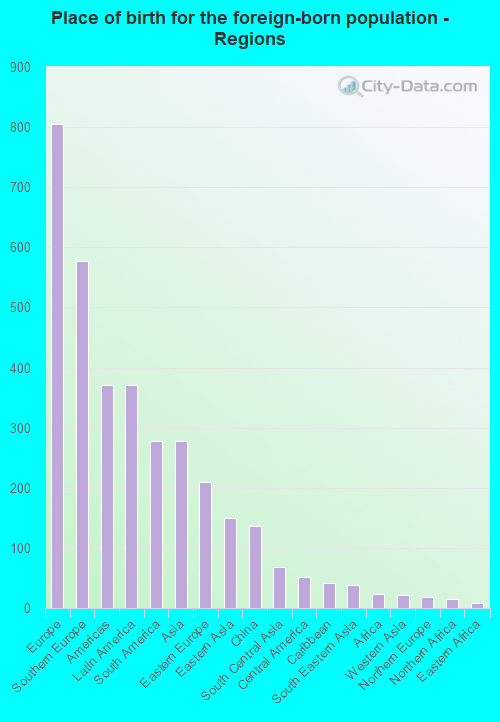
According to 2022 data, the most numerous races in North Massapequa, NY are White alone (15,394 residents), Hispanic (1,533 residents), and Black alone (17 residents). 87.5% of North Massapequa residents speak English at home. 8.2% of North Massapequa, NY residents are foreign-born (4.5% born in Europe, 2.1% born in Latin America, 1.5% born in Asia), which is 169.5% less than the foreign-born rate of 22.0% across the entire state of New York.
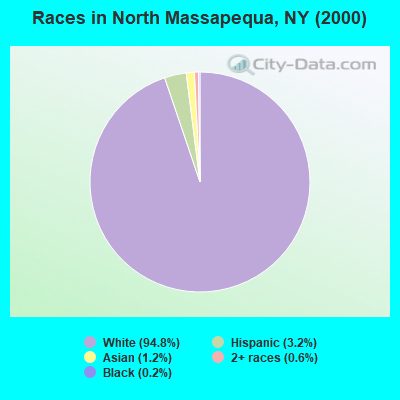
Race distribution in North Massapequa
2000 2022
11,760,981 62.0% White alone 2,867,583 15.1% Hispanic 2,812,623 14.8% Black alone 1,035,926 5.5% Asian alone 366,116 1.9% Two or more races 75,499 0.4% Other race alone 52,499 0.3% American Indian alone 5,230 0.03% Native Hawaiian and Other
10,408,933 52.9% White alone 3,867,299 19.7% Hispanic 2,633,840 13.4% Black alone 1,776,286 9.0% Asian alone 732,670 3.7% Two or more races 216,110 1.1% Other race alone 35,082 0.2% American Indian alone 6,931 0.04% Native Hawaiian and Other
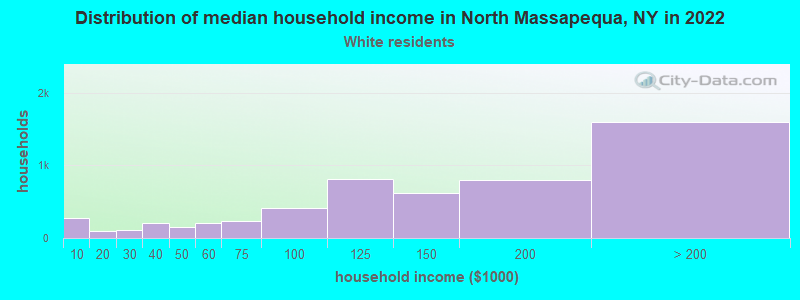
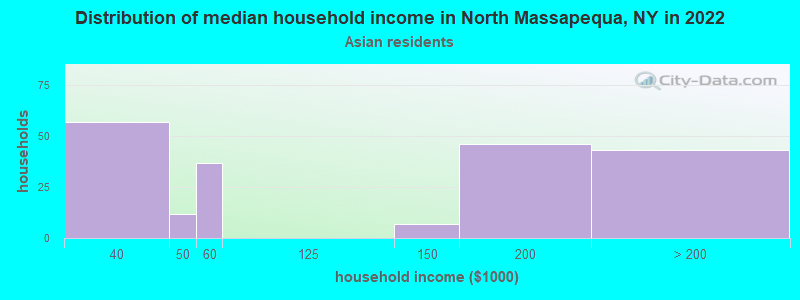
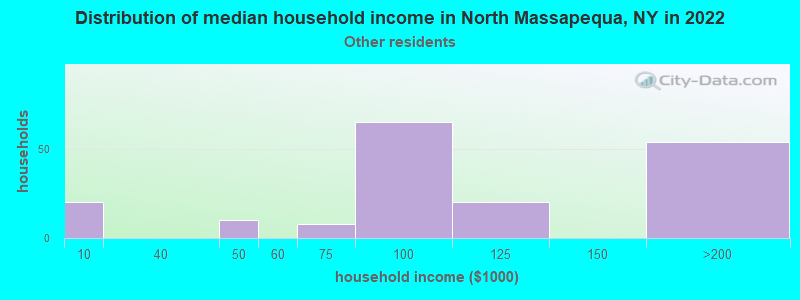
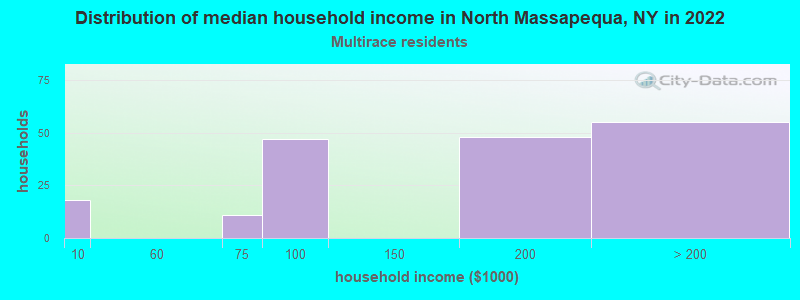
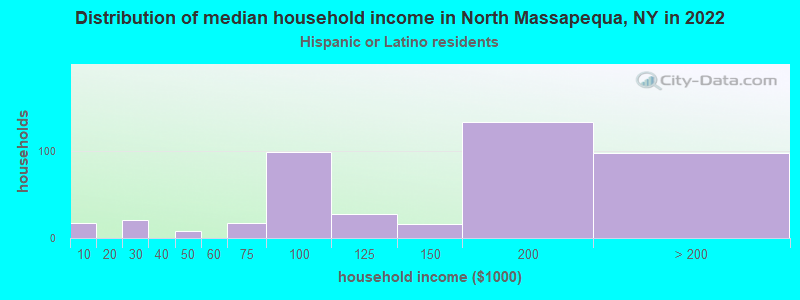
Income and house value in North Massapequa Median household income in 2022 $130,239 White non-Hispanic householders$92,110 Some other race householders$150,728 Two or more races householders$153,674 Hispanic or Latino race householdersMedian 2022 house value $603,594 White Non-Hispanic householders$426,082 Black or African American householders $491,633 Asian householders$681,731 Some other race householders$607,789 Two or more races householders$610,411 Hispanic or Latino householders
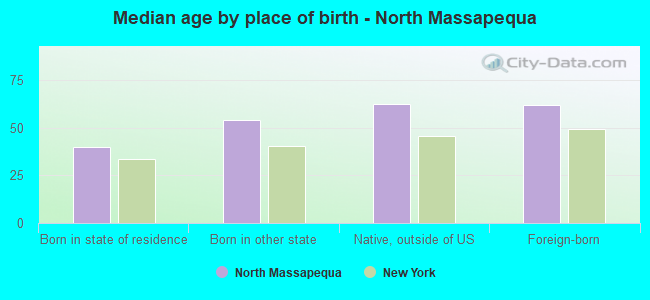
Median age by race in North Massapequa
45.7 Median age for White residents45.0 47.3 48.3 Median age for Black or African American residents47.6 -687,908,496.0 -855,158,729.3 Median age for American Indian / Alaska Native residents-607,543,322.5 -837,121,211.3 61.4 Median age for Asian residents63.2 60.7 22.6 Median age for Native Hawaiian / Pacific Islander residents-477,502,295.2 12.5 46.1 Median age for Other race residents46.2 45.0 28.3 Median age for Two or more races residents28.6 27.9 45.5 Median age for White alone residents44.3 48.8 30.7 Median age for Hispanic or Latino residents30.9 30.2
Owner/renter occupied households by race in North Massapequa
House owners and renters - White residents 5,192 94.5% Owner occupied303 5.5% Renter occupiedHouse owners and renters - Asian residents 169 92.7% Owner occupied13 7.3% Renter occupiedHouse owners and renters - Native Hawaiian / Pacific Islander residents 10 100.0% Owner occupiedHouse owners and renters - Other race residents 185 93.4% Owner occupied13 6.6% Renter occupiedHouse owners and renters - Two or more races residents 170 91.4% Owner occupied16 8.6% Renter occupiedHouse owners and renters - White alone residents 5,199 94.1% Owner occupied326 5.9% Renter occupiedHouse owners and renters - Hispanic or Latino residents 408 97.1% Owner occupied12 2.9% Renter occupied
Language usage in North Massapequa
English speakers - Total 87.5% of residents of North Massapequa speak English at home.
3.7% of residents speak Spanish at home 499 79.3% Speak English very well130 20.7% Speak English less than very well8.1% of residents speak other language at home 1,015 73.6% Speak English very well365 26.4% Speak English less than very well
English speakers - Born in the United States 96.3% of residents of North Massapequa speak English at home.
2.5% of residents speak Spanish at home 16 100.0% Speak English very well0.3% of residents speak other language at home 2 100.0% Speak English less than very well
English speakers - Native, born elsewhere 43.9% of residents of North Massapequa speak English at home.
43.2% of residents speak Spanish at home 114 100.0% Speak English very well9.5% of residents speak other language at home 25 100.0% Speak English very well
English speakers - Foreign-born 24.5% of residents of North Massapequa speak English at home.
15.5% of residents speak Spanish at home 131 55.3% Speak English very well106 44.7% Speak English less than very well61.0% of residents speak other language at home 595 63.8% Speak English very well337 36.2% Speak English less than very well
White (Caucasian) - Speak only English Native:
97.9% (13,434)Foreign-born:
30.2% (216)
White (Caucasian) - Speak another language Native:
3.1% (422)Foreign-born:
69.9% (500)
Asian - Speak only English Native:
100.0% (82)Foreign-born:
31.7% (103)
Other race - Speak only English Native:
37.9% (138)Foreign-born:
9.9% (11)
Other race - Speak another language Native:
61.8% (226)Foreign-born:
89.3% (99)
Two or more races - Speak only English Native:
85.4% (574)Foreign-born:
13.5% (31)
Two or more races - Speak another language Native:
9.8% (66)Foreign-born:
87.3% (200)
White alone - Speak only English Native:
97.1% (13,225)Foreign-born:
22.7% (197)
White alone - Speak another language Native:
3.1% (427)Foreign-born:
77.5% (672)
Hispanic or Latino - Speak only English Native:
65.7% (742)Foreign-born:
20.8% (66)
Hispanic or Latino - Speak another language Native:
33.9% (383)Foreign-born:
79.2% (250)
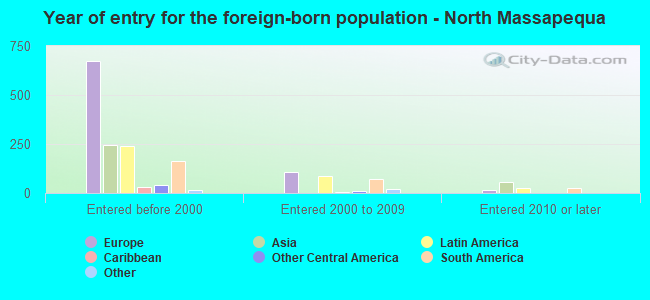
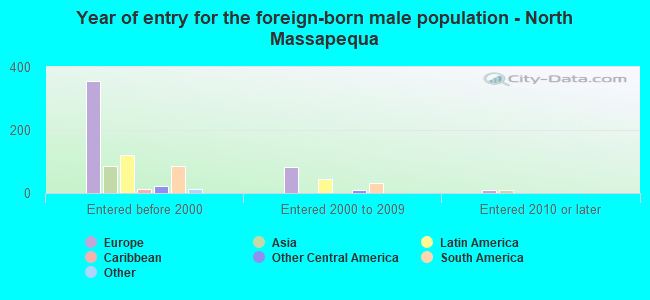
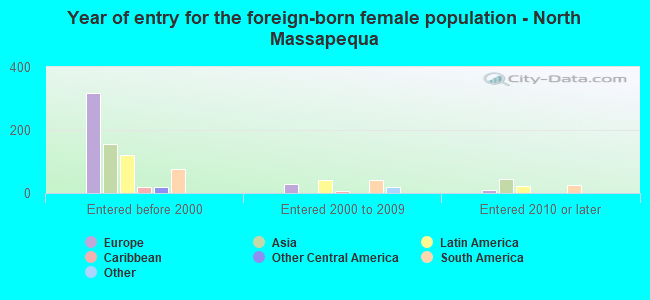
Foreign-born residents in North Massapequa 1,480 residents are foreign born (4.5% Europe , 2.1% Latin America , 1.5% Asia ).
This city:
8.2%New York:
22.6%
Marital status for residents in North Massapequa Marital status - White (Caucasian) population 15 years and over
Males 33.6% Never married57.5% Now married1.5% Separated4.3% Widowed3.2% DivorcedFemales 28.2% Never married54.0% Now married0.5% Separated9.7% Widowed7.6% DivorcedWomen who gave birth in the past 12 months Now married:
96.7% (156)Unmarried:
3.3% (5)
Women who did not give birth in the past 12 months Now married:
41.7% (1,201)Unmarried:
58.3% (1,678)
Marital status - Black or African American population 15 years and over
Males 100.0% Never married0.0% Now married0.0% Separated0.0% Widowed0.0% DivorcedFemales 100.0% Never married0.0% Now married0.0% Separated0.0% Widowed0.0% DivorcedMarital status - Asian population 15 years and over
Males 52.1% Never married39.5% Now married0.0% Separated0.0% Widowed8.4% DivorcedFemales 11.1% Never married83.6% Now married0.0% Separated0.0% Widowed5.3% DivorcedWomen who gave birth in the past 12 months Now married:
100.0% (9)Unmarried:
0.0% (0)
Women who did not give birth in the past 12 months Now married:
65.8% (57)Unmarried:
34.2% (30)
Marital status - Native Hawaiian / Pacific Islander population 15 years and over
Males 0.0% Never married100.0% Now married0.0% Separated0.0% Widowed0.0% DivorcedFemales 40.0% Never married60.0% Now married0.0% Separated0.0% Widowed0.0% DivorcedWomen who gave birth in the past 12 months Now married:
100.0% (9)Unmarried:
0.0% (0)
Women who did not give birth in the past 12 months Now married:
0.0% (0)Unmarried:
100.0% (13)
Marital status - Other race population 15 years and over
Males 32.6% Never married59.7% Now married0.0% Separated7.6% Widowed0.0% DivorcedFemales 20.5% Never married62.6% Now married0.0% Separated0.0% Widowed16.9% DivorcedWomen who did not give birth in the past 12 months Now married:
56.4% (65)Unmarried:
43.6% (50)
Marital status - Two or more races population 15 years and over
Males 19.0% Never married72.0% Now married0.0% Separated8.9% Widowed0.0% DivorcedFemales 31.6% Never married47.7% Now married0.0% Separated6.6% Widowed14.1% DivorcedWomen who gave birth in the past 12 months Now married:
100.0% (23)Unmarried:
0.0% (0)
Women who did not give birth in the past 12 months Now married:
45.7% (136)Unmarried:
54.3% (162)
Marital status - White alone, not Hispanic / Latino population 15 years and over
Males 33.6% Never married57.5% Now married1.5% Separated4.4% Widowed3.1% DivorcedFemales 27.2% Never married54.4% Now married0.6% Separated9.9% Widowed7.8% DivorcedWomen who gave birth in the past 12 months Now married:
96.5% (158)Unmarried:
3.5% (6)
Women who did not give birth in the past 12 months Now married:
42.6% (1,223)Unmarried:
57.4% (1,646)
Marital status - Hispanic or Latino population 15 years and over
Males 30.0% Never married61.0% Now married0.0% Separated6.3% Widowed2.7% DivorcedFemales 37.1% Never married50.6% Now married0.0% Separated4.4% Widowed7.9% DivorcedWomen who gave birth in the past 12 months Now married:
100.0% (17)Unmarried:
0.0% (0)
Women who did not give birth in the past 12 months Now married:
43.1% (208)Unmarried:
56.9% (275)
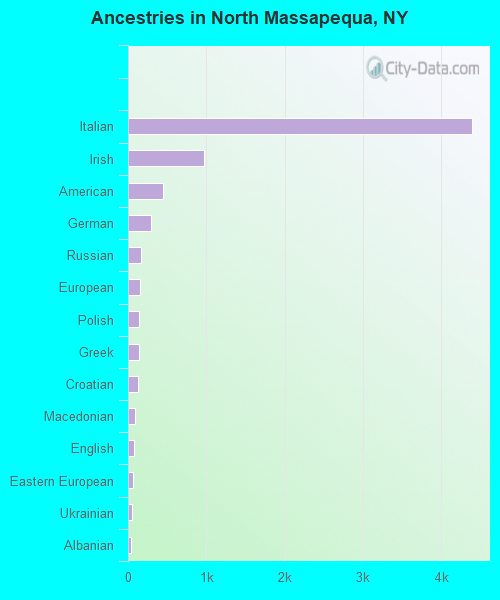
Ancestries in North Massapequa
4,391 55.2% Italian966 12.2% Irish445 5.6% American300 3.8% German166 2.1% Russian148 1.9% European142 1.8% Polish136 1.7% Greek132 1.7% Croatian93 1.2% Macedonian83 1.0% English59 0.7% Eastern European55 0.7% Ukrainian43 0.5% Albanian37 0.5% Romanian21 0.3% Lebanese20 0.3% Austrian18 0.2% Portuguese17 0.2% Scottish13 0.2% Turkish12 0.2% African12 0.2% Belizean11 0.1% French Canadian11 0.1% Northern European8 0.1% Guyanese7 0.09% Maltese5 0.06% Slovak5 0.06% Swedish
Children Nativity (place of birth) in North Massapequa
Children under 6 years - Living with two parents Both parents native 1,063 100.0% NativeBoth parents foreign-born 51 100.0% NativeOne native, one foreign-born parent 126 100.0% NativeChildren under 6 years - Living with one parent Native parent 89 100.0% NativeChildren 6 to 17 years - Living with two parents Both parents native 1,320 100.0% NativeBoth parents foreign-born 43 100.0% NativeOne native, one foreign-born parent 165 100.0% NativeChildren 6 to 17 years - Living with one parent Native parent 278 100.0% NativeForeign-born parent 22 47.2% Native24 52.8% Foreign-born
Grandparents responsible for own grandchildren in North Massapequa
Grandparents (30 to 59 years) White / Caucasian 21 61.1% Responsible for grandchildren14 38.9% Not responsible for grandchildrenNative Hawaiian / Pacific Islander 8 100.0% Not responsible for grandchildrenWhite alone, not Hispanic / Latino 23 72.5% Responsible for grandchildren9 27.5% Not responsible for grandchildrenHispanic or Latino 7 100.0% Not responsible for grandchildrenGrandparents (60 years and over) White / Caucasian 53 19.7% Responsible for grandchildren216 80.3% Not responsible for grandchildrenNative Hawaiian / Pacific Islander 9 100.0% Not responsible for grandchildrenWhite alone, not Hispanic / Latino 50 18.0% Responsible for grandchildren227 82.0% Not responsible for grandchildrenHispanic or Latino 59 100.0% Not responsible for grandchildren