Races in North Cleveland, Oklahoma (OK) Detailed Stats
Ancestries, Foreign-born residents, place of birth
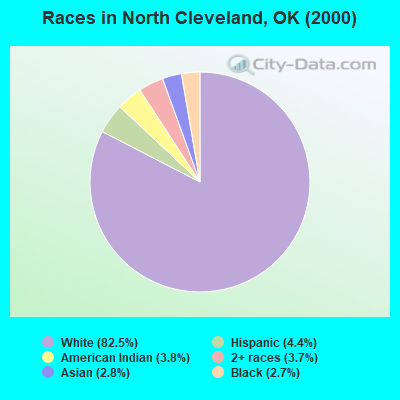
Race distribution in North Cleveland

- 74,50982.5%White alone
- 3,9474.4%Hispanic
- 3,4123.8%American Indian alone
- 3,3393.7%Two or more races
- 2,5002.8%Asian alone
- 2,4732.7%Black alone
- 790.09%Other race alone
- 360.04%Native Hawaiian and Other
Pacific Islander alone
2000
2022
-
- 2,556,36874.1%White alone
- 266,1587.7%American Indian alone
- 257,9817.5%Black alone
- 179,3045.2%Hispanic
- 140,2494.1%Two or more races
- 46,1721.3%Asian alone
- 2,3220.07%Other race alone
- 2,1000.06%Native Hawaiian and Other
Pacific Islander alone

-
- 2,517,40362.6%White alone
- 486,69212.1%Hispanic
- 364,4539.1%Two or more races
- 273,6506.8%American Indian alone
- 268,5436.7%Black alone
- 92,6722.3%Asian alone
- 10,7860.3%Other race alone
- 5,6010.1%Native Hawaiian and Other
Pacific Islander alone

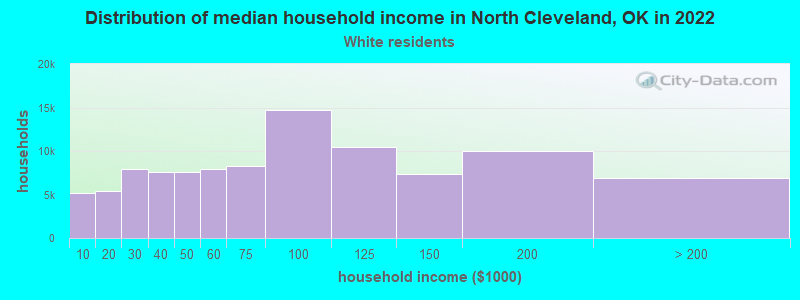
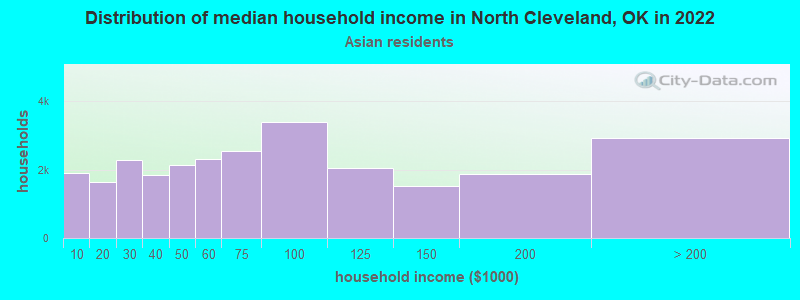
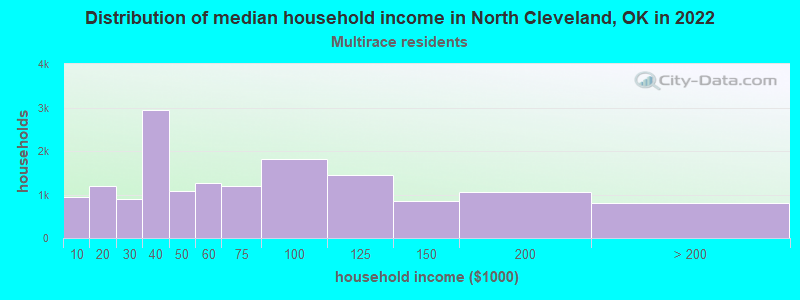
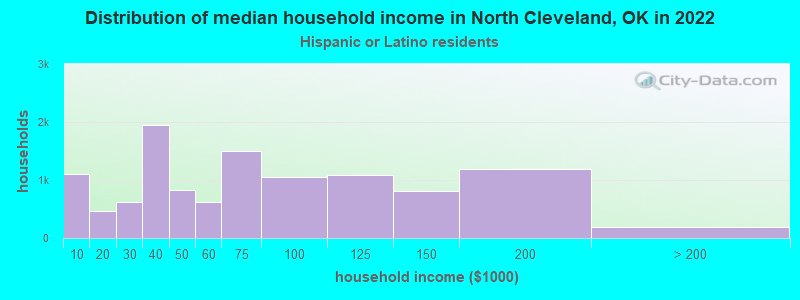
Income and house value in North Cleveland
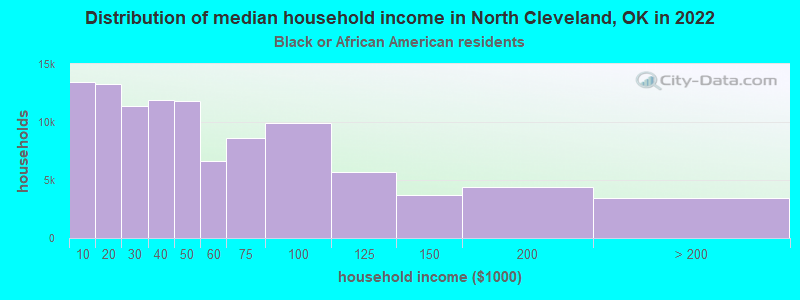
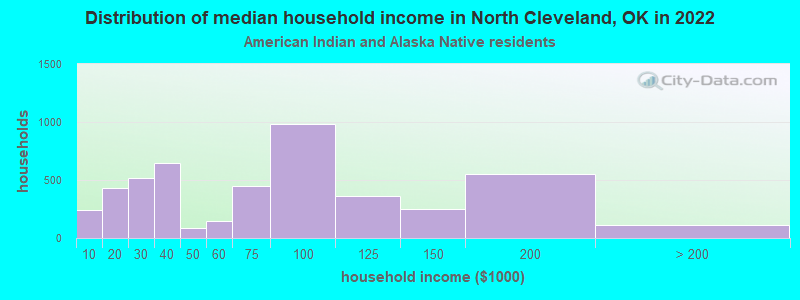
- Median household income in 2022
- $84,140White non-Hispanic householders
- $92,248Black householders
- $90,424American Indian and Alaska Native householders
- $113,371Asian householders
- $45,961Some other race householders
- $66,977Two or more races householders
- $75,755Hispanic or Latino race householders
- Median 2022 house value
- $232,242White Non-Hispanic householders
- $260,702Black or African American householders
- $207,541American Indian or Alaska Native householders
- $242,445Asian householders
- $203,245Some other race householders
- $220,965Two or more races householders
- $212,911Hispanic or Latino householders
Household income for White non-Hispanic householders
Household income for Black householders
Household income for American Indian and Alaska Native householders
Household income for Asian householders
Household income for Native Hawaiian and other Pacific Islander householders

Household income for Two or more races householders
Household income for Hispanic or Latino race householders
Zip code: 73160