Races in North Amityville, New York (NY) Detailed Stats
Data:
Races - White alone (%)
Races - White alone (% change since 2000)
Races - Black alone (%)
Races - Black alone (% change since 2000)
Races - American Indian alone (%)
Races - American Indian alone (% change since 2000)
Races - Asian alone (%)
Races - Asian alone (% change since 2000)
Races - Hispanic (%)
Races - Hispanic (% change since 2000)
Races - Native Hawaiian and Other Pacific Islander alone (%)
Races - Native Hawaiian and Other Pacific Islander alone (% change since 2000)
Races - Two or more races(%)
Races - Two or more races(% change since 2000)
Races - Other race alone (%)
Races - Other race alone (% change since 2000)
Racial diversity
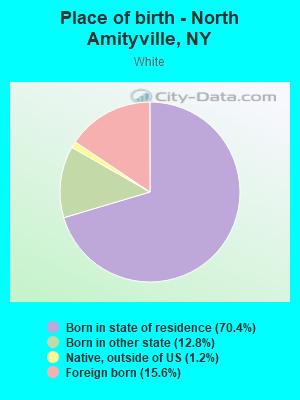
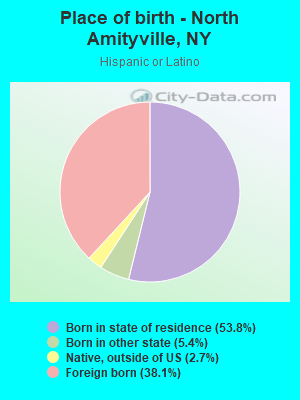
Place of birth - Born in state of residence (%)
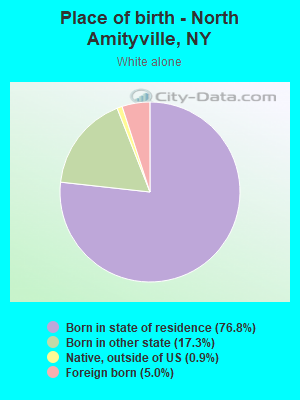
Place of birth - Born in state of residence (%) - White
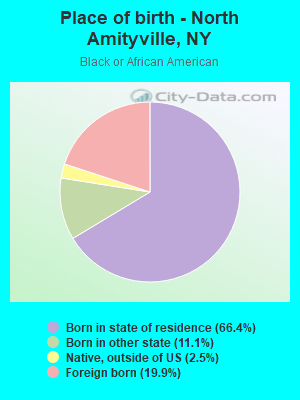
Place of birth - Born in state of residence (%) - Black or African American
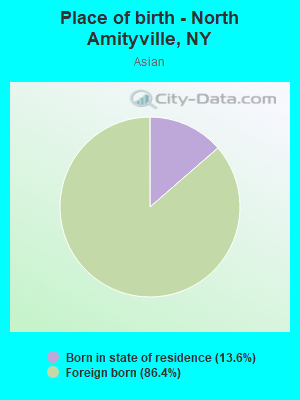
Place of birth - Born in state of residence (%) - Asian
Place of birth - Born in state of residence (%) - Hispanic or Latino
Place of birth - Born in state of residence (%) - American Indian and Alaska Native
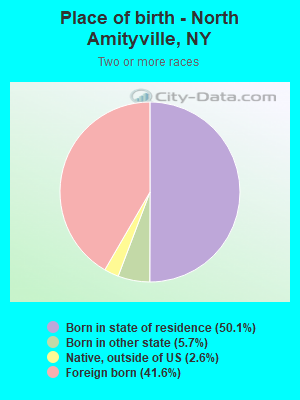
Place of birth - Born in state of residence (%) - Multirace
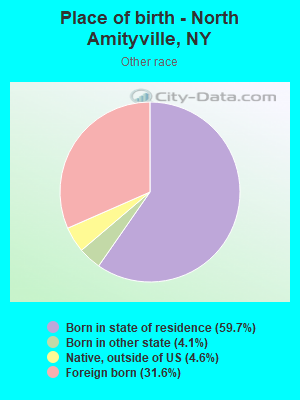
Place of birth - Born in state of residence (%) - Other Race
Place of birth - Born in other state (%)
Place of birth - Born in other state (%) - White
Place of birth - Born in other state (%) - Black or African American
Place of birth - Born in other state (%) - Asian
Place of birth - Born in other state (%) - Hispanic or Latino
Place of birth - Born in other state (%) - American Indian and Alaska Native
Place of birth - Born in other state (%) - Multirace
Place of birth - Born in other state (%) - Other Race
Place of birth - Native, outside of US (%)
Place of birth - Native, outside of US (%) - White
Place of birth - Native, outside of US (%) - Black or African American
Place of birth - Native, outside of US (%) - Asian
Place of birth - Native, outside of US (%) - Hispanic or Latino
Place of birth - Native, outside of US (%) - American Indian and Alaska Native
Place of birth - Native, outside of US (%) - Multirace
Place of birth - Native, outside of US (%) - Other Race
Place of birth - Foreign born (%)
Place of birth - Foreign born (%) - White
Place of birth - Foreign born (%) - Black or African American
Place of birth - Foreign born (%) - Asian
Place of birth - Foreign born (%) - Hispanic or Latino
Place of birth - Foreign born (%) - American Indian and Alaska Native
Place of birth - Foreign born (%) - Multirace
Place of birth - Foreign born (%) - Other Race
Residents speaking English at home (%)
Residents speaking English at home - Born in the United States (%)
Residents speaking English at home - Native, born elsewhere (%)
Residents speaking English at home - Foreign born (%)
Residents speaking Spanish at home (%)
Residents speaking Spanish at home - Born in the United States (%)
Residents speaking Spanish at home - Native, born elsewhere (%)
Residents speaking Spanish at home - Foreign born (%)
Residents speaking other language at home (%)
Residents speaking other language at home - Born in the United States (%)
Residents speaking other language at home - Native, born elsewhere (%)
Residents speaking other language at home - Foreign born (%)
Marital status - Never married (%)
Marital status - Now married (%)
Marital status - Separated (%)
Marital status - Widowed (%)
Marital status - Divorced (%)
Ancestries Reported - Arab (%)
Ancestries Reported - Czech (%)
Ancestries Reported - Danish (%)
Ancestries Reported - Dutch (%)
Ancestries Reported - English (%)
Ancestries Reported - French (%)
Ancestries Reported - French Canadian (%)
Ancestries Reported - German (%)
Ancestries Reported - Greek (%)
Ancestries Reported - Hungarian (%)
Ancestries Reported - Irish (%)
Ancestries Reported - Italian (%)
Ancestries Reported - Lithuanian (%)
Ancestries Reported - Norwegian (%)
Ancestries Reported - Polish (%)
Ancestries Reported - Portuguese (%)
Ancestries Reported - Russian (%)
Ancestries Reported - Scotch-Irish (%)
Ancestries Reported - Scottish (%)
Ancestries Reported - Slovak (%)
Ancestries Reported - Subsaharan African (%)
Ancestries Reported - Swedish (%)
Ancestries Reported - Swiss (%)
Ancestries Reported - Ukrainian (%)
Ancestries Reported - United States (%)
Ancestries Reported - Welsh (%)
Ancestries Reported - West Indian (%)
Ancestries Reported - Other (%)
Geographical mobility - Same house 1 year ago (%)
Geographical mobility - Same house 1 year ago (%) - White
Geographical mobility - Same house 1 year ago (%) - Black or African American
Geographical mobility - Same house 1 year ago (%) - Asian
Geographical mobility - Same house 1 year ago (%) - Hispanic or Latino
Geographical mobility - Same house 1 year ago (%) - American Indian and Alaska Native
Geographical mobility - Same house 1 year ago (%) - Multirace
Geographical mobility - Same house 1 year ago (%) - Other Race
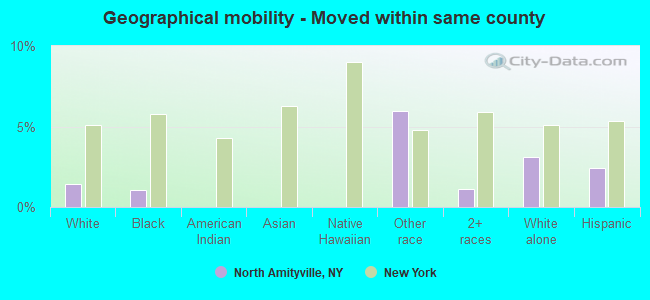
Geographical mobility - Moved within same county (%)
Geographical mobility - Moved within same county (%) - White
Geographical mobility - Moved within same county (%) - Black or African American
Geographical mobility - Moved within same county (%) - Asian
Geographical mobility - Moved within same county (%) - Hispanic or Latino
Geographical mobility - Moved within same county (%) - American Indian and Alaska Native
Geographical mobility - Moved within same county (%) - Multirace
Geographical mobility - Moved within same county (%) - Other Race
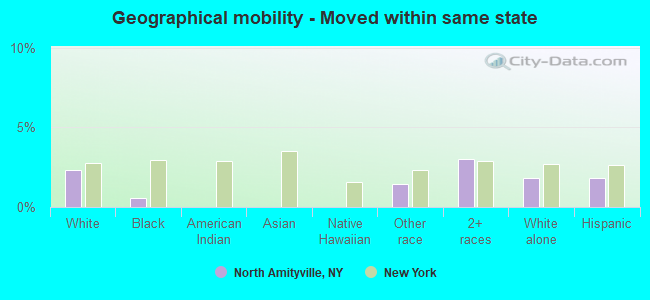
Geographical mobility - Moved from different county within same state (%)
Geographical mobility - Moved from different county within same state (%) - White
Geographical mobility - Moved from different county within same state (%) - Black or African American
Geographical mobility - Moved from different county within same state (%) - Asian
Geographical mobility - Moved from different county within same state (%) - Hispanic or Latino
Geographical mobility - Moved from different county within same state (%) - American Indian and Alaska Native
Geographical mobility - Moved from different county within same state (%) - Multirace
Geographical mobility - Moved from different county within same state (%) - Other Race
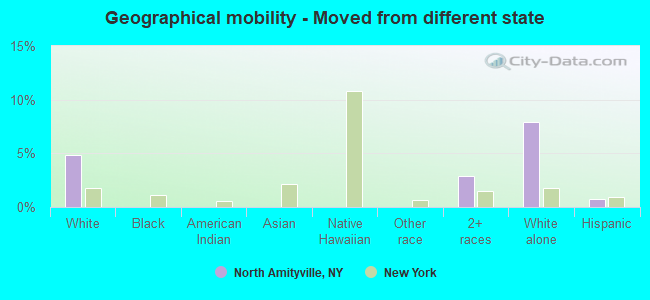
Geographical mobility - Moved from different state (%)
Geographical mobility - Moved from different state (%) - White
Geographical mobility - Moved from different state (%) - Black or African American
Geographical mobility - Moved from different state (%) - Asian
Geographical mobility - Moved from different state (%) - Hispanic or Latino
Geographical mobility - Moved from different state (%) - American Indian and Alaska Native
Geographical mobility - Moved from different state (%) - Multirace
Geographical mobility - Moved from different state (%) - Other Race
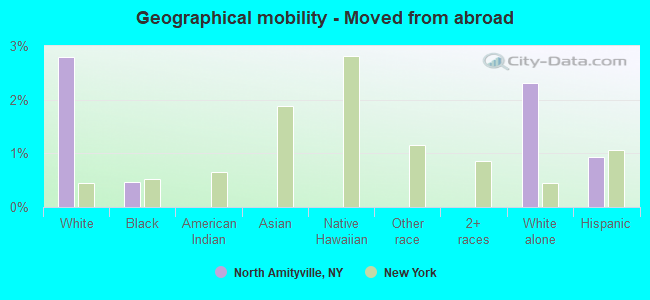
Geographical mobility - Moved from abroad (%)
Geographical mobility - Moved from abroad (%) - White
Geographical mobility - Moved from abroad (%) - Black or African American
Geographical mobility - Moved from abroad (%) - Asian
Geographical mobility - Moved from abroad (%) - Hispanic or Latino
Geographical mobility - Moved from abroad (%) - American Indian and Alaska Native
Geographical mobility - Moved from abroad (%) - Multirace
Geographical mobility - Moved from abroad (%) - Other Race
Place of birth for the foreign-born population - Ireland (%)
Place of birth for the foreign-born population - Denmark (%)
Place of birth for the foreign-born population - Norway (%)
Place of birth for the foreign-born population - Sweden (%)
Place of birth for the foreign-born population - United Kingdom (%)
Place of birth for the foreign-born population - England (%)
Place of birth for the foreign-born population - Scotland (%)
Place of birth for the foreign-born population - Other Northern Europe (%)
Place of birth for the foreign-born population - Austria (%)
Place of birth for the foreign-born population - Belgium (%)
Place of birth for the foreign-born population - France (%)
Place of birth for the foreign-born population - Germany (%)
Place of birth for the foreign-born population - Netherlands (%)
Place of birth for the foreign-born population - Switzerland (%)
Place of birth for the foreign-born population - Other Western Europe (%)
Place of birth for the foreign-born population - Greece (%)
Place of birth for the foreign-born population - Italy (%)
Place of birth for the foreign-born population - Portugal (%)
Place of birth for the foreign-born population - Spain (%)
Place of birth for the foreign-born population - Other Southern Europe (%)
Place of birth for the foreign-born population - Albania (%)
Place of birth for the foreign-born population - Belarus (%)
Place of birth for the foreign-born population - Bosnia and Herzegovina (%)
Place of birth for the foreign-born population - Bulgaria (%)
Place of birth for the foreign-born population - Croatia (%)
Place of birth for the foreign-born population - Czechoslovakia (%)
Place of birth for the foreign-born population - Hungary (%)
Place of birth for the foreign-born population - Latvia (%)
Place of birth for the foreign-born population - Lithuania (%)
Place of birth for the foreign-born population - North Macedonia (Macedonia) (%)
Place of birth for the foreign-born population - Moldova (%)
Place of birth for the foreign-born population - Poland (%)
Place of birth for the foreign-born population - Romania (%)
Place of birth for the foreign-born population - Russia (%)
Place of birth for the foreign-born population - Serbia (%)
Place of birth for the foreign-born population - Ukraine (%)
Place of birth for the foreign-born population - Other Eastern Europe (%)
Place of birth for the foreign-born population - China (%)
Place of birth for the foreign-born population - Hong Kong (%)
Place of birth for the foreign-born population - Taiwan (%)
Place of birth for the foreign-born population - Japan (%)
Place of birth for the foreign-born population - Korea (%)
Place of birth for the foreign-born population - Other Eastern Asia (%)
Place of birth for the foreign-born population - Afghanistan (%)
Place of birth for the foreign-born population - Bangladesh (%)
Place of birth for the foreign-born population - India (%)
Place of birth for the foreign-born population - Iran (%)
Place of birth for the foreign-born population - Kazakhstan (%)
Place of birth for the foreign-born population - Nepal (%)
Place of birth for the foreign-born population - Pakistan (%)
Place of birth for the foreign-born population - Sri Lanka (%)
Place of birth for the foreign-born population - Uzbekistan (%)
Place of birth for the foreign-born population - Other South Central Asia (%)
Place of birth for the foreign-born population - Burma (%)
Place of birth for the foreign-born population - Cambodia (%)
Place of birth for the foreign-born population - Indonesia (%)
Place of birth for the foreign-born population - Laos (%)
Place of birth for the foreign-born population - Malaysia (%)
Place of birth for the foreign-born population - Philippines (%)
Place of birth for the foreign-born population - Singapore (%)
Place of birth for the foreign-born population - Thailand (%)
Place of birth for the foreign-born population - Vietnam (%)
Place of birth for the foreign-born population - Other South Eastern Asia (%)
Place of birth for the foreign-born population - Armenia (%)
Place of birth for the foreign-born population - Iraq (%)
Place of birth for the foreign-born population - Israel (%)
Place of birth for the foreign-born population - Jordan (%)
Place of birth for the foreign-born population - Kuwait (%)
Place of birth for the foreign-born population - Lebanon (%)
Place of birth for the foreign-born population - Saudi Arabia (%)
Place of birth for the foreign-born population - Syria (%)
Place of birth for the foreign-born population - Turkey (%)
Place of birth for the foreign-born population - Yemen (%)
Place of birth for the foreign-born population - Other Western Asia (%)
Place of birth for the foreign-born population - Eritrea (%)
Place of birth for the foreign-born population - Ethiopia (%)
Place of birth for the foreign-born population - Kenya (%)
Place of birth for the foreign-born population - Somalia (%)
Place of birth for the foreign-born population - Uganda (%)
Place of birth for the foreign-born population - Zimbabwe (%)
Place of birth for the foreign-born population - Other Eastern Africa (%)
Place of birth for the foreign-born population - Cameroon (%)
Place of birth for the foreign-born population - Congo (%)
Place of birth for the foreign-born population - Democratic Republic of Congo (Zaire) (%)
Place of birth for the foreign-born population - Other Middle Africa (%)
Place of birth for the foreign-born population - Egypt (%)
Place of birth for the foreign-born population - Morocco (%)
Place of birth for the foreign-born population - Sudan (%)
Place of birth for the foreign-born population - Other Northern Africa (%)
Place of birth for the foreign-born population - South Africa (%)
Place of birth for the foreign-born population - Other Southern Africa (%)
Place of birth for the foreign-born population - Cabo Verde (%)
Place of birth for the foreign-born population - Ghana (%)
Place of birth for the foreign-born population - Liberia (%)
Place of birth for the foreign-born population - Nigeria (%)
Place of birth for the foreign-born population - Senegal (%)
Place of birth for the foreign-born population - Sierra Leone (%)
Place of birth for the foreign-born population - Other Western Africa (%)
Place of birth for the foreign-born population - Australia (%)
Place of birth for the foreign-born population - New Zealand (%)
Place of birth for the foreign-born population - Fiji (%)
Place of birth for the foreign-born population - Micronesia (%)
Place of birth for the foreign-born population - Bahamas (%)
Place of birth for the foreign-born population - Barbados (%)
Place of birth for the foreign-born population - Cuba (%)
Place of birth for the foreign-born population - Dominica (%)
Place of birth for the foreign-born population - Dominican Republic (%)
Place of birth for the foreign-born population - Grenada (%)
Place of birth for the foreign-born population - Haiti (%)
Place of birth for the foreign-born population - Jamaica (%)
Place of birth for the foreign-born population - St. Vincent and the Grenadines (%)
Place of birth for the foreign-born population - Trinidad and Tobago (%)
Place of birth for the foreign-born population - West Indies (%)
Place of birth for the foreign-born population - Other Caribbean (%)
Place of birth for the foreign-born population - Belize (%)
Place of birth for the foreign-born population - Costa Rica (%)
Place of birth for the foreign-born population - El Salvador (%)
Place of birth for the foreign-born population - Guatemala (%)
Place of birth for the foreign-born population - Honduras (%)
Place of birth for the foreign-born population - Mexico (%)
Place of birth for the foreign-born population - Nicaragua (%)
Place of birth for the foreign-born population - Panama (%)
Place of birth for the foreign-born population - Other Central America (%)
Place of birth for the foreign-born population - Argentina (%)
Place of birth for the foreign-born population - Bolivia (%)
Place of birth for the foreign-born population - Brazil (%)
Place of birth for the foreign-born population - Chile (%)
Place of birth for the foreign-born population - Colombia (%)
Place of birth for the foreign-born population - Ecuador (%)
Place of birth for the foreign-born population - Guyana (%)
Place of birth for the foreign-born population - Peru (%)
Place of birth for the foreign-born population - Uruguay (%)
Place of birth for the foreign-born population - Venezuela (%)
Place of birth for the foreign-born population - Other South America (%)
Place of birth for the foreign-born population - Canada (%)
Place of birth for the foreign-born population - Other Northern America (%)
Place of birth for the foreign-born population - Other (%)
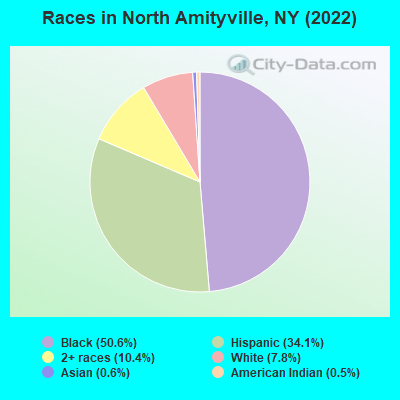
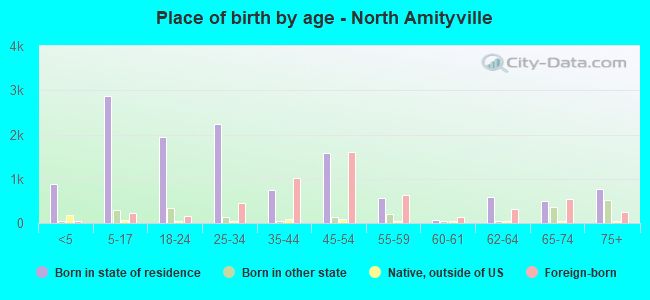
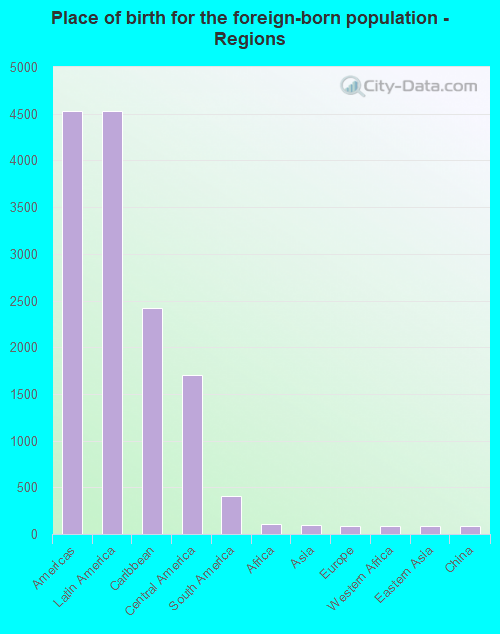
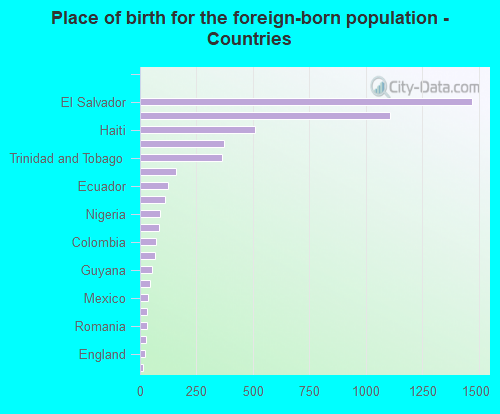
According to 2022 data, the most numerous races in North Amityville, NY are White alone (1,595 residents), Hispanic (6,930 residents), and Black alone (10,293 residents). 71.1% of North Amityville residents speak English at home. 23.7% of North Amityville, NY residents are foreign-born (22.5% born in Latin America), which is 7.2% greater than the foreign-born rate of 22.0% across the entire state of New York.
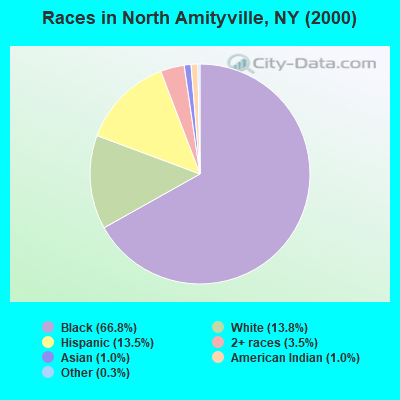
Race distribution in North Amityville
2000 2022
11,760,981 62.0% White alone 2,867,583 15.1% Hispanic 2,812,623 14.8% Black alone 1,035,926 5.5% Asian alone 366,116 1.9% Two or more races 75,499 0.4% Other race alone 52,499 0.3% American Indian alone 5,230 0.03% Native Hawaiian and Other
10,408,933 52.9% White alone 3,867,299 19.7% Hispanic 2,633,840 13.4% Black alone 1,776,286 9.0% Asian alone 732,670 3.7% Two or more races 216,110 1.1% Other race alone 35,082 0.2% American Indian alone 6,931 0.04% Native Hawaiian and Other
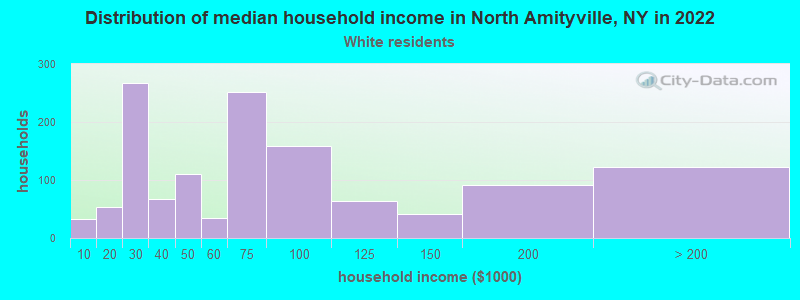
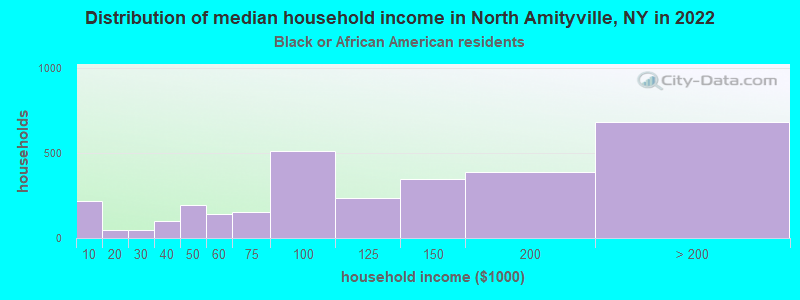
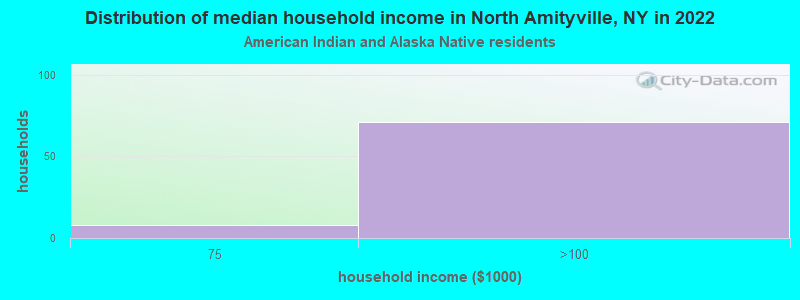
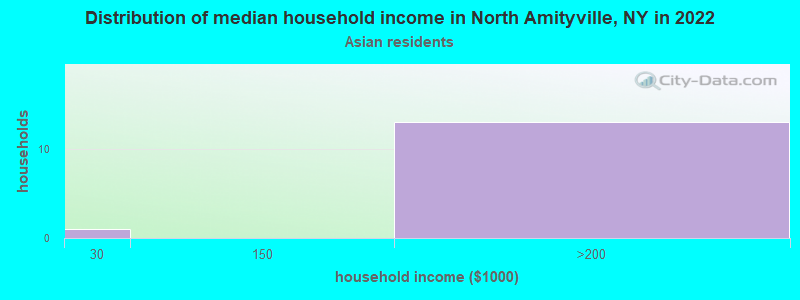
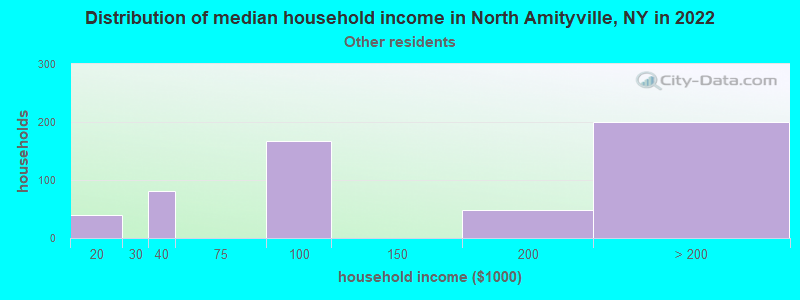
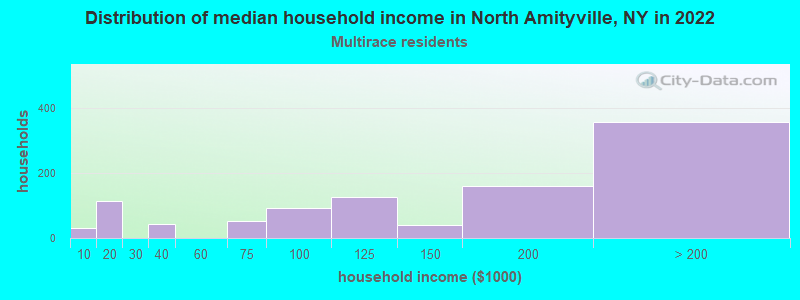
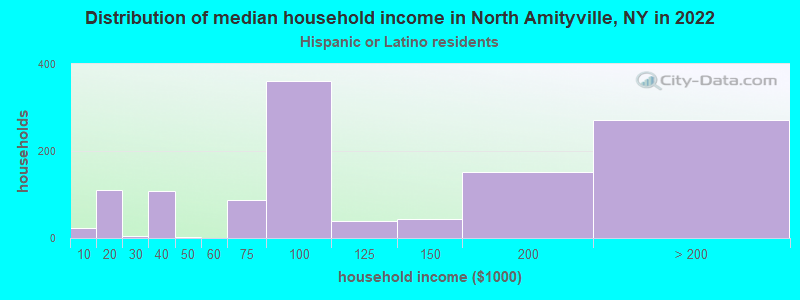
Income and house value in North Amityville Median household income in 2022 $40,832 White non-Hispanic householders$116,772 Black householders$83,055 American Indian and Alaska Native householders$149,575 Two or more races householders$84,453 Hispanic or Latino race householdersMedian 2022 house value $406,051 White Non-Hispanic householders$501,224 Black or African American householders$400,493 American Indian or Alaska Native householders $477,605 Asian householders$538,044 Some other race householders$433,144 Two or more races householders$502,961 Hispanic or Latino householders
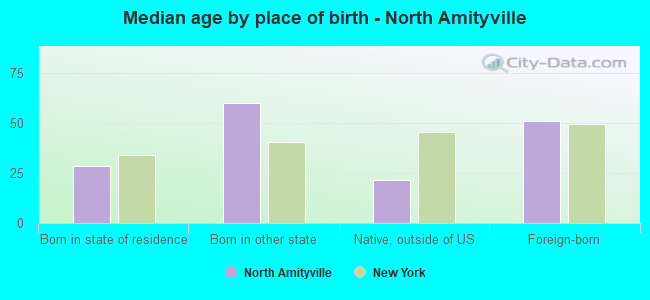
Median age by race in North Amityville
46.8 Median age for White residents41.5 55.4 41.7 Median age for Black or African American residents33.2 46.3 67.3 Median age for American Indian / Alaska Native residents42.2 -513,692,161.9 38.4 Median age for Asian residents35.9 53.1 -742,816,091.2 Median age for Native Hawaiian / Pacific Islander residents-831,187,409.8 -771,300,447.7 22.0 Median age for Other race residents18.3 23.2 32.6 Median age for Two or more races residents32.3 29.9 71.2 Median age for White alone residents50.5 75.0 25.5 Median age for Hispanic or Latino residents25.5 24.1
Owner/renter occupied households by race in North Amityville
House owners and renters - White residents 370 30.6% Owner occupied840 69.4% Renter occupiedHouse owners and renters - Black or African American residents 2,178 68.5% Owner occupied1,000 31.5% Renter occupiedHouse owners and renters - American Indian / Alaska Native residents 30 31.4% Owner occupied66 68.6% Renter occupiedHouse owners and renters - Asian residents 14 100.0% Owner occupiedHouse owners and renters - Native Hawaiian / Pacific Islander residents 8 100.0% Owner occupiedHouse owners and renters - Other race residents 327 51.0% Owner occupied315 49.0% Renter occupiedHouse owners and renters - Two or more races residents 754 75.8% Owner occupied241 24.2% Renter occupiedHouse owners and renters - White alone residents 133 13.8% Owner occupied827 86.2% Renter occupiedHouse owners and renters - Hispanic or Latino residents 715 59.6% Owner occupied485 40.4% Renter occupied
Language usage in North Amityville
English speakers - Total 71.1% of residents of North Amityville speak English at home.
22.4% of residents speak Spanish at home 2,413 55.8% Speak English very well1,913 44.2% Speak English less than very well6.6% of residents speak other language at home 842 66.1% Speak English very well431 33.9% Speak English less than very well
English speakers - Born in the United States 83.7% of residents of North Amityville speak English at home.
13.3% of residents speak Spanish at home 193 73.1% Speak English very well71 26.9% Speak English less than very well
English speakers - Native, born elsewhere 87.8% of residents of North Amityville speak English at home.
17.6% of residents speak Spanish at home 53 89.8% Speak English very well6 10.2% Speak English less than very well
English speakers - Foreign-born 42.2% of residents of North Amityville speak English at home.
41.3% of residents speak Spanish at home 412 19.1% Speak English very well1,750 80.9% Speak English less than very well16.3% of residents speak other language at home 416 48.7% Speak English very well439 51.3% Speak English less than very well
White (Caucasian) - Speak only English Native:
68.6% (1,646)Foreign-born:
25.5% (119)
White (Caucasian) - Speak another language Native:
24.4% (586)Foreign-born:
73.2% (340)
Black or African American - Speak only English Native:
93.4% (7,476)Foreign-born:
76.4% (1,618)
Black or African American - Speak another language Native:
4.8% (387)Foreign-born:
27.9% (592)
Asian - Speak another language Native:
100.0% (15)Foreign-born:
100.0% (100)
Other race - Speak only English Native:
63.1% (1,591)Foreign-born:
24.2% (345)
Other race - Speak another language Native:
39.6% (999)Foreign-born:
72.1% (1,028)
Two or more races - Speak only English Native:
61.0% (1,516)Foreign-born:
33.1% (584)
Two or more races - Speak another language Native:
38.8% (964)Foreign-born:
64.2% (1,133)
White alone - Speak only English Native:
88.6% (1,339)Foreign-born:
8.6% (7)
White alone - Speak another language Native:
11.9% (179)Foreign-born:
91.4% (73)
Hispanic or Latino - Speak only English Native:
43.3% (1,592)Foreign-born:
19.1% (503)
Hispanic or Latino - Speak another language Native:
56.3% (2,069)Foreign-born:
79.7% (2,100)
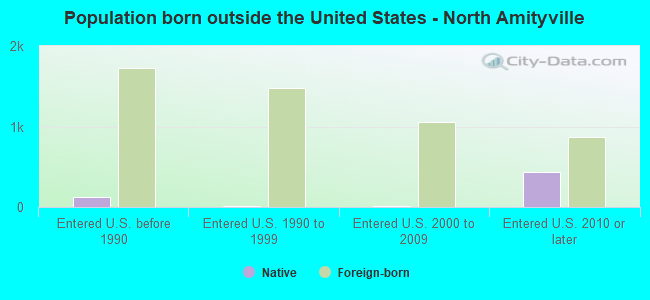
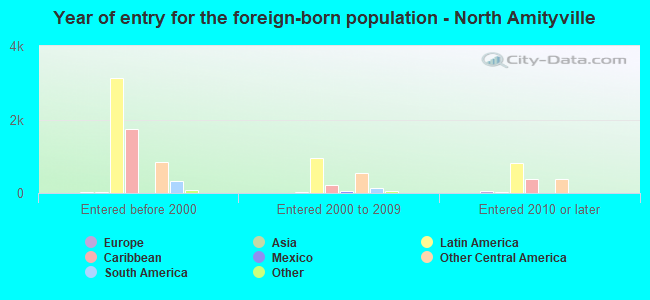
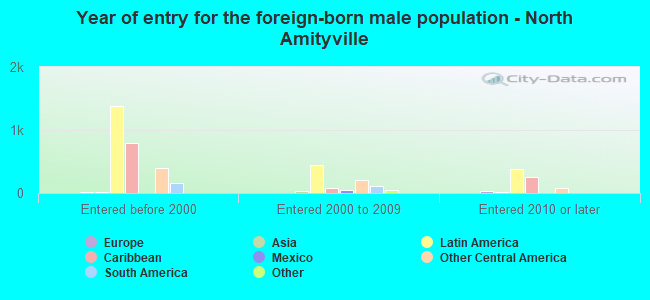
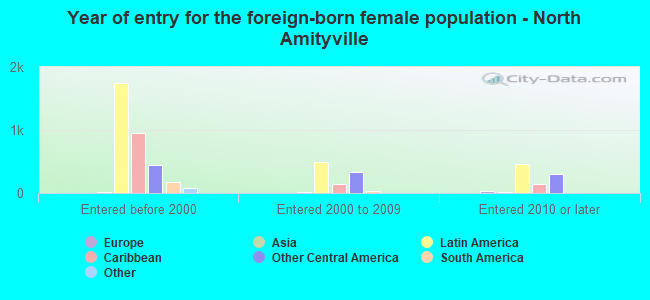
Foreign-born residents in North Amityville 4,822 residents are foreign born (22.5% Latin America ).
This city:
23.7%New York:
22.6%
Marital status for residents in North Amityville Marital status - White (Caucasian) population 15 years and over
Males 64.2% Never married24.4% Now married6.8% Separated3.5% Widowed1.1% DivorcedFemales 42.2% Never married19.7% Now married3.0% Separated25.4% Widowed9.7% DivorcedWomen who did not give birth in the past 12 months Now married:
30.8% (140)Unmarried:
69.2% (314)
Marital status - Black or African American population 15 years and over
Males 57.9% Never married32.2% Now married0.3% Separated1.5% Widowed8.0% DivorcedFemales 48.0% Never married30.0% Now married2.0% Separated5.3% Widowed14.8% DivorcedWomen who gave birth in the past 12 months Now married:
68.5% (37)Unmarried:
31.5% (17)
Women who did not give birth in the past 12 months Now married:
23.5% (569)Unmarried:
76.5% (1,853)
Marital status - American Indian / Alaska Native population 15 years and over
Males 67.7% Never married0.0% Now married0.0% Separated32.3% Widowed0.0% DivorcedFemales 56.3% Never married0.0% Now married0.0% Separated0.0% Widowed43.8% DivorcedMarital status - Asian population 15 years and over
Males 0.0% Never married63.4% Now married0.0% Separated2.4% Widowed34.1% DivorcedFemales 25.0% Never married75.0% Now married0.0% Separated0.0% Widowed0.0% DivorcedWomen who did not give birth in the past 12 months Now married:
50.0% (12)Unmarried:
50.0% (12)
Marital status - Other race population 15 years and over
Males 36.5% Never married62.5% Now married0.0% Separated0.0% Widowed1.0% DivorcedFemales 48.4% Never married41.1% Now married2.0% Separated0.0% Widowed8.5% DivorcedWomen who gave birth in the past 12 months Now married:
79.4% (73)Unmarried:
20.6% (19)
Women who did not give birth in the past 12 months Now married:
43.9% (550)Unmarried:
56.1% (702)
Marital status - Two or more races population 15 years and over
Males 64.3% Never married25.6% Now married0.0% Separated0.0% Widowed10.1% DivorcedFemales 42.2% Never married39.4% Now married3.7% Separated0.0% Widowed14.6% DivorcedWomen who did not give birth in the past 12 months Now married:
48.4% (550)Unmarried:
51.6% (587)
Marital status - White alone, not Hispanic / Latino population 15 years and over
Males 46.4% Never married28.9% Now married10.7% Separated10.7% Widowed3.4% DivorcedFemales 39.2% Never married15.1% Now married4.0% Separated34.4% Widowed7.2% DivorcedWomen who did not give birth in the past 12 months Now married:
28.3% (54)Unmarried:
71.7% (138)
Marital status - Hispanic or Latino population 15 years and over
Males 54.6% Never married38.0% Now married2.2% Separated0.0% Widowed5.2% DivorcedFemales 47.3% Never married38.6% Now married2.8% Separated0.0% Widowed11.3% DivorcedWomen who gave birth in the past 12 months Now married:
62.5% (52)Unmarried:
37.5% (31)
Women who did not give birth in the past 12 months Now married:
42.8% (737)Unmarried:
57.2% (986)
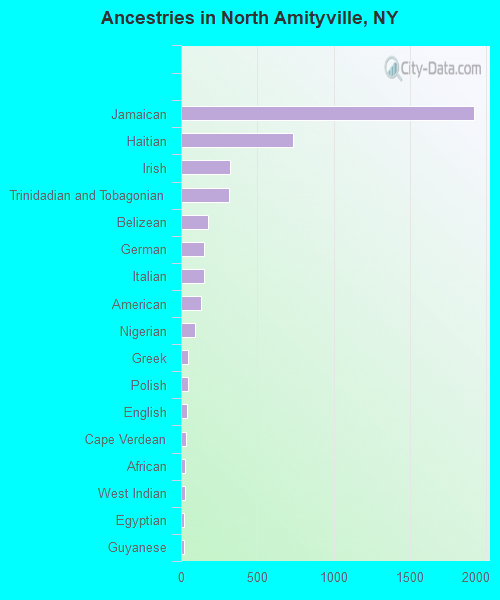
Ancestries in North Amityville
1,923 17.7% Jamaican732 6.7% Haitian323 3.0% Irish315 2.9% Trinidadian and Tobagonian174 1.6% Belizean154 1.4% German149 1.4% Italian131 1.2% American94 0.9% Nigerian46 0.4% Greek46 0.4% Polish42 0.4% English35 0.3% Cape Verdean29 0.3% African26 0.2% West Indian20 0.2% Egyptian18 0.2% Guyanese15 0.1% Romanian12 0.1% Scottish5 0.05% Scotch-Irish
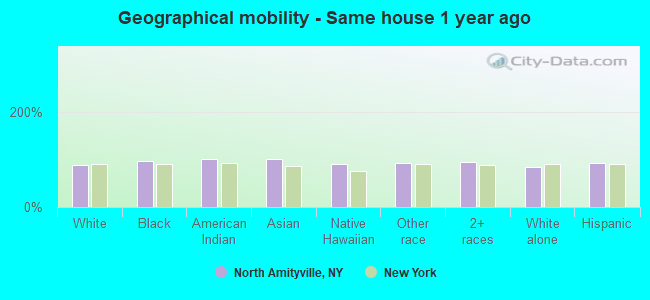
Geographical mobility in North Amityville Same house 1 year ago 2,680 87.4% White (Caucasian)10,267 97.3% Black or African American177 100.0% American Indian / Alaska Native122 100.0% Asian6 89.7% Native Hawaiian / Pacific Islander4,049 91.6% Other race3,979 93.7% Two or more races1,329 83.2% White alone, not Hispanic / Latino6,319 93.0% Hispanic or LatinoMoved within same county 44 1.4% White / Caucasian110 1.0% Black or African American262 5.9% Other race48 1.1% Two or more races49 3.1% White alone, not Hispanic / Latino163 2.4% Hispanic or LatinoMoved within same state 71 2.3% White / Caucasian61 0.6% Black or African American65 1.5% Other race127 3.0% Two or more races29 1.8% White alone, not Hispanic / Latino122 1.8% Hispanic or LatinoMoved from different state 149 4.9% White / Caucasian122 2.9% Two or more races126 7.9% White alone, not Hispanic / Latino51 0.7% Hispanic or LatinoMoved from abroad 86 2.8% White50 0.5% Black or African American37 2.3% White alone, not Hispanic / Latino63 0.9% Hispanic or Latino
Children Nativity (place of birth) in North Amityville
Children under 6 years - Living with two parents Both parents native 244 100.0% NativeBoth parents foreign-born 157 100.0% NativeOne native, one foreign-born parent 89 100.0% NativeChildren under 6 years - Living with one parent Native parent 364 100.0% NativeForeign-born parent 430 100.0% NativeChildren 6 to 17 years - Living with two parents Both parents native 215 100.0% Native0 0.0% Foreign-bornBoth parents foreign-born 917 98.3% Native16 1.7% Foreign-bornOne native, one foreign-born parent 109 100.0% NativeChildren 6 to 17 years - Living with one parent Native parent 742 100.0% NativeForeign-born parent 540 56.4% Native418 43.6% Foreign-born
Grandparents responsible for own grandchildren in North Amityville
Grandparents (30 to 59 years) Black or African American 64 64.1% Responsible for grandchildren36 35.9% Not responsible for grandchildrenOther race 13 16.5% Responsible for grandchildren68 83.5% Not responsible for grandchildrenTwo or more races 47 100.0% Not responsible for grandchildrenHispanic or Latino 15 18.0% Responsible for grandchildren69 82.0% Not responsible for grandchildrenGrandparents (60 years and over) Black or African American 81 16.8% Responsible for grandchildren401 83.2% Not responsible for grandchildrenOther race 130 100.0% Not responsible for grandchildrenTwo or more races 114 100.0% Not responsible for grandchildrenHispanic or Latino 199 100.0% Not responsible for grandchildren