Races in Norman, Oklahoma (OK) Detailed Stats
Data:
Races - White alone (%)
Races - White alone (% change since 2000)
Races - Black alone (%)
Races - Black alone (% change since 2000)
Races - American Indian alone (%)
Races - American Indian alone (% change since 2000)
Races - Asian alone (%)
Races - Asian alone (% change since 2000)
Races - Hispanic (%)
Races - Hispanic (% change since 2000)
Races - Native Hawaiian and Other Pacific Islander alone (%)
Races - Native Hawaiian and Other Pacific Islander alone (% change since 2000)
Races - Two or more races(%)
Races - Two or more races(% change since 2000)
Races - Other race alone (%)
Races - Other race alone (% change since 2000)
Racial diversity
Place of birth - Born in state of residence (%)
Place of birth - Born in state of residence (%) - White
Place of birth - Born in state of residence (%) - Black or African American
Place of birth - Born in state of residence (%) - Asian
Place of birth - Born in state of residence (%) - Hispanic or Latino
Place of birth - Born in state of residence (%) - American Indian and Alaska Native
Place of birth - Born in state of residence (%) - Multirace
Place of birth - Born in state of residence (%) - Other Race
Place of birth - Born in other state (%)
Place of birth - Born in other state (%) - White
Place of birth - Born in other state (%) - Black or African American
Place of birth - Born in other state (%) - Asian
Place of birth - Born in other state (%) - Hispanic or Latino
Place of birth - Born in other state (%) - American Indian and Alaska Native
Place of birth - Born in other state (%) - Multirace
Place of birth - Born in other state (%) - Other Race
Place of birth - Native, outside of US (%)
Place of birth - Native, outside of US (%) - White
Place of birth - Native, outside of US (%) - Black or African American
Place of birth - Native, outside of US (%) - Asian
Place of birth - Native, outside of US (%) - Hispanic or Latino
Place of birth - Native, outside of US (%) - American Indian and Alaska Native
Place of birth - Native, outside of US (%) - Multirace
Place of birth - Native, outside of US (%) - Other Race
Place of birth - Foreign born (%)
Place of birth - Foreign born (%) - White
Place of birth - Foreign born (%) - Black or African American
Place of birth - Foreign born (%) - Asian
Place of birth - Foreign born (%) - Hispanic or Latino
Place of birth - Foreign born (%) - American Indian and Alaska Native
Place of birth - Foreign born (%) - Multirace
Place of birth - Foreign born (%) - Other Race
Residents speaking English at home (%)
Residents speaking English at home - Born in the United States (%)
Residents speaking English at home - Native, born elsewhere (%)
Residents speaking English at home - Foreign born (%)
Residents speaking Spanish at home (%)
Residents speaking Spanish at home - Born in the United States (%)
Residents speaking Spanish at home - Native, born elsewhere (%)
Residents speaking Spanish at home - Foreign born (%)
Residents speaking other language at home (%)
Residents speaking other language at home - Born in the United States (%)
Residents speaking other language at home - Native, born elsewhere (%)
Residents speaking other language at home - Foreign born (%)
Marital status - Never married (%)
Marital status - Now married (%)
Marital status - Separated (%)
Marital status - Widowed (%)
Marital status - Divorced (%)
Ancestries Reported - Arab (%)
Ancestries Reported - Czech (%)
Ancestries Reported - Danish (%)
Ancestries Reported - Dutch (%)
Ancestries Reported - English (%)
Ancestries Reported - French (%)
Ancestries Reported - French Canadian (%)
Ancestries Reported - German (%)
Ancestries Reported - Greek (%)
Ancestries Reported - Hungarian (%)
Ancestries Reported - Irish (%)
Ancestries Reported - Italian (%)
Ancestries Reported - Lithuanian (%)
Ancestries Reported - Norwegian (%)
Ancestries Reported - Polish (%)
Ancestries Reported - Portuguese (%)
Ancestries Reported - Russian (%)
Ancestries Reported - Scotch-Irish (%)
Ancestries Reported - Scottish (%)
Ancestries Reported - Slovak (%)
Ancestries Reported - Subsaharan African (%)
Ancestries Reported - Swedish (%)
Ancestries Reported - Swiss (%)
Ancestries Reported - Ukrainian (%)
Ancestries Reported - United States (%)
Ancestries Reported - Welsh (%)
Ancestries Reported - West Indian (%)
Ancestries Reported - Other (%)
Geographical mobility - Same house 1 year ago (%)
Geographical mobility - Same house 1 year ago (%) - White
Geographical mobility - Same house 1 year ago (%) - Black or African American
Geographical mobility - Same house 1 year ago (%) - Asian
Geographical mobility - Same house 1 year ago (%) - Hispanic or Latino
Geographical mobility - Same house 1 year ago (%) - American Indian and Alaska Native
Geographical mobility - Same house 1 year ago (%) - Multirace
Geographical mobility - Same house 1 year ago (%) - Other Race
Geographical mobility - Moved within same county (%)
Geographical mobility - Moved within same county (%) - White
Geographical mobility - Moved within same county (%) - Black or African American
Geographical mobility - Moved within same county (%) - Asian
Geographical mobility - Moved within same county (%) - Hispanic or Latino
Geographical mobility - Moved within same county (%) - American Indian and Alaska Native
Geographical mobility - Moved within same county (%) - Multirace
Geographical mobility - Moved within same county (%) - Other Race
Geographical mobility - Moved from different county within same state (%)
Geographical mobility - Moved from different county within same state (%) - White
Geographical mobility - Moved from different county within same state (%) - Black or African American
Geographical mobility - Moved from different county within same state (%) - Asian
Geographical mobility - Moved from different county within same state (%) - Hispanic or Latino
Geographical mobility - Moved from different county within same state (%) - American Indian and Alaska Native
Geographical mobility - Moved from different county within same state (%) - Multirace
Geographical mobility - Moved from different county within same state (%) - Other Race
Geographical mobility - Moved from different state (%)
Geographical mobility - Moved from different state (%) - White
Geographical mobility - Moved from different state (%) - Black or African American
Geographical mobility - Moved from different state (%) - Asian
Geographical mobility - Moved from different state (%) - Hispanic or Latino
Geographical mobility - Moved from different state (%) - American Indian and Alaska Native
Geographical mobility - Moved from different state (%) - Multirace
Geographical mobility - Moved from different state (%) - Other Race
Geographical mobility - Moved from abroad (%)
Geographical mobility - Moved from abroad (%) - White
Geographical mobility - Moved from abroad (%) - Black or African American
Geographical mobility - Moved from abroad (%) - Asian
Geographical mobility - Moved from abroad (%) - Hispanic or Latino
Geographical mobility - Moved from abroad (%) - American Indian and Alaska Native
Geographical mobility - Moved from abroad (%) - Multirace
Geographical mobility - Moved from abroad (%) - Other Race
Place of birth for the foreign-born population - Ireland (%)
Place of birth for the foreign-born population - Denmark (%)
Place of birth for the foreign-born population - Norway (%)
Place of birth for the foreign-born population - Sweden (%)
Place of birth for the foreign-born population - United Kingdom (%)
Place of birth for the foreign-born population - England (%)
Place of birth for the foreign-born population - Scotland (%)
Place of birth for the foreign-born population - Other Northern Europe (%)
Place of birth for the foreign-born population - Austria (%)
Place of birth for the foreign-born population - Belgium (%)
Place of birth for the foreign-born population - France (%)
Place of birth for the foreign-born population - Germany (%)
Place of birth for the foreign-born population - Netherlands (%)
Place of birth for the foreign-born population - Switzerland (%)
Place of birth for the foreign-born population - Other Western Europe (%)
Place of birth for the foreign-born population - Greece (%)
Place of birth for the foreign-born population - Italy (%)
Place of birth for the foreign-born population - Portugal (%)
Place of birth for the foreign-born population - Spain (%)
Place of birth for the foreign-born population - Other Southern Europe (%)
Place of birth for the foreign-born population - Albania (%)
Place of birth for the foreign-born population - Belarus (%)
Place of birth for the foreign-born population - Bosnia and Herzegovina (%)
Place of birth for the foreign-born population - Bulgaria (%)
Place of birth for the foreign-born population - Croatia (%)
Place of birth for the foreign-born population - Czechoslovakia (%)
Place of birth for the foreign-born population - Hungary (%)
Place of birth for the foreign-born population - Latvia (%)
Place of birth for the foreign-born population - Lithuania (%)
Place of birth for the foreign-born population - North Macedonia (Macedonia) (%)
Place of birth for the foreign-born population - Moldova (%)
Place of birth for the foreign-born population - Poland (%)
Place of birth for the foreign-born population - Romania (%)
Place of birth for the foreign-born population - Russia (%)
Place of birth for the foreign-born population - Serbia (%)
Place of birth for the foreign-born population - Ukraine (%)
Place of birth for the foreign-born population - Other Eastern Europe (%)
Place of birth for the foreign-born population - China (%)
Place of birth for the foreign-born population - Hong Kong (%)
Place of birth for the foreign-born population - Taiwan (%)
Place of birth for the foreign-born population - Japan (%)
Place of birth for the foreign-born population - Korea (%)
Place of birth for the foreign-born population - Other Eastern Asia (%)
Place of birth for the foreign-born population - Afghanistan (%)
Place of birth for the foreign-born population - Bangladesh (%)
Place of birth for the foreign-born population - India (%)
Place of birth for the foreign-born population - Iran (%)
Place of birth for the foreign-born population - Kazakhstan (%)
Place of birth for the foreign-born population - Nepal (%)
Place of birth for the foreign-born population - Pakistan (%)
Place of birth for the foreign-born population - Sri Lanka (%)
Place of birth for the foreign-born population - Uzbekistan (%)
Place of birth for the foreign-born population - Other South Central Asia (%)
Place of birth for the foreign-born population - Burma (%)
Place of birth for the foreign-born population - Cambodia (%)
Place of birth for the foreign-born population - Indonesia (%)
Place of birth for the foreign-born population - Laos (%)
Place of birth for the foreign-born population - Malaysia (%)
Place of birth for the foreign-born population - Philippines (%)
Place of birth for the foreign-born population - Singapore (%)
Place of birth for the foreign-born population - Thailand (%)
Place of birth for the foreign-born population - Vietnam (%)
Place of birth for the foreign-born population - Other South Eastern Asia (%)
Place of birth for the foreign-born population - Armenia (%)
Place of birth for the foreign-born population - Iraq (%)
Place of birth for the foreign-born population - Israel (%)
Place of birth for the foreign-born population - Jordan (%)
Place of birth for the foreign-born population - Kuwait (%)
Place of birth for the foreign-born population - Lebanon (%)
Place of birth for the foreign-born population - Saudi Arabia (%)
Place of birth for the foreign-born population - Syria (%)
Place of birth for the foreign-born population - Turkey (%)
Place of birth for the foreign-born population - Yemen (%)
Place of birth for the foreign-born population - Other Western Asia (%)
Place of birth for the foreign-born population - Eritrea (%)
Place of birth for the foreign-born population - Ethiopia (%)
Place of birth for the foreign-born population - Kenya (%)
Place of birth for the foreign-born population - Somalia (%)
Place of birth for the foreign-born population - Uganda (%)
Place of birth for the foreign-born population - Zimbabwe (%)
Place of birth for the foreign-born population - Other Eastern Africa (%)
Place of birth for the foreign-born population - Cameroon (%)
Place of birth for the foreign-born population - Congo (%)
Place of birth for the foreign-born population - Democratic Republic of Congo (Zaire) (%)
Place of birth for the foreign-born population - Other Middle Africa (%)
Place of birth for the foreign-born population - Egypt (%)
Place of birth for the foreign-born population - Morocco (%)
Place of birth for the foreign-born population - Sudan (%)
Place of birth for the foreign-born population - Other Northern Africa (%)
Place of birth for the foreign-born population - South Africa (%)
Place of birth for the foreign-born population - Other Southern Africa (%)
Place of birth for the foreign-born population - Cabo Verde (%)
Place of birth for the foreign-born population - Ghana (%)
Place of birth for the foreign-born population - Liberia (%)
Place of birth for the foreign-born population - Nigeria (%)
Place of birth for the foreign-born population - Senegal (%)
Place of birth for the foreign-born population - Sierra Leone (%)
Place of birth for the foreign-born population - Other Western Africa (%)
Place of birth for the foreign-born population - Australia (%)
Place of birth for the foreign-born population - New Zealand (%)
Place of birth for the foreign-born population - Fiji (%)
Place of birth for the foreign-born population - Micronesia (%)
Place of birth for the foreign-born population - Bahamas (%)
Place of birth for the foreign-born population - Barbados (%)
Place of birth for the foreign-born population - Cuba (%)
Place of birth for the foreign-born population - Dominica (%)
Place of birth for the foreign-born population - Dominican Republic (%)
Place of birth for the foreign-born population - Grenada (%)
Place of birth for the foreign-born population - Haiti (%)
Place of birth for the foreign-born population - Jamaica (%)
Place of birth for the foreign-born population - St. Vincent and the Grenadines (%)
Place of birth for the foreign-born population - Trinidad and Tobago (%)
Place of birth for the foreign-born population - West Indies (%)
Place of birth for the foreign-born population - Other Caribbean (%)
Place of birth for the foreign-born population - Belize (%)
Place of birth for the foreign-born population - Costa Rica (%)
Place of birth for the foreign-born population - El Salvador (%)
Place of birth for the foreign-born population - Guatemala (%)
Place of birth for the foreign-born population - Honduras (%)
Place of birth for the foreign-born population - Mexico (%)
Place of birth for the foreign-born population - Nicaragua (%)
Place of birth for the foreign-born population - Panama (%)
Place of birth for the foreign-born population - Other Central America (%)
Place of birth for the foreign-born population - Argentina (%)
Place of birth for the foreign-born population - Bolivia (%)
Place of birth for the foreign-born population - Brazil (%)
Place of birth for the foreign-born population - Chile (%)
Place of birth for the foreign-born population - Colombia (%)
Place of birth for the foreign-born population - Ecuador (%)
Place of birth for the foreign-born population - Guyana (%)
Place of birth for the foreign-born population - Peru (%)
Place of birth for the foreign-born population - Uruguay (%)
Place of birth for the foreign-born population - Venezuela (%)
Place of birth for the foreign-born population - Other South America (%)
Place of birth for the foreign-born population - Canada (%)
Place of birth for the foreign-born population - Other Northern America (%)
Place of birth for the foreign-born population - Other (%)
Latest news about races in Norman, OK collected exclusively by city-data.com from local newspapers, TV, and radio stations
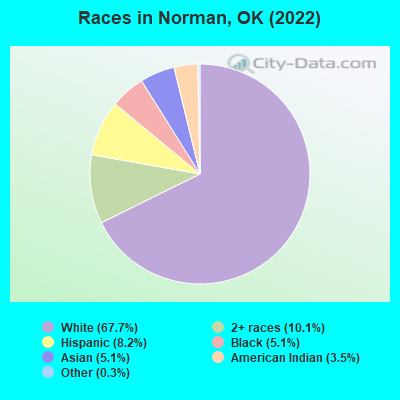
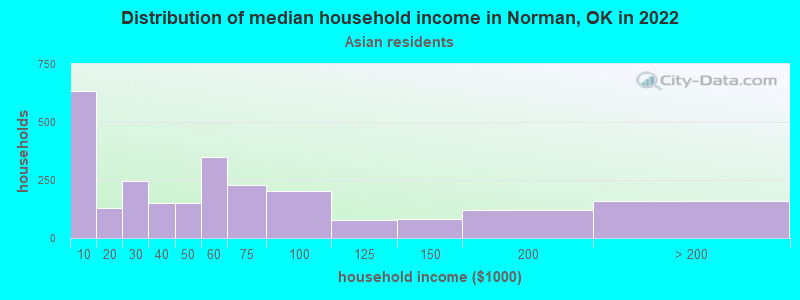
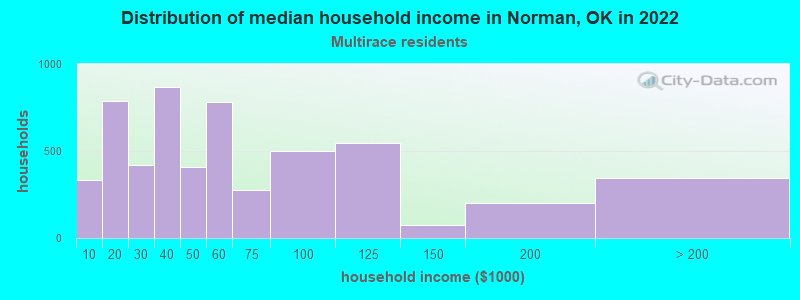
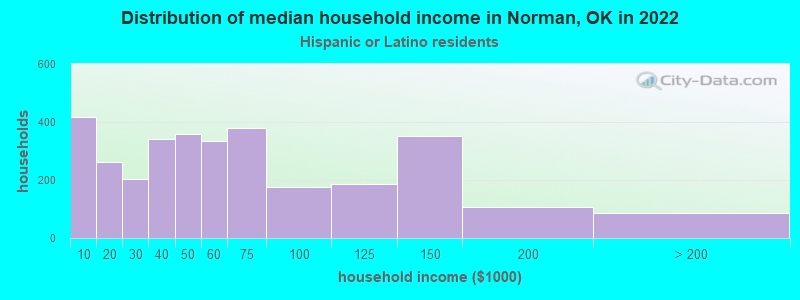
According to 2022 data, the most numerous races in Norman, OK are White alone (87,703 residents), Hispanic (10,679 residents), and Two or more races (13,138 residents). 88.6% of Norman residents speak English at home. 7.0% of Norman, OK residents are foreign-born (3.6% born in Asia, 2.1% born in Latin America), which is 13.8% greater than the foreign-born rate of 6.0% across the entire state of Oklahoma.
Race distribution in Norman
2000 2022
76,852 80.3% White alone 4,139 4.3% American Indian alone 4,022 4.2% Black alone 3,723 3.9% Hispanic 3,496 3.7% Two or more races 3,321 3.5% Asian alone 97 0.1% Other race alone 44 0.05% Native Hawaiian and Other
87,703 67.7% White alone 13,138 10.1% Two or more races 10,679 8.2% Hispanic 6,630 5.1% Black alone 6,589 5.1% Asian alone 4,489 3.5% American Indian alone 396 0.3% Other race alone
2000 2022
2,556,368 74.1% White alone 266,158 7.7% American Indian alone 257,981 7.5% Black alone 179,304 5.2% Hispanic 140,249 4.1% Two or more races 46,172 1.3% Asian alone 2,322 0.07% Other race alone 2,100 0.06% Native Hawaiian and Other
2,517,403 62.6% White alone 486,692 12.1% Hispanic 364,453 9.1% Two or more races 273,650 6.8% American Indian alone 268,543 6.7% Black alone 92,672 2.3% Asian alone 10,786 0.3% Other race alone 5,601 0.1% Native Hawaiian and Other
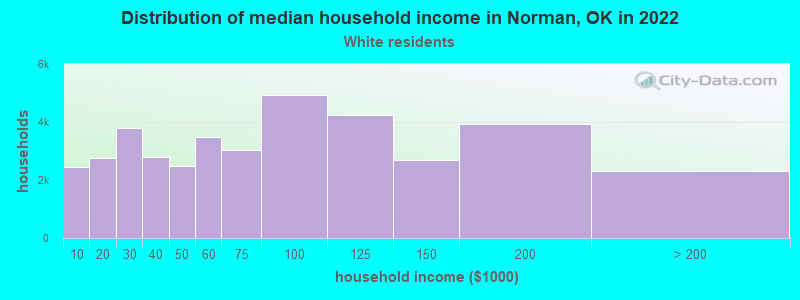
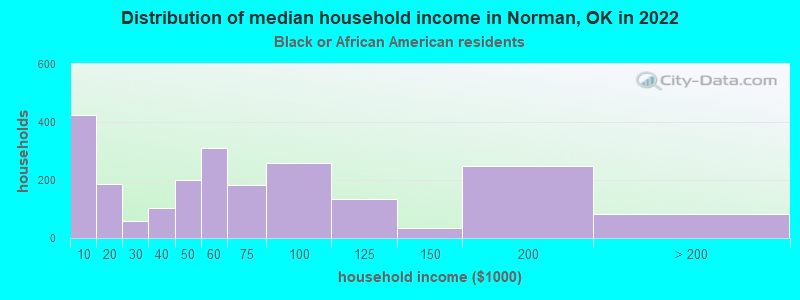
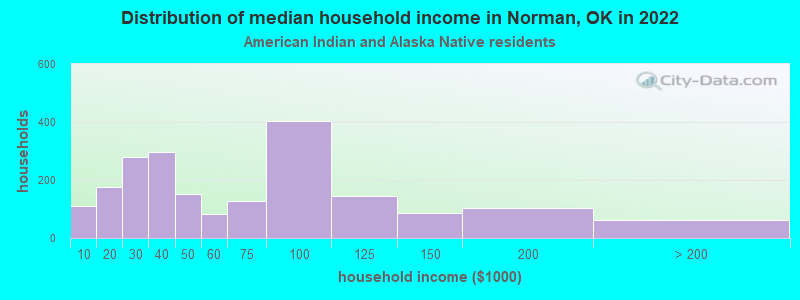
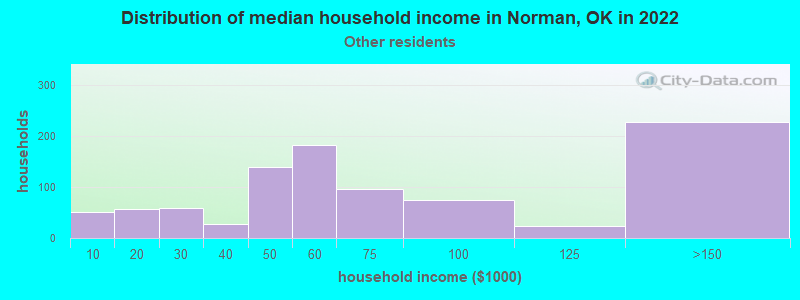
Income and house value in Norman Median household income in 2022 $68,258 White non-Hispanic householders$39,132 Black householders$37,217 American Indian and Alaska Native householders$67,811 Asian householders$38,184 Some other race householders$48,678 Two or more races householders$56,681 Hispanic or Latino race householdersMedian 2022 house value $251,228 White Non-Hispanic householders$230,336 Black or African American householders$202,654 American Indian or Alaska Native householders $282,828 Asian householders$359,084 Native Hawaiian and other Pacific Islander householders$164,526 Some other race householders$258,802 Two or more races householders$219,368 Hispanic or Latino householders
Median age by race in Norman
35.1 Median age for White residents35.0 35.1 23.0 Median age for Black or African American residents30.1 22.2 33.8 Median age for American Indian / Alaska Native residents36.6 24.7 30.0 Median age for Asian residents30.8 29.7 43.3 Median age for Native Hawaiian / Pacific Islander residents-666,666,666.0 -666,666,666.0 40.2 Median age for Other race residents40.0 40.3 23.1 Median age for Two or more races residents22.4 24.6 35.1 Median age for White alone residents35.1 35.1 27.2 Median age for Hispanic or Latino residents27.7 24.7
Owner/renter occupied households by race in Norman
House owners and renters - White residents 21,600 55.5% Owner occupied17,329 44.5% Renter occupiedHouse owners and renters - Black or African American residents 927 33.5% Owner occupied1,840 66.5% Renter occupiedHouse owners and renters - American Indian / Alaska Native residents 782 49.7% Owner occupied793 50.3% Renter occupiedHouse owners and renters - Asian residents 1,533 60.0% Owner occupied1,022 40.0% Renter occupiedHouse owners and renters - Native Hawaiian / Pacific Islander residents 116 75.4% Owner occupied38 24.6% Renter occupiedHouse owners and renters - Other race residents 249 22.3% Owner occupied870 77.7% Renter occupiedHouse owners and renters - Two or more races residents 1,741 31.4% Owner occupied3,807 68.6% Renter occupiedHouse owners and renters - White alone residents 21,176 56.0% Owner occupied16,638 44.0% Renter occupiedHouse owners and renters - Hispanic or Latino residents 972 28.0% Owner occupied2,500 72.0% Renter occupied
Language usage in Norman
English speakers - Total 88.6% of residents of Norman speak English at home.
4.5% of residents speak Spanish at home 4,594 81.8% Speak English very well1,023 18.2% Speak English less than very well6.9% of residents speak other language at home 6,678 77.9% Speak English very well1,897 22.1% Speak English less than very well
English speakers - Born in the United States 92.6% of residents of Norman speak English at home.
4.1% of residents speak Spanish at home 1,949 100.0% Speak English very well3.4% of residents speak other language at home 1,560 97.0% Speak English very well48 3.0% Speak English less than very well
English speakers - Native, born elsewhere 49.5% of residents of Norman speak English at home.
26.3% of residents speak Spanish at home 392 89.1% Speak English very well48 10.9% Speak English less than very well24.2% of residents speak other language at home 337 83.4% Speak English very well67 16.6% Speak English less than very well
English speakers - Foreign-born 22.7% of residents of Norman speak English at home.
17.6% of residents speak Spanish at home 778 51.6% Speak English very well731 48.4% Speak English less than very well59.7% of residents speak other language at home 3,513 68.6% Speak English very well1,607 31.4% Speak English less than very well
White (Caucasian) - Speak only English Native:
98.4% (83,857)Foreign-born:
44.6% (756)
White (Caucasian) - Speak another language Native:
1.6% (1,329)Foreign-born:
55.4% (940)
Black or African American - Speak only English Native:
94.5% (4,934)Foreign-born:
29.1% (198)
Black or African American - Speak another language Native:
5.3% (275)Foreign-born:
71.4% (486)
American Indian / Alaska Native - Speak another language Native:
6.5% (324)Foreign-born:
100.0% (25)
Asian - Speak only English Native:
12.0% (266)Foreign-born:
10.5% (442)
Asian - Speak another language Native:
88.0% (1,957)Foreign-born:
89.5% (3,781)
Native Hawaiian / Pacific Islander - Speak another language Native:
70.6% (145)Foreign-born:
100.0% (66)
Other race - Speak only English Native:
50.5% (991)Foreign-born:
17.3% (107)
Other race - Speak another language Native:
49.0% (961)Foreign-born:
80.8% (500)
Two or more races - Speak only English Native:
85.5% (13,108)Foreign-born:
39.4% (444)
Two or more races - Speak another language Native:
14.5% (2,223)Foreign-born:
60.6% (684)
White alone - Speak only English Native:
99.1% (82,257)Foreign-born:
49.2% (756)
White alone - Speak another language Native:
0.9% (752)Foreign-born:
50.8% (781)
Hispanic or Latino - Speak only English Native:
59.4% (4,855)Foreign-born:
23.3% (459)
Hispanic or Latino - Speak another language Native:
40.6% (3,320)Foreign-born:
76.7% (1,509)
Foreign-born residents in Norman 9,025 residents are foreign born (3.6% Asia , 2.1% Latin America ).
This city:
7.0%Oklahoma:
6.1%
Marital status for residents in Norman Marital status - White (Caucasian) population 15 years and over
Males 42.6% Never married47.7% Now married1.5% Separated2.5% Widowed5.6% DivorcedFemales 38.8% Never married40.7% Now married1.6% Separated6.4% Widowed12.5% DivorcedWomen who gave birth in the past 12 months Now married:
91.3% (711)Unmarried:
8.7% (68)
Women who did not give birth in the past 12 months Now married:
31.7% (7,837)Unmarried:
68.3% (16,903)
Marital status - Black or African American population 15 years and over
Males 65.6% Never married22.3% Now married1.0% Separated4.1% Widowed7.0% DivorcedFemales 56.8% Never married27.0% Now married1.0% Separated4.9% Widowed10.2% DivorcedWomen who gave birth in the past 12 months Now married:
38.5% (26)Unmarried:
61.5% (41)
Women who did not give birth in the past 12 months Now married:
25.1% (506)Unmarried:
74.9% (1,515)
Marital status - American Indian / Alaska Native population 15 years and over
Males 43.3% Never married30.5% Now married3.5% Separated0.0% Widowed22.7% DivorcedFemales 32.4% Never married55.1% Now married3.1% Separated6.1% Widowed3.2% DivorcedWomen who gave birth in the past 12 months Now married:
100.0% (102)Unmarried:
0.0% (0)
Women who did not give birth in the past 12 months Now married:
30.8% (342)Unmarried:
69.2% (768)
Marital status - Asian population 15 years and over
Males 62.4% Never married34.8% Now married0.0% Separated1.1% Widowed1.7% DivorcedFemales 50.8% Never married44.4% Now married1.0% Separated1.6% Widowed2.1% DivorcedWomen who gave birth in the past 12 months Now married:
100.0% (291)Unmarried:
0.0% (0)
Women who did not give birth in the past 12 months Now married:
51.8% (1,127)Unmarried:
48.2% (1,047)
Marital status - Native Hawaiian / Pacific Islander population 15 years and over
Males 36.3% Never married63.7% Now married0.0% Separated0.0% Widowed0.0% DivorcedFemales 41.2% Never married43.3% Now married15.5% Separated0.0% Widowed0.0% DivorcedWomen who did not give birth in the past 12 months Now married:
58.8% (67)Unmarried:
41.2% (47)
Marital status - Other race population 15 years and over
Males 42.4% Never married52.1% Now married1.5% Separated0.5% Widowed3.4% DivorcedFemales 59.5% Never married38.0% Now married0.0% Separated2.4% Widowed0.1% DivorcedWomen who gave birth in the past 12 months Now married:
73.9% (20)Unmarried:
26.1% (7)
Women who did not give birth in the past 12 months Now married:
32.5% (327)Unmarried:
67.5% (679)
Marital status - Two or more races population 15 years and over
Males 71.7% Never married26.3% Now married0.6% Separated0.0% Widowed1.4% DivorcedFemales 46.1% Never married45.4% Now married1.9% Separated0.9% Widowed5.6% DivorcedWomen who gave birth in the past 12 months Now married:
100.0% (124)Unmarried:
0.0% (0)
Women who did not give birth in the past 12 months Now married:
40.6% (2,242)Unmarried:
59.4% (3,286)
Marital status - White alone, not Hispanic / Latino population 15 years and over
Males 42.4% Never married48.1% Now married1.6% Separated2.6% Widowed5.3% DivorcedFemales 38.4% Never married41.3% Now married1.4% Separated6.5% Widowed12.4% DivorcedWomen who gave birth in the past 12 months Now married:
100.0% (711)Unmarried:
0.0% (0)
Women who did not give birth in the past 12 months Now married:
32.0% (7,761)Unmarried:
68.0% (16,518)
Marital status - Hispanic or Latino population 15 years and over
Males 41.4% Never married46.2% Now married0.0% Separated1.6% Widowed10.9% DivorcedFemales 50.3% Never married42.0% Now married2.8% Separated0.0% Widowed5.0% DivorcedWomen who gave birth in the past 12 months Now married:
62.2% (112)Unmarried:
37.8% (68)
Women who did not give birth in the past 12 months Now married:
37.6% (1,327)Unmarried:
62.4% (2,201)
Ancestries in Norman
8,831 14.9% English5,851 9.9% German4,625 7.8% American4,382 7.4% Irish2,696 4.5% European1,059 1.8% Scottish586 1.0% Iranian580 1.0% Italian493 0.8% French491 0.8% Scotch-Irish472 0.8% Polish450 0.8% British363 0.6% African271 0.5% Dutch246 0.4% Scandinavian242 0.4% Eastern European223 0.4% Swedish221 0.4% Norwegian205 0.3% Northern European171 0.3% Welsh151 0.3% Czech144 0.2% Finnish141 0.2% French Canadian116 0.2% Russian113 0.2% Kenyan105 0.2% Turkish98 0.2% Slovene89 0.2% Portuguese86 0.1% Lebanese83 0.1% Ghanaian82 0.1% Canadian71 0.1% Danish69 0.1% Haitian62 0.1% Iraqi58 0.10% Hungarian53 0.09% Belgian50 0.08% Celtic49 0.08% Moroccan48 0.08% Bahamian35 0.06% Afghan34 0.06% Greek34 0.06% Swiss33 0.06% Ugandan30 0.05% Ukrainian24 0.04% West Indian23 0.04% Macedonian22 0.04% Jamaican18 0.03% Czechoslovakian15 0.03% Belizean15 0.03% Dutch West Indian14 0.02% Romanian13 0.02% Alsatian12 0.02% Cajun11 0.02% Pennsylvania German10 0.02% Croatian9 0.02% Israeli8 0.01% Armenian7 0.01% Slovak7 0.01% Zimbabwean6 0.01% German Russian5 0.01% Lithuanian
Geographical mobility in Norman Same house 1 year ago 69,728 78.0% White (Caucasian)5,246 77.0% Black or African American4,058 86.0% American Indian / Alaska Native5,133 78.0% Asian276 100.0% Native Hawaiian / Pacific Islander2,162 79.0% Other race11,956 67.9% Two or more races68,071 78.2% White alone, not Hispanic / Latino7,567 71.3% Hispanic or LatinoMoved within same county 9,434 10.6% White / Caucasian378 5.5% Black or African American270 5.7% American Indian / Alaska Native956 14.5% Asian182 6.6% Other race3,251 18.5% Two or more races9,304 10.7% White alone, not Hispanic / Latino1,479 13.9% Hispanic or LatinoMoved within same state 6,381 7.1% White / Caucasian740 10.9% Black or African American375 7.9% American Indian / Alaska Native369 5.6% Asian193 7.0% Other race1,922 10.9% Two or more races5,895 6.8% White alone, not Hispanic / Latino871 8.2% Hispanic or LatinoMoved from different state 3,713 4.2% White / Caucasian329 4.8% Black or African American202 4.3% American Indian / Alaska Native63 1.0% Asian397 14.5% Other race475 2.7% Two or more races3,650 4.2% White alone, not Hispanic / Latino699 6.6% Hispanic or LatinoMoved from abroad 165 0.2% White118 1.7% Black or African American56 0.9% Asian165 0.2% White alone, not Hispanic / Latino
Children Nativity (place of birth) in Norman
Children under 6 years - Living with two parents Both parents native 3,533 99.8% Native7 0.2% Foreign-bornBoth parents foreign-born 545 96.5% Native20 3.5% Foreign-bornOne native, one foreign-born parent 329 100.0% NativeChildren under 6 years - Living with one parent Native parent 1,814 100.0% NativeForeign-born parent 116 100.0% NativeChildren 6 to 17 years - Living with two parents Both parents native 9,678 99.0% Native96 1.0% Foreign-bornBoth parents foreign-born 743 88.0% Native102 12.0% Foreign-bornOne native, one foreign-born parent 589 100.0% NativeChildren 6 to 17 years - Living with one parent Native parent 3,688 100.0% NativeForeign-born parent 227 63.8% Native129 36.2% Foreign-born
Grandparents responsible for own grandchildren in Norman
Grandparents (30 to 59 years) White / Caucasian 65 40.7% Responsible for grandchildren95 59.3% Not responsible for grandchildrenBlack or African American 2 100.0% Not responsible for grandchildrenAmerican Indian / Alaska Native 2 100.0% Responsible for grandchildrenOther race 53 100.0% Responsible for grandchildrenTwo or more races 17 22.0% Responsible for grandchildren61 78.0% Not responsible for grandchildrenWhite alone, not Hispanic / Latino 51 32.9% Responsible for grandchildren104 67.1% Not responsible for grandchildrenHispanic or Latino 76 100.0% Responsible for grandchildrenGrandparents (60 years and over) White / Caucasian 177 22.5% Responsible for grandchildren612 77.5% Not responsible for grandchildrenBlack or African American 14 100.0% Not responsible for grandchildrenAmerican Indian / Alaska Native 4 86.3% Responsible for grandchildren1 13.7% Not responsible for grandchildrenTwo or more races 66 100.0% Responsible for grandchildrenWhite alone, not Hispanic / Latino 177 22.7% Responsible for grandchildren604 77.3% Not responsible for grandchildrenHispanic or Latino 63 85.9% Responsible for grandchildren10 14.1% Not responsible for grandchildren