Races in Newington, Virginia (VA) Detailed Stats
Data:
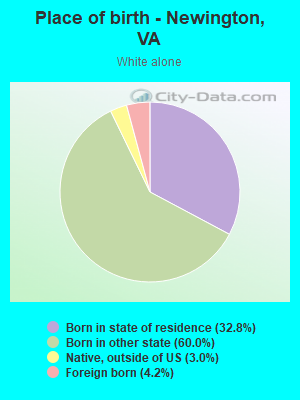
Races - White alone (%)
Races - White alone (% change since 2000)
Races - Black alone (%)
Races - Black alone (% change since 2000)
Races - American Indian alone (%)
Races - American Indian alone (% change since 2000)
Races - Asian alone (%)
Races - Asian alone (% change since 2000)
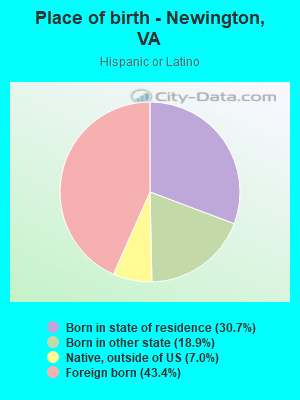
Races - Hispanic (%)
Races - Hispanic (% change since 2000)
Races - Native Hawaiian and Other Pacific Islander alone (%)
Races - Native Hawaiian and Other Pacific Islander alone (% change since 2000)
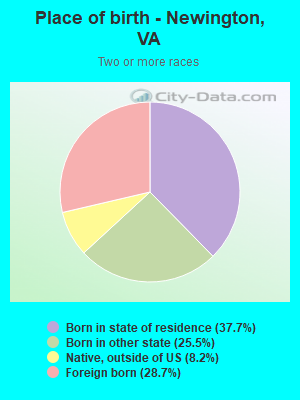
Races - Two or more races(%)
Races - Two or more races(% change since 2000)
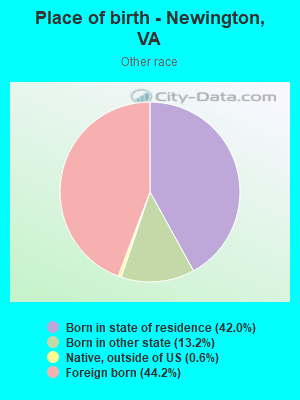
Races - Other race alone (%)
Races - Other race alone (% change since 2000)
Racial diversity
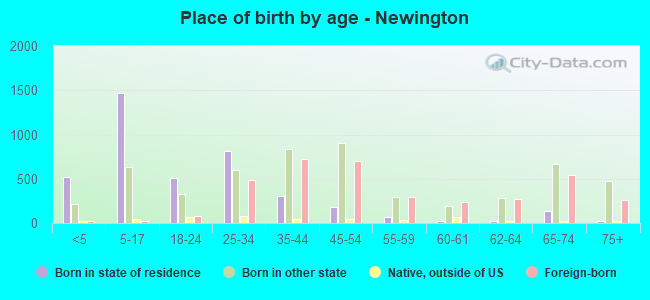
Place of birth - Born in state of residence (%)
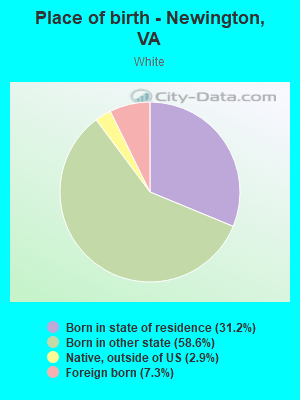
Place of birth - Born in state of residence (%) - White
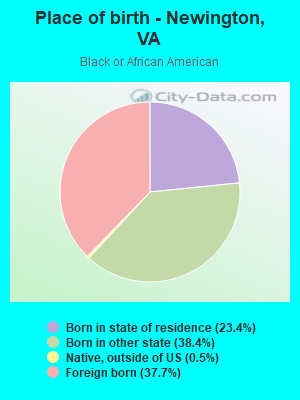
Place of birth - Born in state of residence (%) - Black or African American
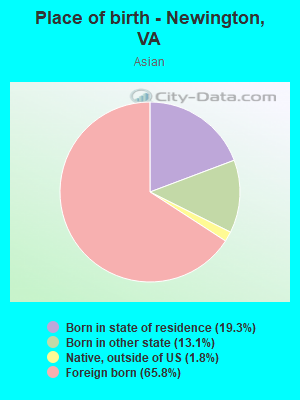
Place of birth - Born in state of residence (%) - Asian
Place of birth - Born in state of residence (%) - Hispanic or Latino
Place of birth - Born in state of residence (%) - American Indian and Alaska Native
Place of birth - Born in state of residence (%) - Multirace
Place of birth - Born in state of residence (%) - Other Race
Place of birth - Born in other state (%)
Place of birth - Born in other state (%) - White
Place of birth - Born in other state (%) - Black or African American
Place of birth - Born in other state (%) - Asian
Place of birth - Born in other state (%) - Hispanic or Latino
Place of birth - Born in other state (%) - American Indian and Alaska Native
Place of birth - Born in other state (%) - Multirace
Place of birth - Born in other state (%) - Other Race
Place of birth - Native, outside of US (%)
Place of birth - Native, outside of US (%) - White
Place of birth - Native, outside of US (%) - Black or African American
Place of birth - Native, outside of US (%) - Asian
Place of birth - Native, outside of US (%) - Hispanic or Latino
Place of birth - Native, outside of US (%) - American Indian and Alaska Native
Place of birth - Native, outside of US (%) - Multirace
Place of birth - Native, outside of US (%) - Other Race
Place of birth - Foreign born (%)
Place of birth - Foreign born (%) - White
Place of birth - Foreign born (%) - Black or African American
Place of birth - Foreign born (%) - Asian
Place of birth - Foreign born (%) - Hispanic or Latino
Place of birth - Foreign born (%) - American Indian and Alaska Native
Place of birth - Foreign born (%) - Multirace
Place of birth - Foreign born (%) - Other Race
Residents speaking English at home (%)
Residents speaking English at home - Born in the United States (%)
Residents speaking English at home - Native, born elsewhere (%)
Residents speaking English at home - Foreign born (%)
Residents speaking Spanish at home (%)
Residents speaking Spanish at home - Born in the United States (%)
Residents speaking Spanish at home - Native, born elsewhere (%)
Residents speaking Spanish at home - Foreign born (%)
Residents speaking other language at home (%)
Residents speaking other language at home - Born in the United States (%)
Residents speaking other language at home - Native, born elsewhere (%)
Residents speaking other language at home - Foreign born (%)
Marital status - Never married (%)
Marital status - Now married (%)
Marital status - Separated (%)
Marital status - Widowed (%)
Marital status - Divorced (%)
Ancestries Reported - Arab (%)
Ancestries Reported - Czech (%)
Ancestries Reported - Danish (%)
Ancestries Reported - Dutch (%)
Ancestries Reported - English (%)
Ancestries Reported - French (%)
Ancestries Reported - French Canadian (%)
Ancestries Reported - German (%)
Ancestries Reported - Greek (%)
Ancestries Reported - Hungarian (%)
Ancestries Reported - Irish (%)
Ancestries Reported - Italian (%)
Ancestries Reported - Lithuanian (%)
Ancestries Reported - Norwegian (%)
Ancestries Reported - Polish (%)
Ancestries Reported - Portuguese (%)
Ancestries Reported - Russian (%)
Ancestries Reported - Scotch-Irish (%)
Ancestries Reported - Scottish (%)
Ancestries Reported - Slovak (%)
Ancestries Reported - Subsaharan African (%)
Ancestries Reported - Swedish (%)
Ancestries Reported - Swiss (%)
Ancestries Reported - Ukrainian (%)
Ancestries Reported - United States (%)
Ancestries Reported - Welsh (%)
Ancestries Reported - West Indian (%)
Ancestries Reported - Other (%)
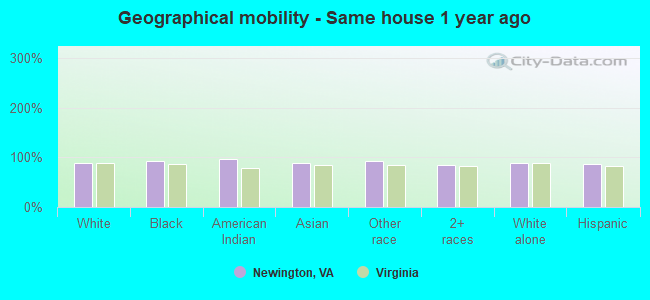
Geographical mobility - Same house 1 year ago (%)
Geographical mobility - Same house 1 year ago (%) - White
Geographical mobility - Same house 1 year ago (%) - Black or African American
Geographical mobility - Same house 1 year ago (%) - Asian
Geographical mobility - Same house 1 year ago (%) - Hispanic or Latino
Geographical mobility - Same house 1 year ago (%) - American Indian and Alaska Native
Geographical mobility - Same house 1 year ago (%) - Multirace
Geographical mobility - Same house 1 year ago (%) - Other Race
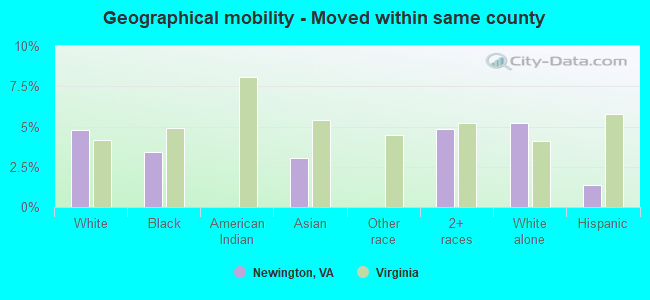
Geographical mobility - Moved within same county (%)
Geographical mobility - Moved within same county (%) - White
Geographical mobility - Moved within same county (%) - Black or African American
Geographical mobility - Moved within same county (%) - Asian
Geographical mobility - Moved within same county (%) - Hispanic or Latino
Geographical mobility - Moved within same county (%) - American Indian and Alaska Native
Geographical mobility - Moved within same county (%) - Multirace
Geographical mobility - Moved within same county (%) - Other Race
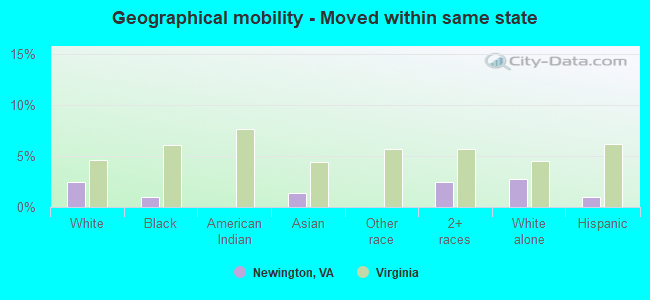
Geographical mobility - Moved from different county within same state (%)
Geographical mobility - Moved from different county within same state (%) - White
Geographical mobility - Moved from different county within same state (%) - Black or African American
Geographical mobility - Moved from different county within same state (%) - Asian
Geographical mobility - Moved from different county within same state (%) - Hispanic or Latino
Geographical mobility - Moved from different county within same state (%) - American Indian and Alaska Native
Geographical mobility - Moved from different county within same state (%) - Multirace
Geographical mobility - Moved from different county within same state (%) - Other Race
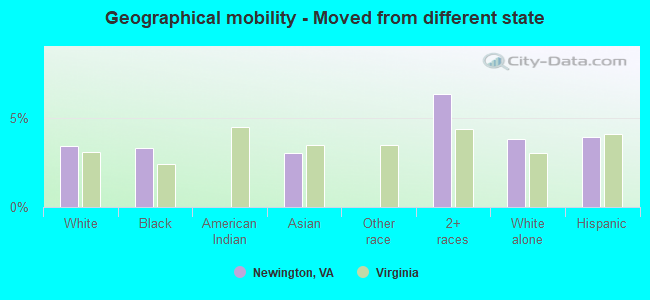
Geographical mobility - Moved from different state (%)
Geographical mobility - Moved from different state (%) - White
Geographical mobility - Moved from different state (%) - Black or African American
Geographical mobility - Moved from different state (%) - Asian
Geographical mobility - Moved from different state (%) - Hispanic or Latino
Geographical mobility - Moved from different state (%) - American Indian and Alaska Native
Geographical mobility - Moved from different state (%) - Multirace
Geographical mobility - Moved from different state (%) - Other Race
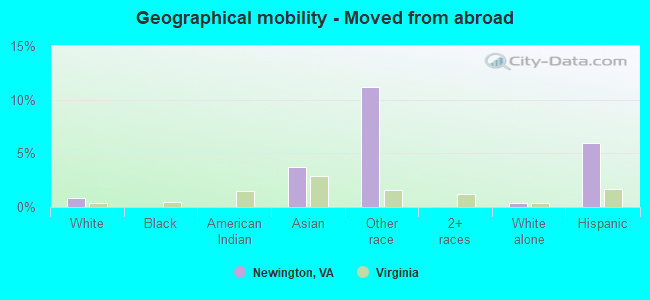
Geographical mobility - Moved from abroad (%)
Geographical mobility - Moved from abroad (%) - White
Geographical mobility - Moved from abroad (%) - Black or African American
Geographical mobility - Moved from abroad (%) - Asian
Geographical mobility - Moved from abroad (%) - Hispanic or Latino
Geographical mobility - Moved from abroad (%) - American Indian and Alaska Native
Geographical mobility - Moved from abroad (%) - Multirace
Geographical mobility - Moved from abroad (%) - Other Race
Place of birth for the foreign-born population - Ireland (%)
Place of birth for the foreign-born population - Denmark (%)
Place of birth for the foreign-born population - Norway (%)
Place of birth for the foreign-born population - Sweden (%)
Place of birth for the foreign-born population - United Kingdom (%)
Place of birth for the foreign-born population - England (%)
Place of birth for the foreign-born population - Scotland (%)
Place of birth for the foreign-born population - Other Northern Europe (%)
Place of birth for the foreign-born population - Austria (%)
Place of birth for the foreign-born population - Belgium (%)
Place of birth for the foreign-born population - France (%)
Place of birth for the foreign-born population - Germany (%)
Place of birth for the foreign-born population - Netherlands (%)
Place of birth for the foreign-born population - Switzerland (%)
Place of birth for the foreign-born population - Other Western Europe (%)
Place of birth for the foreign-born population - Greece (%)
Place of birth for the foreign-born population - Italy (%)
Place of birth for the foreign-born population - Portugal (%)
Place of birth for the foreign-born population - Spain (%)
Place of birth for the foreign-born population - Other Southern Europe (%)
Place of birth for the foreign-born population - Albania (%)
Place of birth for the foreign-born population - Belarus (%)
Place of birth for the foreign-born population - Bosnia and Herzegovina (%)
Place of birth for the foreign-born population - Bulgaria (%)
Place of birth for the foreign-born population - Croatia (%)
Place of birth for the foreign-born population - Czechoslovakia (%)
Place of birth for the foreign-born population - Hungary (%)
Place of birth for the foreign-born population - Latvia (%)
Place of birth for the foreign-born population - Lithuania (%)
Place of birth for the foreign-born population - North Macedonia (Macedonia) (%)
Place of birth for the foreign-born population - Moldova (%)
Place of birth for the foreign-born population - Poland (%)
Place of birth for the foreign-born population - Romania (%)
Place of birth for the foreign-born population - Russia (%)
Place of birth for the foreign-born population - Serbia (%)
Place of birth for the foreign-born population - Ukraine (%)
Place of birth for the foreign-born population - Other Eastern Europe (%)
Place of birth for the foreign-born population - China (%)
Place of birth for the foreign-born population - Hong Kong (%)
Place of birth for the foreign-born population - Taiwan (%)
Place of birth for the foreign-born population - Japan (%)
Place of birth for the foreign-born population - Korea (%)
Place of birth for the foreign-born population - Other Eastern Asia (%)
Place of birth for the foreign-born population - Afghanistan (%)
Place of birth for the foreign-born population - Bangladesh (%)
Place of birth for the foreign-born population - India (%)
Place of birth for the foreign-born population - Iran (%)
Place of birth for the foreign-born population - Kazakhstan (%)
Place of birth for the foreign-born population - Nepal (%)
Place of birth for the foreign-born population - Pakistan (%)
Place of birth for the foreign-born population - Sri Lanka (%)
Place of birth for the foreign-born population - Uzbekistan (%)
Place of birth for the foreign-born population - Other South Central Asia (%)
Place of birth for the foreign-born population - Burma (%)
Place of birth for the foreign-born population - Cambodia (%)
Place of birth for the foreign-born population - Indonesia (%)
Place of birth for the foreign-born population - Laos (%)
Place of birth for the foreign-born population - Malaysia (%)
Place of birth for the foreign-born population - Philippines (%)
Place of birth for the foreign-born population - Singapore (%)
Place of birth for the foreign-born population - Thailand (%)
Place of birth for the foreign-born population - Vietnam (%)
Place of birth for the foreign-born population - Other South Eastern Asia (%)
Place of birth for the foreign-born population - Armenia (%)
Place of birth for the foreign-born population - Iraq (%)
Place of birth for the foreign-born population - Israel (%)
Place of birth for the foreign-born population - Jordan (%)
Place of birth for the foreign-born population - Kuwait (%)
Place of birth for the foreign-born population - Lebanon (%)
Place of birth for the foreign-born population - Saudi Arabia (%)
Place of birth for the foreign-born population - Syria (%)
Place of birth for the foreign-born population - Turkey (%)
Place of birth for the foreign-born population - Yemen (%)
Place of birth for the foreign-born population - Other Western Asia (%)
Place of birth for the foreign-born population - Eritrea (%)
Place of birth for the foreign-born population - Ethiopia (%)
Place of birth for the foreign-born population - Kenya (%)
Place of birth for the foreign-born population - Somalia (%)
Place of birth for the foreign-born population - Uganda (%)
Place of birth for the foreign-born population - Zimbabwe (%)
Place of birth for the foreign-born population - Other Eastern Africa (%)
Place of birth for the foreign-born population - Cameroon (%)
Place of birth for the foreign-born population - Congo (%)
Place of birth for the foreign-born population - Democratic Republic of Congo (Zaire) (%)
Place of birth for the foreign-born population - Other Middle Africa (%)
Place of birth for the foreign-born population - Egypt (%)
Place of birth for the foreign-born population - Morocco (%)
Place of birth for the foreign-born population - Sudan (%)
Place of birth for the foreign-born population - Other Northern Africa (%)
Place of birth for the foreign-born population - South Africa (%)
Place of birth for the foreign-born population - Other Southern Africa (%)
Place of birth for the foreign-born population - Cabo Verde (%)
Place of birth for the foreign-born population - Ghana (%)
Place of birth for the foreign-born population - Liberia (%)
Place of birth for the foreign-born population - Nigeria (%)
Place of birth for the foreign-born population - Senegal (%)
Place of birth for the foreign-born population - Sierra Leone (%)
Place of birth for the foreign-born population - Other Western Africa (%)
Place of birth for the foreign-born population - Australia (%)
Place of birth for the foreign-born population - New Zealand (%)
Place of birth for the foreign-born population - Fiji (%)
Place of birth for the foreign-born population - Micronesia (%)
Place of birth for the foreign-born population - Bahamas (%)
Place of birth for the foreign-born population - Barbados (%)
Place of birth for the foreign-born population - Cuba (%)
Place of birth for the foreign-born population - Dominica (%)
Place of birth for the foreign-born population - Dominican Republic (%)
Place of birth for the foreign-born population - Grenada (%)
Place of birth for the foreign-born population - Haiti (%)
Place of birth for the foreign-born population - Jamaica (%)
Place of birth for the foreign-born population - St. Vincent and the Grenadines (%)
Place of birth for the foreign-born population - Trinidad and Tobago (%)
Place of birth for the foreign-born population - West Indies (%)
Place of birth for the foreign-born population - Other Caribbean (%)
Place of birth for the foreign-born population - Belize (%)
Place of birth for the foreign-born population - Costa Rica (%)
Place of birth for the foreign-born population - El Salvador (%)
Place of birth for the foreign-born population - Guatemala (%)
Place of birth for the foreign-born population - Honduras (%)
Place of birth for the foreign-born population - Mexico (%)
Place of birth for the foreign-born population - Nicaragua (%)
Place of birth for the foreign-born population - Panama (%)
Place of birth for the foreign-born population - Other Central America (%)
Place of birth for the foreign-born population - Argentina (%)
Place of birth for the foreign-born population - Bolivia (%)
Place of birth for the foreign-born population - Brazil (%)
Place of birth for the foreign-born population - Chile (%)
Place of birth for the foreign-born population - Colombia (%)
Place of birth for the foreign-born population - Ecuador (%)
Place of birth for the foreign-born population - Guyana (%)
Place of birth for the foreign-born population - Peru (%)
Place of birth for the foreign-born population - Uruguay (%)
Place of birth for the foreign-born population - Venezuela (%)
Place of birth for the foreign-born population - Other South America (%)
Place of birth for the foreign-born population - Canada (%)
Place of birth for the foreign-born population - Other Northern America (%)
Place of birth for the foreign-born population - Other (%)
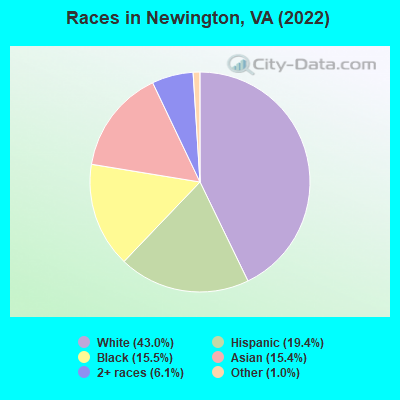
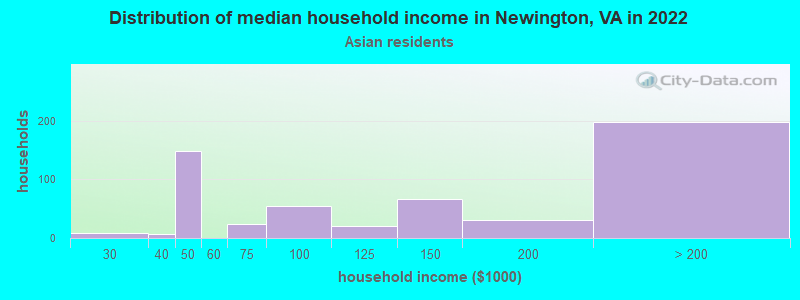
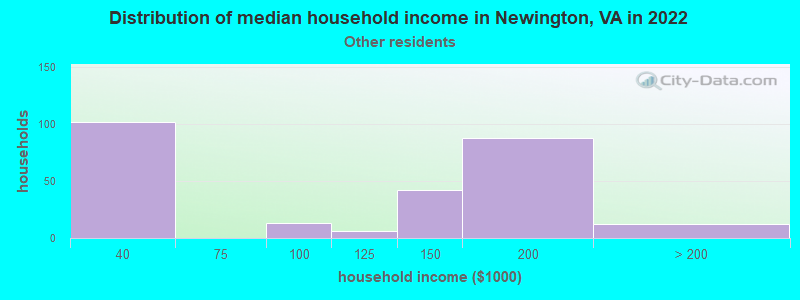
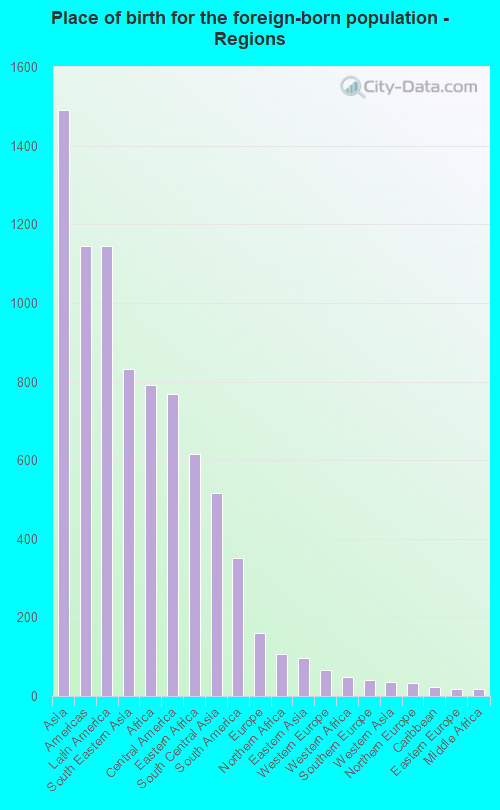
According to 2022 data, the most numerous races in Newington, VA are White alone (5,797 residents), Black alone (2,088 residents), and Hispanic (2,613 residents). 64.6% of Newington residents speak English at home. 26.6% of Newington, VA residents are foreign-born (11.0% born in Asia, 8.5% born in Latin America, 5.9% born in Africa), which is 55.0% greater than the foreign-born rate of 12.0% across the entire state of Virginia.
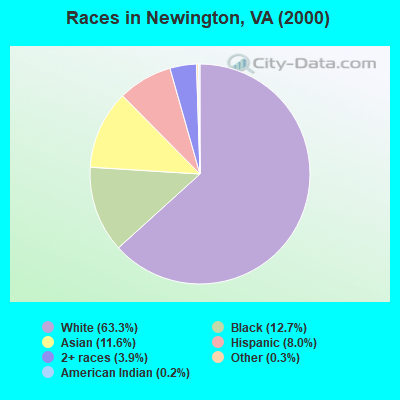
Race distribution in Newington
2000 2022
4,965,637 70.2% White alone 1,376,378 19.4% Black alone 329,540 4.7% Hispanic 259,277 3.7% Asian alone 114,022 1.6% Two or more races 18,596 0.3% American Indian alone 11,685 0.2% Other race alone 3,380 0.05% Native Hawaiian and Other
5,095,130 58.7% White alone 1,594,785 18.4% Black alone 905,750 10.4% Hispanic 602,881 6.9% Asian alone 406,047 4.7% Two or more races 60,419 0.7% Other race alone 11,738 0.1% American Indian alone 6,869 0.08% Native Hawaiian and Other
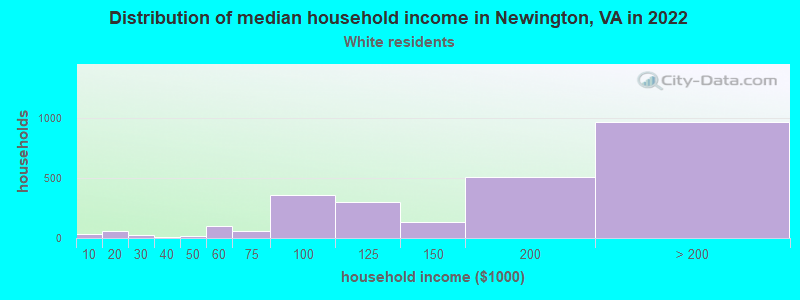
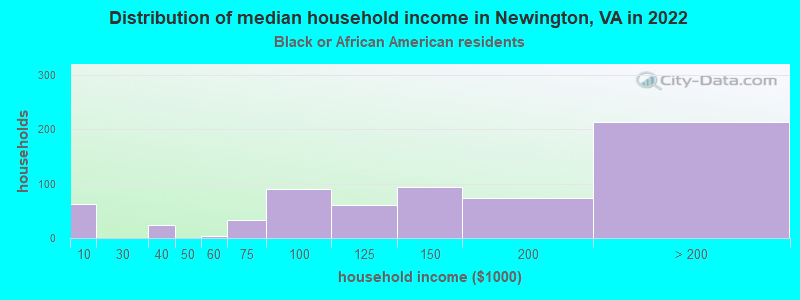
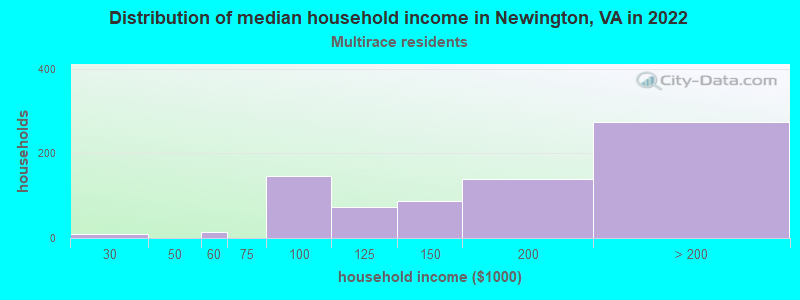
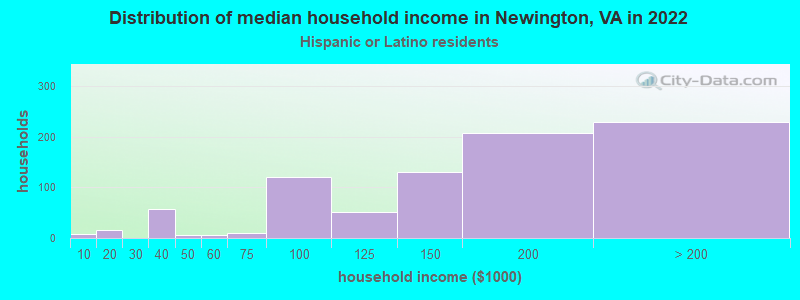
Income and house value in Newington Median household income in 2022 $164,364 White non-Hispanic householders$144,560 Black householders$129,115 Asian householders$131,222 Some other race householders$167,471 Two or more races householders$145,777 Hispanic or Latino race householdersMedian 2022 house value $582,615 White Non-Hispanic householders$442,966 Black or African American householders$611,103 American Indian or Alaska Native householders $516,142 Asian householders$354,987 Some other race householders$460,841 Two or more races householders$434,866 Hispanic or Latino householders
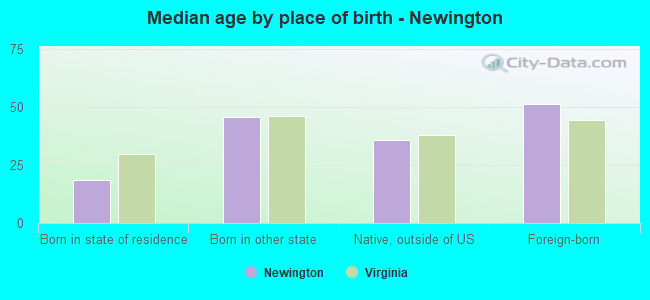
Median age by race in Newington
42.7 Median age for White residents39.1 47.7 43.5 Median age for Black or African American residents42.6 44.7 -754,182,753.4 Median age for American Indian / Alaska Native residents-964,539,006.1 -669,005,847.3 40.3 Median age for Asian residents40.7 38.9 -666,666,666.0 Median age for Native Hawaiian / Pacific Islander residents-558,791,801.0 -584,518,166.9 30.8 Median age for Other race residents31.0 15.4 25.9 Median age for Two or more races residents37.9 20.0 44.8 Median age for White alone residents39.4 48.3 34.1 Median age for Hispanic or Latino residents36.0 29.6
Owner/renter occupied households by race in Newington
House owners and renters - White residents 2,186 85.7% Owner occupied364 14.3% Renter occupiedHouse owners and renters - Black or African American residents 499 86.2% Owner occupied80 13.8% Renter occupiedHouse owners and renters - American Indian / Alaska Native residents 15 100.0% Owner occupiedHouse owners and renters - Asian residents 484 86.7% Owner occupied74 13.3% Renter occupiedHouse owners and renters - Other race residents 305 95.4% Owner occupied15 4.6% Renter occupiedHouse owners and renters - Two or more races residents 643 90.1% Owner occupied71 9.9% Renter occupiedHouse owners and renters - White alone residents 2,098 85.7% Owner occupied350 14.3% Renter occupiedHouse owners and renters - Hispanic or Latino residents 781 92.0% Owner occupied68 8.0% Renter occupied
Language usage in Newington
English speakers - Total 64.6% of residents of Newington speak English at home.
15.6% of residents speak Spanish at home 1,273 63.9% Speak English very well720 36.1% Speak English less than very well19.6% of residents speak other language at home 1,555 62.3% Speak English very well941 37.7% Speak English less than very well
English speakers - Born in the United States 92.4% of residents of Newington speak English at home.
5.2% of residents speak Spanish at home 218 80.7% Speak English very well52 19.3% Speak English less than very well2.5% of residents speak other language at home 132 100.0% Speak English very well
English speakers - Native, born elsewhere 71.7% of residents of Newington speak English at home.
23.8% of residents speak Spanish at home 64 62.7% Speak English very well38 37.3% Speak English less than very well2.3% of residents speak other language at home 10 100.0% Speak English less than very well
English speakers - Foreign-born 11.0% of residents of Newington speak English at home.
31.5% of residents speak Spanish at home 500 44.2% Speak English very well632 55.8% Speak English less than very well56.9% of residents speak other language at home 1,151 56.3% Speak English very well894 43.7% Speak English less than very well
White (Caucasian) - Speak only English Native:
94.9% (5,147)Foreign-born:
16.0% (72)
White (Caucasian) - Speak another language Native:
5.5% (296)Foreign-born:
80.6% (363)
Black or African American - Speak only English Native:
89.2% (1,127)Foreign-born:
16.0% (129)
Black or African American - Speak another language Native:
10.6% (135)Foreign-born:
82.1% (661)
Asian - Speak only English Native:
64.3% (435)Foreign-born:
11.7% (161)
Asian - Speak another language Native:
34.4% (233)Foreign-born:
88.1% (1,212)
Other race - Speak only English Native:
36.0% (190)Foreign-born:
2.1% (9)
Other race - Speak another language Native:
61.8% (327)Foreign-born:
96.5% (417)
Two or more races - Speak only English Native:
70.9% (966)Foreign-born:
5.5% (38)
Two or more races - Speak another language Native:
29.3% (399)Foreign-born:
94.5% (646)
White alone - Speak only English Native:
94.7% (5,072)Foreign-born:
27.0% (66)
White alone - Speak another language Native:
5.3% (282)Foreign-born:
72.8% (177)
Hispanic or Latino - Speak only English Native:
52.6% (669)Foreign-born:
1.1% (12)
Hispanic or Latino - Speak another language Native:
48.4% (615)Foreign-born:
98.9% (1,122)
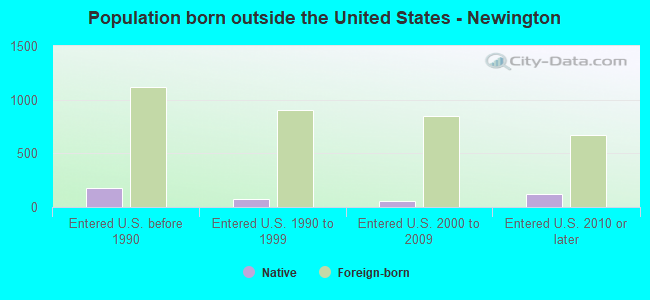
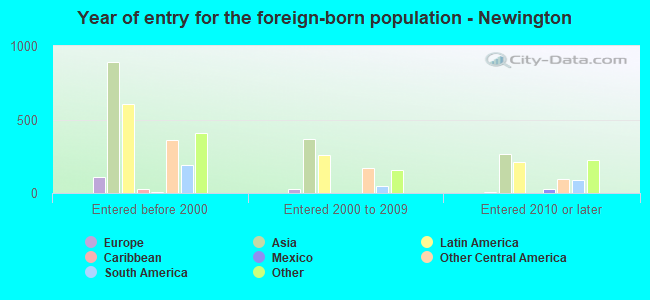
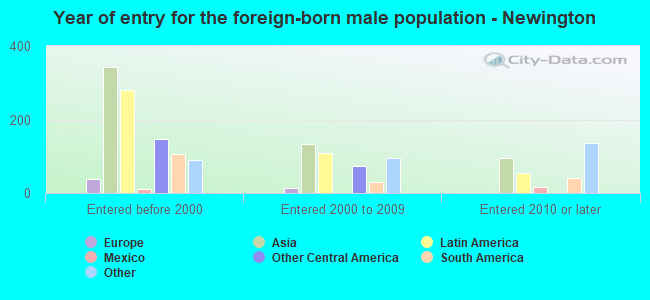
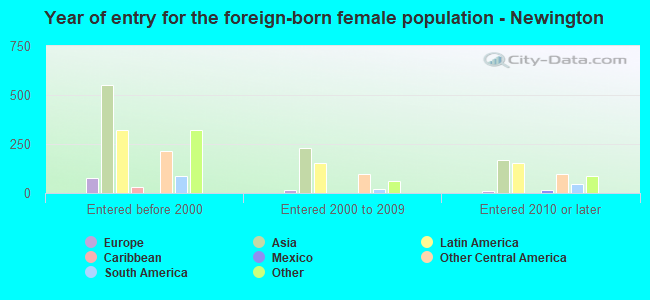
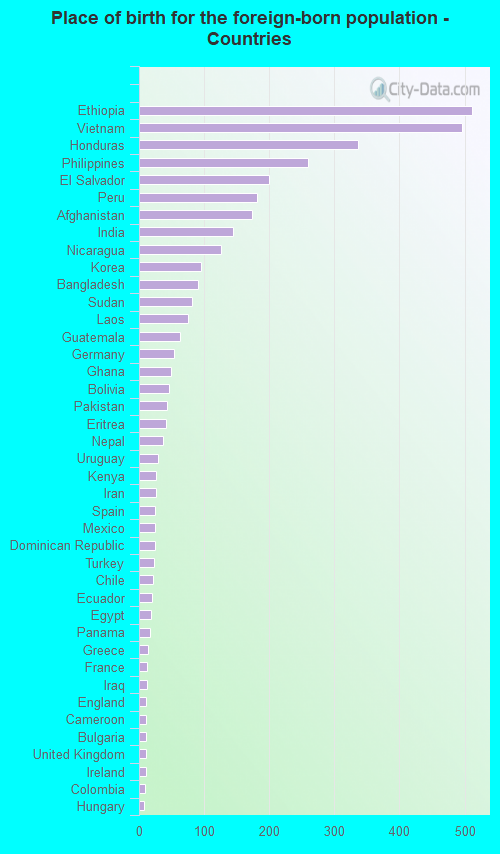
Foreign-born residents in Newington 3,590 residents are foreign born (11.0% Asia , 8.5% Latin America , 5.9% Africa ).
This city:
26.6%Virginia:
12.6%
Marital status for residents in Newington Marital status - White (Caucasian) population 15 years and over
Males 31.2% Never married60.0% Now married0.2% Separated2.9% Widowed5.6% DivorcedFemales 24.6% Never married63.4% Now married0.7% Separated2.0% Widowed9.4% DivorcedWomen who gave birth in the past 12 months Now married:
100.0% (92)Unmarried:
0.0% (0)
Women who did not give birth in the past 12 months Now married:
58.6% (660)Unmarried:
41.4% (466)
Marital status - Black or African American population 15 years and over
Males 37.1% Never married51.4% Now married1.5% Separated0.0% Widowed10.0% DivorcedFemales 24.7% Never married44.7% Now married1.2% Separated20.4% Widowed9.1% DivorcedWomen who gave birth in the past 12 months Now married:
94.4% (34)Unmarried:
5.6% (2)
Women who did not give birth in the past 12 months Now married:
48.1% (184)Unmarried:
51.9% (199)
Marital status - Asian population 15 years and over
Males 31.7% Never married57.1% Now married2.5% Separated3.0% Widowed5.7% DivorcedFemales 39.0% Never married49.5% Now married1.6% Separated5.7% Widowed4.2% DivorcedWomen who gave birth in the past 12 months Now married:
100.0% (52)Unmarried:
0.0% (0)
Women who did not give birth in the past 12 months Now married:
42.2% (261)Unmarried:
57.8% (358)
Marital status - Other race population 15 years and over
Males 0.0% Never married92.8% Now married0.0% Separated7.2% Widowed0.0% DivorcedFemales 4.2% Never married34.8% Now married25.0% Separated0.0% Widowed36.0% DivorcedWomen who did not give birth in the past 12 months Now married:
93.1% (182)Unmarried:
6.9% (14)
Marital status - Two or more races population 15 years and over
Males 33.2% Never married60.2% Now married0.0% Separated0.0% Widowed6.6% DivorcedFemales 47.4% Never married48.9% Now married1.3% Separated0.0% Widowed2.4% DivorcedWomen who gave birth in the past 12 months Now married:
100.0% (19)Unmarried:
0.0% (0)
Women who did not give birth in the past 12 months Now married:
44.3% (325)Unmarried:
55.7% (409)
Marital status - White alone, not Hispanic / Latino population 15 years and over
Males 33.3% Never married58.4% Now married0.2% Separated3.1% Widowed5.0% DivorcedFemales 22.4% Never married65.2% Now married0.8% Separated1.6% Widowed10.1% DivorcedWomen who gave birth in the past 12 months Now married:
100.0% (100)Unmarried:
0.0% (0)
Women who did not give birth in the past 12 months Now married:
60.5% (634)Unmarried:
39.5% (413)
Marital status - Hispanic or Latino population 15 years and over
Males 15.2% Never married75.8% Now married0.0% Separated2.0% Widowed7.1% DivorcedFemales 37.4% Never married44.2% Now married6.6% Separated1.4% Widowed10.5% DivorcedWomen who gave birth in the past 12 months Now married:
100.0% (7)Unmarried:
0.0% (0)
Women who did not give birth in the past 12 months Now married:
52.1% (424)Unmarried:
47.9% (389)
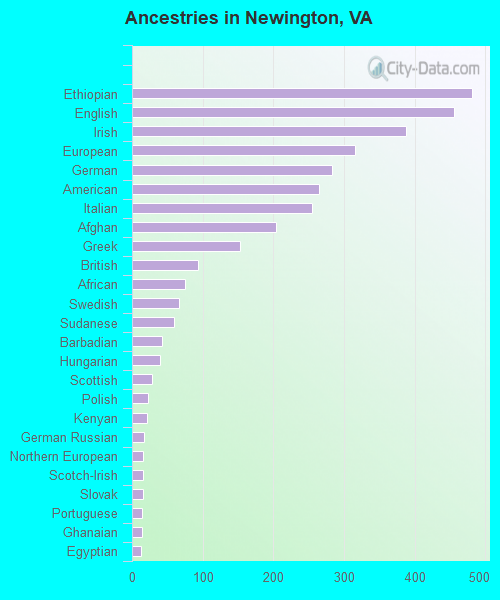
Ancestries in Newington
481 6.7% Ethiopian455 6.4% English388 5.4% Irish315 4.4% European283 4.0% German264 3.7% American254 3.6% Italian204 2.9% Afghan153 2.1% Greek94 1.3% British75 1.1% African66 0.9% Swedish59 0.8% Sudanese42 0.6% Barbadian40 0.6% Hungarian29 0.4% Scottish23 0.3% Polish21 0.3% Kenyan17 0.2% German Russian16 0.2% Northern European15 0.2% Scotch-Irish15 0.2% Slovak14 0.2% Portuguese14 0.2% Ghanaian13 0.2% Egyptian12 0.2% Belgian12 0.2% Turkish10 0.1% French9 0.1% Czechoslovakian9 0.1% Norwegian9 0.1% Scandinavian8 0.1% French Canadian8 0.1% Lithuanian7 0.10% Canadian6 0.08% Ukrainian6 0.08% Welsh4 0.06% Dutch3 0.04% Bulgarian
Geographical mobility in Newington Same house 1 year ago 5,382 88.5% White (Caucasian)1,963 93.0% Black or African American29 96.1% American Indian / Alaska Native1,850 88.9% Asian904 91.9% Other race1,924 84.1% Two or more races5,064 87.9% White alone, not Hispanic / Latino2,273 87.1% Hispanic or LatinoMoved within same county 290 4.8% White / Caucasian72 3.4% Black or African American63 3.0% Asian110 4.8% Two or more races302 5.2% White alone, not Hispanic / Latino36 1.4% Hispanic or LatinoMoved within same state 150 2.5% White / Caucasian20 1.0% Black or African American28 1.4% Asian56 2.5% Two or more races156 2.7% White alone, not Hispanic / Latino24 0.9% Hispanic or LatinoMoved from different state 206 3.4% White / Caucasian69 3.3% Black or African American63 3.0% Asian145 6.3% Two or more races219 3.8% White alone, not Hispanic / Latino102 3.9% Hispanic or LatinoMoved from abroad 49 0.8% White77 3.7% Asian110 11.2% Other race20 0.3% White alone, not Hispanic / Latino157 6.0% Hispanic or Latino
Children Nativity (place of birth) in Newington
Children under 6 years - Living with two parents Both parents native 272 100.0% NativeBoth parents foreign-born 236 96.5% Native9 3.5% Foreign-bornOne native, one foreign-born parent 322 100.0% NativeChildren under 6 years - Living with one parent Native parent 63 100.0% NativeForeign-born parent 7 100.0% NativeChildren 6 to 17 years - Living with two parents Both parents native 969 100.0% NativeBoth parents foreign-born 180 92.5% Native15 7.5% Foreign-bornOne native, one foreign-born parent 350 100.0% NativeChildren 6 to 17 years - Living with one parent Native parent 73 100.0% NativeForeign-born parent 387 51.3% Native368 48.7% Foreign-born
Grandparents responsible for own grandchildren in Newington
Grandparents (30 to 59 years) White / Caucasian 6 33.0% Responsible for grandchildren13 67.0% Not responsible for grandchildrenAsian 12 100.0% Not responsible for grandchildrenWhite alone, not Hispanic / Latino 12 100.0% Responsible for grandchildrenHispanic or Latino 20 100.0% Not responsible for grandchildren
Grandparents (60 years and over) White / Caucasian 32 100.0% Not responsible for grandchildrenAsian 72 100.0% Not responsible for grandchildrenWhite alone, not Hispanic / Latino 14 100.0% Not responsible for grandchildrenHispanic or Latino 249 100.0% Not responsible for grandchildren