Races in New Smyrna Beach, Florida (FL) Detailed Stats
Data:
Races - White alone (%)
Races - White alone (% change since 2000)
Races - Black alone (%)
Races - Black alone (% change since 2000)
Races - American Indian alone (%)
Races - American Indian alone (% change since 2000)
Races - Asian alone (%)
Races - Asian alone (% change since 2000)
Races - Hispanic (%)
Races - Hispanic (% change since 2000)
Races - Native Hawaiian and Other Pacific Islander alone (%)
Races - Native Hawaiian and Other Pacific Islander alone (% change since 2000)
Races - Two or more races(%)
Races - Two or more races(% change since 2000)
Races - Other race alone (%)
Races - Other race alone (% change since 2000)
Racial diversity
Place of birth - Born in state of residence (%)
Place of birth - Born in state of residence (%) - White
Place of birth - Born in state of residence (%) - Black or African American
Place of birth - Born in state of residence (%) - Asian
Place of birth - Born in state of residence (%) - Hispanic or Latino
Place of birth - Born in state of residence (%) - American Indian and Alaska Native
Place of birth - Born in state of residence (%) - Multirace
Place of birth - Born in state of residence (%) - Other Race
Place of birth - Born in other state (%)
Place of birth - Born in other state (%) - White
Place of birth - Born in other state (%) - Black or African American
Place of birth - Born in other state (%) - Asian
Place of birth - Born in other state (%) - Hispanic or Latino
Place of birth - Born in other state (%) - American Indian and Alaska Native
Place of birth - Born in other state (%) - Multirace
Place of birth - Born in other state (%) - Other Race
Place of birth - Native, outside of US (%)
Place of birth - Native, outside of US (%) - White
Place of birth - Native, outside of US (%) - Black or African American
Place of birth - Native, outside of US (%) - Asian
Place of birth - Native, outside of US (%) - Hispanic or Latino
Place of birth - Native, outside of US (%) - American Indian and Alaska Native
Place of birth - Native, outside of US (%) - Multirace
Place of birth - Native, outside of US (%) - Other Race
Place of birth - Foreign born (%)
Place of birth - Foreign born (%) - White
Place of birth - Foreign born (%) - Black or African American
Place of birth - Foreign born (%) - Asian
Place of birth - Foreign born (%) - Hispanic or Latino
Place of birth - Foreign born (%) - American Indian and Alaska Native
Place of birth - Foreign born (%) - Multirace
Place of birth - Foreign born (%) - Other Race
Residents speaking English at home (%)
Residents speaking English at home - Born in the United States (%)
Residents speaking English at home - Native, born elsewhere (%)
Residents speaking English at home - Foreign born (%)
Residents speaking Spanish at home (%)
Residents speaking Spanish at home - Born in the United States (%)
Residents speaking Spanish at home - Native, born elsewhere (%)
Residents speaking Spanish at home - Foreign born (%)
Residents speaking other language at home (%)
Residents speaking other language at home - Born in the United States (%)
Residents speaking other language at home - Native, born elsewhere (%)
Residents speaking other language at home - Foreign born (%)
Marital status - Never married (%)
Marital status - Now married (%)
Marital status - Separated (%)
Marital status - Widowed (%)
Marital status - Divorced (%)
Ancestries Reported - Arab (%)
Ancestries Reported - Czech (%)
Ancestries Reported - Danish (%)
Ancestries Reported - Dutch (%)
Ancestries Reported - English (%)
Ancestries Reported - French (%)
Ancestries Reported - French Canadian (%)
Ancestries Reported - German (%)
Ancestries Reported - Greek (%)
Ancestries Reported - Hungarian (%)
Ancestries Reported - Irish (%)
Ancestries Reported - Italian (%)
Ancestries Reported - Lithuanian (%)
Ancestries Reported - Norwegian (%)
Ancestries Reported - Polish (%)
Ancestries Reported - Portuguese (%)
Ancestries Reported - Russian (%)
Ancestries Reported - Scotch-Irish (%)
Ancestries Reported - Scottish (%)
Ancestries Reported - Slovak (%)
Ancestries Reported - Subsaharan African (%)
Ancestries Reported - Swedish (%)
Ancestries Reported - Swiss (%)
Ancestries Reported - Ukrainian (%)
Ancestries Reported - United States (%)
Ancestries Reported - Welsh (%)
Ancestries Reported - West Indian (%)
Ancestries Reported - Other (%)
Geographical mobility - Same house 1 year ago (%)
Geographical mobility - Same house 1 year ago (%) - White
Geographical mobility - Same house 1 year ago (%) - Black or African American
Geographical mobility - Same house 1 year ago (%) - Asian
Geographical mobility - Same house 1 year ago (%) - Hispanic or Latino
Geographical mobility - Same house 1 year ago (%) - American Indian and Alaska Native
Geographical mobility - Same house 1 year ago (%) - Multirace
Geographical mobility - Same house 1 year ago (%) - Other Race
Geographical mobility - Moved within same county (%)
Geographical mobility - Moved within same county (%) - White
Geographical mobility - Moved within same county (%) - Black or African American
Geographical mobility - Moved within same county (%) - Asian
Geographical mobility - Moved within same county (%) - Hispanic or Latino
Geographical mobility - Moved within same county (%) - American Indian and Alaska Native
Geographical mobility - Moved within same county (%) - Multirace
Geographical mobility - Moved within same county (%) - Other Race
Geographical mobility - Moved from different county within same state (%)
Geographical mobility - Moved from different county within same state (%) - White
Geographical mobility - Moved from different county within same state (%) - Black or African American
Geographical mobility - Moved from different county within same state (%) - Asian
Geographical mobility - Moved from different county within same state (%) - Hispanic or Latino
Geographical mobility - Moved from different county within same state (%) - American Indian and Alaska Native
Geographical mobility - Moved from different county within same state (%) - Multirace
Geographical mobility - Moved from different county within same state (%) - Other Race
Geographical mobility - Moved from different state (%)
Geographical mobility - Moved from different state (%) - White
Geographical mobility - Moved from different state (%) - Black or African American
Geographical mobility - Moved from different state (%) - Asian
Geographical mobility - Moved from different state (%) - Hispanic or Latino
Geographical mobility - Moved from different state (%) - American Indian and Alaska Native
Geographical mobility - Moved from different state (%) - Multirace
Geographical mobility - Moved from different state (%) - Other Race
Geographical mobility - Moved from abroad (%)
Geographical mobility - Moved from abroad (%) - White
Geographical mobility - Moved from abroad (%) - Black or African American
Geographical mobility - Moved from abroad (%) - Asian
Geographical mobility - Moved from abroad (%) - Hispanic or Latino
Geographical mobility - Moved from abroad (%) - American Indian and Alaska Native
Geographical mobility - Moved from abroad (%) - Multirace
Geographical mobility - Moved from abroad (%) - Other Race
Place of birth for the foreign-born population - Ireland (%)
Place of birth for the foreign-born population - Denmark (%)
Place of birth for the foreign-born population - Norway (%)
Place of birth for the foreign-born population - Sweden (%)
Place of birth for the foreign-born population - United Kingdom (%)
Place of birth for the foreign-born population - England (%)
Place of birth for the foreign-born population - Scotland (%)
Place of birth for the foreign-born population - Other Northern Europe (%)
Place of birth for the foreign-born population - Austria (%)
Place of birth for the foreign-born population - Belgium (%)
Place of birth for the foreign-born population - France (%)
Place of birth for the foreign-born population - Germany (%)
Place of birth for the foreign-born population - Netherlands (%)
Place of birth for the foreign-born population - Switzerland (%)
Place of birth for the foreign-born population - Other Western Europe (%)
Place of birth for the foreign-born population - Greece (%)
Place of birth for the foreign-born population - Italy (%)
Place of birth for the foreign-born population - Portugal (%)
Place of birth for the foreign-born population - Spain (%)
Place of birth for the foreign-born population - Other Southern Europe (%)
Place of birth for the foreign-born population - Albania (%)
Place of birth for the foreign-born population - Belarus (%)
Place of birth for the foreign-born population - Bosnia and Herzegovina (%)
Place of birth for the foreign-born population - Bulgaria (%)
Place of birth for the foreign-born population - Croatia (%)
Place of birth for the foreign-born population - Czechoslovakia (%)
Place of birth for the foreign-born population - Hungary (%)
Place of birth for the foreign-born population - Latvia (%)
Place of birth for the foreign-born population - Lithuania (%)
Place of birth for the foreign-born population - North Macedonia (Macedonia) (%)
Place of birth for the foreign-born population - Moldova (%)
Place of birth for the foreign-born population - Poland (%)
Place of birth for the foreign-born population - Romania (%)
Place of birth for the foreign-born population - Russia (%)
Place of birth for the foreign-born population - Serbia (%)
Place of birth for the foreign-born population - Ukraine (%)
Place of birth for the foreign-born population - Other Eastern Europe (%)
Place of birth for the foreign-born population - China (%)
Place of birth for the foreign-born population - Hong Kong (%)
Place of birth for the foreign-born population - Taiwan (%)
Place of birth for the foreign-born population - Japan (%)
Place of birth for the foreign-born population - Korea (%)
Place of birth for the foreign-born population - Other Eastern Asia (%)
Place of birth for the foreign-born population - Afghanistan (%)
Place of birth for the foreign-born population - Bangladesh (%)
Place of birth for the foreign-born population - India (%)
Place of birth for the foreign-born population - Iran (%)
Place of birth for the foreign-born population - Kazakhstan (%)
Place of birth for the foreign-born population - Nepal (%)
Place of birth for the foreign-born population - Pakistan (%)
Place of birth for the foreign-born population - Sri Lanka (%)
Place of birth for the foreign-born population - Uzbekistan (%)
Place of birth for the foreign-born population - Other South Central Asia (%)
Place of birth for the foreign-born population - Burma (%)
Place of birth for the foreign-born population - Cambodia (%)
Place of birth for the foreign-born population - Indonesia (%)
Place of birth for the foreign-born population - Laos (%)
Place of birth for the foreign-born population - Malaysia (%)
Place of birth for the foreign-born population - Philippines (%)
Place of birth for the foreign-born population - Singapore (%)
Place of birth for the foreign-born population - Thailand (%)
Place of birth for the foreign-born population - Vietnam (%)
Place of birth for the foreign-born population - Other South Eastern Asia (%)
Place of birth for the foreign-born population - Armenia (%)
Place of birth for the foreign-born population - Iraq (%)
Place of birth for the foreign-born population - Israel (%)
Place of birth for the foreign-born population - Jordan (%)
Place of birth for the foreign-born population - Kuwait (%)
Place of birth for the foreign-born population - Lebanon (%)
Place of birth for the foreign-born population - Saudi Arabia (%)
Place of birth for the foreign-born population - Syria (%)
Place of birth for the foreign-born population - Turkey (%)
Place of birth for the foreign-born population - Yemen (%)
Place of birth for the foreign-born population - Other Western Asia (%)
Place of birth for the foreign-born population - Eritrea (%)
Place of birth for the foreign-born population - Ethiopia (%)
Place of birth for the foreign-born population - Kenya (%)
Place of birth for the foreign-born population - Somalia (%)
Place of birth for the foreign-born population - Uganda (%)
Place of birth for the foreign-born population - Zimbabwe (%)
Place of birth for the foreign-born population - Other Eastern Africa (%)
Place of birth for the foreign-born population - Cameroon (%)
Place of birth for the foreign-born population - Congo (%)
Place of birth for the foreign-born population - Democratic Republic of Congo (Zaire) (%)
Place of birth for the foreign-born population - Other Middle Africa (%)
Place of birth for the foreign-born population - Egypt (%)
Place of birth for the foreign-born population - Morocco (%)
Place of birth for the foreign-born population - Sudan (%)
Place of birth for the foreign-born population - Other Northern Africa (%)
Place of birth for the foreign-born population - South Africa (%)
Place of birth for the foreign-born population - Other Southern Africa (%)
Place of birth for the foreign-born population - Cabo Verde (%)
Place of birth for the foreign-born population - Ghana (%)
Place of birth for the foreign-born population - Liberia (%)
Place of birth for the foreign-born population - Nigeria (%)
Place of birth for the foreign-born population - Senegal (%)
Place of birth for the foreign-born population - Sierra Leone (%)
Place of birth for the foreign-born population - Other Western Africa (%)
Place of birth for the foreign-born population - Australia (%)
Place of birth for the foreign-born population - New Zealand (%)
Place of birth for the foreign-born population - Fiji (%)
Place of birth for the foreign-born population - Micronesia (%)
Place of birth for the foreign-born population - Bahamas (%)
Place of birth for the foreign-born population - Barbados (%)
Place of birth for the foreign-born population - Cuba (%)
Place of birth for the foreign-born population - Dominica (%)
Place of birth for the foreign-born population - Dominican Republic (%)
Place of birth for the foreign-born population - Grenada (%)
Place of birth for the foreign-born population - Haiti (%)
Place of birth for the foreign-born population - Jamaica (%)
Place of birth for the foreign-born population - St. Vincent and the Grenadines (%)
Place of birth for the foreign-born population - Trinidad and Tobago (%)
Place of birth for the foreign-born population - West Indies (%)
Place of birth for the foreign-born population - Other Caribbean (%)
Place of birth for the foreign-born population - Belize (%)
Place of birth for the foreign-born population - Costa Rica (%)
Place of birth for the foreign-born population - El Salvador (%)
Place of birth for the foreign-born population - Guatemala (%)
Place of birth for the foreign-born population - Honduras (%)
Place of birth for the foreign-born population - Mexico (%)
Place of birth for the foreign-born population - Nicaragua (%)
Place of birth for the foreign-born population - Panama (%)
Place of birth for the foreign-born population - Other Central America (%)
Place of birth for the foreign-born population - Argentina (%)
Place of birth for the foreign-born population - Bolivia (%)
Place of birth for the foreign-born population - Brazil (%)
Place of birth for the foreign-born population - Chile (%)
Place of birth for the foreign-born population - Colombia (%)
Place of birth for the foreign-born population - Ecuador (%)
Place of birth for the foreign-born population - Guyana (%)
Place of birth for the foreign-born population - Peru (%)
Place of birth for the foreign-born population - Uruguay (%)
Place of birth for the foreign-born population - Venezuela (%)
Place of birth for the foreign-born population - Other South America (%)
Place of birth for the foreign-born population - Canada (%)
Place of birth for the foreign-born population - Other Northern America (%)
Place of birth for the foreign-born population - Other (%)
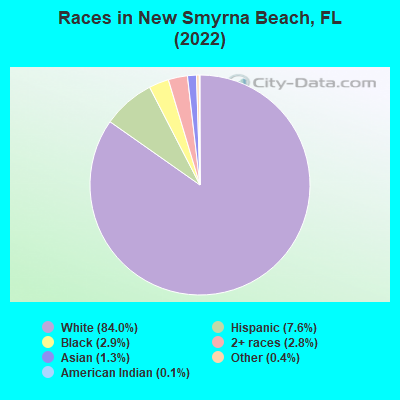
According to 2022 data, the most numerous races in New Smyrna Beach, FL are White alone (26,535 residents), Hispanic (2,396 residents), and Black alone (913 residents). 93.4% of New Smyrna Beach residents speak English at home. 6.6% of New Smyrna Beach, FL residents are foreign-born (3.0% born in Latin America, 2.0% born in Europe, 1.3% born in Asia), which is 216.5% less than the foreign-born rate of 21.0% across the entire state of Florida.
Race distribution in New Smyrna Beach
2000 2022
10,458,509 65.4% White alone 2,682,715 16.8% Hispanic 2,264,268 14.2% Black alone 261,693 1.6% Asian alone 236,954 1.5% Two or more races 42,358 0.3% American Indian alone 28,994 0.2% Other race alone 6,887 0.04% Native Hawaiian and Other
11,309,403 50.8% White alone 6,025,039 27.1% Hispanic 3,241,015 14.6% Black alone 861,630 3.9% Two or more races 623,692 2.8% Asian alone 152,054 0.7% Other race alone 22,504 0.1% American Indian alone 9,486 0.04% Native Hawaiian and Other
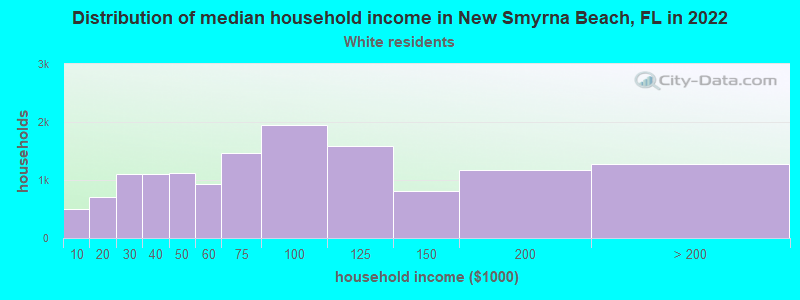
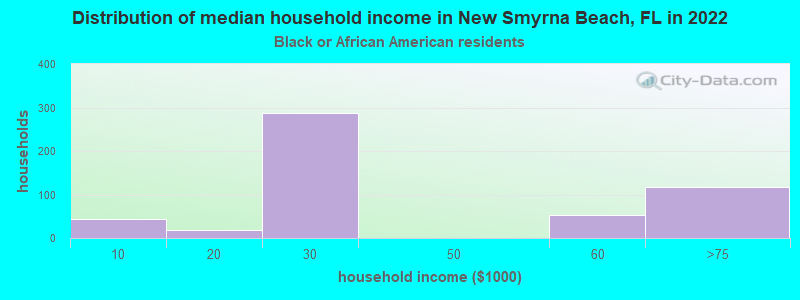
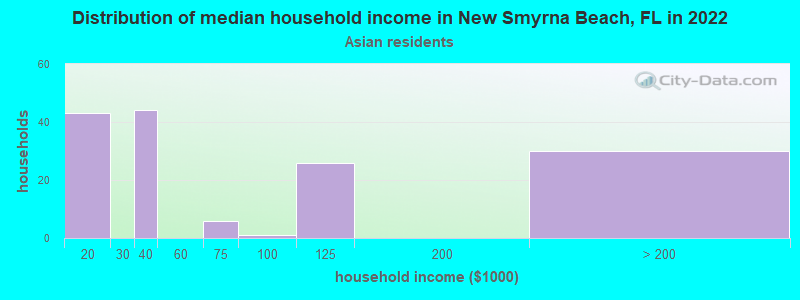
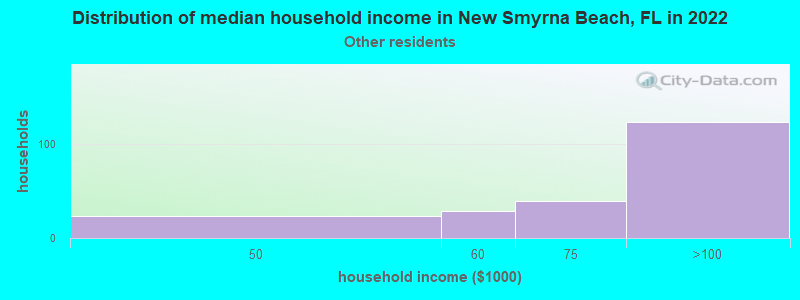
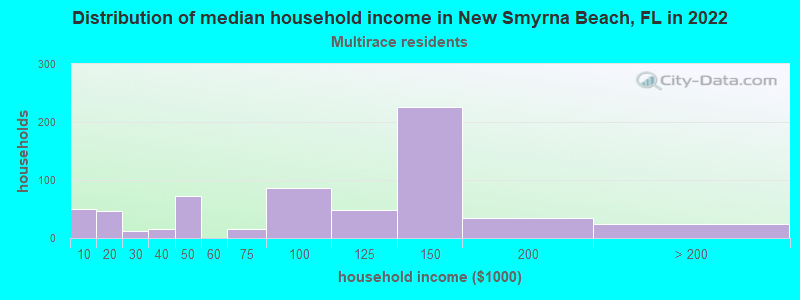
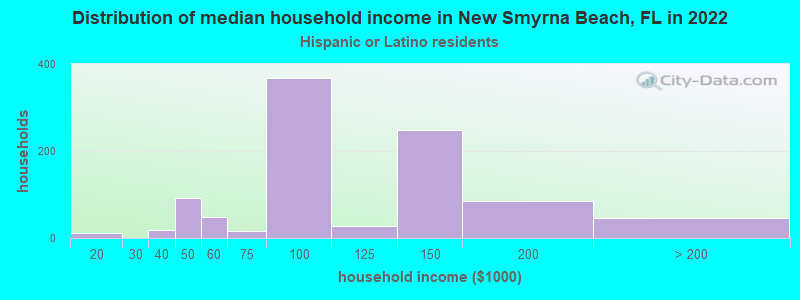
Income and house value in New Smyrna Beach Median household income in 2022 $72,535 White non-Hispanic householders$82,369 Some other race householders$143,965 Two or more races householders$115,953 Hispanic or Latino race householdersMedian 2022 house value $426,685 White Non-Hispanic householders$210,085 Black or African American householders$305,356 American Indian or Alaska Native householders $656,720 Asian householders$357,471 Two or more races householders$427,499 Hispanic or Latino householders
Median age by race in New Smyrna Beach
59.8 Median age for White residents59.2 60.8 56.8 Median age for Black or African American residents58.9 57.8 -495,279,592.8 Median age for American Indian / Alaska Native residents-455,981,940.9 -459,143,968.4 67.1 Median age for Asian residents42.9 74.6 -668,922,729.2 Median age for Native Hawaiian / Pacific Islander residents-668,922,729.2 -443,298,968.6 46.2 Median age for Other race residents27.6 63.7 61.4 Median age for Two or more races residents54.9 69.9 59.5 Median age for White alone residents59.2 61.1 34.3 Median age for Hispanic or Latino residents34.0 36.7
Owner/renter occupied households by race in New Smyrna Beach
House owners and renters - White residents 10,662 77.9% Owner occupied3,028 22.1% Renter occupiedHouse owners and renters - Black or African American residents 142 29.6% Owner occupied338 70.4% Renter occupiedHouse owners and renters - American Indian / Alaska Native residents 13 100.0% Owner occupiedHouse owners and renters - Asian residents 152 92.6% Owner occupied12 7.4% Renter occupiedHouse owners and renters - Other race residents 115 60.9% Owner occupied74 39.1% Renter occupiedHouse owners and renters - Two or more races residents 797 94.5% Owner occupied47 5.5% Renter occupiedHouse owners and renters - White alone residents 10,350 76.5% Owner occupied3,176 23.5% Renter occupiedHouse owners and renters - Hispanic or Latino residents 1,076 100.0% Owner occupied
Language usage in New Smyrna Beach
English speakers - Total 93.4% of residents of New Smyrna Beach speak English at home.
4.7% of residents speak Spanish at home 1,245 88.3% Speak English very well165 11.7% Speak English less than very well2.2% of residents speak other language at home 405 61.0% Speak English very well259 39.0% Speak English less than very well
English speakers - Born in the United States 98.0% of residents of New Smyrna Beach speak English at home.
1.0% of residents speak Spanish at home 196 93.8% Speak English very well13 6.2% Speak English less than very well0.9% of residents speak other language at home 156 83.4% Speak English very well31 16.6% Speak English less than very well
English speakers - Native, born elsewhere 72.3% of residents of New Smyrna Beach speak English at home.
21.3% of residents speak Spanish at home 63 100.0% Speak English very well
English speakers - Foreign-born 51.7% of residents of New Smyrna Beach speak English at home.
29.4% of residents speak Spanish at home 493 86.5% Speak English very well77 13.5% Speak English less than very well20.1% of residents speak other language at home 210 53.8% Speak English very well180 46.2% Speak English less than very well
White (Caucasian) - Speak only English Native:
99.6% (24,750)Foreign-born:
60.6% (609)
White (Caucasian) - Speak another language Native:
1.6% (394)Foreign-born:
43.9% (441)
Black or African American - Speak only English Native:
98.9% (832)Foreign-born:
100.0% (10)
Asian - Speak only English Native:
94.9% (40)Foreign-born:
32.2% (115)
Other race - Speak only English Native:
73.5% (424)Foreign-born:
35.4% (6)
Other race - Speak another language Native:
36.5% (211)Foreign-born:
67.9% (12)
Two or more races - Speak only English Native:
69.5% (755)Foreign-born:
51.3% (302)
Two or more races - Speak another language Native:
30.8% (335)Foreign-born:
43.4% (255)
White alone - Speak only English Native:
99.1% (24,572)Foreign-born:
85.0% (624)
White alone - Speak another language Native:
1.0% (245)Foreign-born:
24.1% (177)
Hispanic or Latino - Speak only English Native:
45.2% (624)Foreign-born:
28.3% (238)
Hispanic or Latino - Speak another language Native:
54.6% (753)Foreign-born:
72.9% (613)
Foreign-born residents in New Smyrna Beach 2,095 residents are foreign born (3.0% Latin America , 2.0% Europe , 1.3% Asia ).
This city:
6.6%Florida:
21.1%
Marital status for residents in New Smyrna Beach Marital status - White (Caucasian) population 15 years and over
Males 23.6% Never married54.6% Now married0.2% Separated5.6% Widowed16.0% DivorcedFemales 12.7% Never married52.0% Now married1.0% Separated15.8% Widowed18.6% DivorcedWomen who gave birth in the past 12 months Now married:
73.1% (158)Unmarried:
26.9% (58)
Women who did not give birth in the past 12 months Now married:
54.1% (1,858)Unmarried:
45.9% (1,577)
Marital status - Black or African American population 15 years and over
Males 34.2% Never married58.5% Now married5.6% Separated1.5% Widowed0.2% DivorcedFemales 3.9% Never married68.8% Now married5.2% Separated10.4% Widowed11.7% DivorcedWomen who did not give birth in the past 12 months Now married:
72.7% (25)Unmarried:
27.3% (9)
Marital status - American Indian / Alaska Native population 15 years and over
Males 0.0% Never married100.0% Now married0.0% Separated0.0% Widowed0.0% DivorcedFemales 0.0% Never married0.0% Now married0.0% Separated100.0% Widowed0.0% DivorcedMarital status - Asian population 15 years and over
Males 0.0% Never married100.0% Now married0.0% Separated0.0% Widowed0.0% DivorcedFemales 12.0% Never married77.4% Now married10.1% Separated0.5% Widowed0.0% DivorcedWomen who did not give birth in the past 12 months Now married:
51.0% (27)Unmarried:
49.0% (26)
Marital status - Other race population 15 years and over
Males 42.4% Never married26.0% Now married0.0% Separated0.0% Widowed31.5% DivorcedFemales 34.0% Never married56.6% Now married0.0% Separated9.4% Widowed0.0% DivorcedMarital status - Two or more races population 15 years and over
Males 6.8% Never married70.0% Now married0.0% Separated0.0% Widowed23.2% DivorcedFemales 14.3% Never married40.4% Now married2.3% Separated5.2% Widowed37.8% DivorcedWomen who did not give birth in the past 12 months Now married:
79.8% (345)Unmarried:
20.2% (88)
Marital status - White alone, not Hispanic / Latino population 15 years and over
Males 23.9% Never married53.5% Now married0.2% Separated5.9% Widowed16.5% DivorcedFemales 13.1% Never married50.2% Now married1.0% Separated16.3% Widowed19.4% DivorcedWomen who gave birth in the past 12 months Now married:
73.1% (166)Unmarried:
26.9% (61)
Women who did not give birth in the past 12 months Now married:
48.6% (1,543)Unmarried:
51.4% (1,634)
Marital status - Hispanic or Latino population 15 years and over
Males 26.6% Never married63.5% Now married0.0% Separated0.0% Widowed10.0% DivorcedFemales 5.8% Never married60.6% Now married0.0% Separated4.3% Widowed29.3% DivorcedWomen who did not give birth in the past 12 months Now married:
96.0% (616)Unmarried:
4.0% (26)
Ancestries in New Smyrna Beach
2,006 12.8% American1,846 11.8% English1,538 9.8% Irish1,374 8.8% German1,163 7.4% Italian666 4.3% European641 4.1% Polish315 2.0% Scottish304 1.9% Hungarian239 1.5% French174 1.1% Russian129 0.8% Swedish126 0.8% Greek102 0.7% British84 0.5% Scotch-Irish83 0.5% Welsh82 0.5% Portuguese73 0.5% Norwegian73 0.5% Romanian69 0.4% Dutch55 0.4% French Canadian50 0.3% Canadian45 0.3% Austrian45 0.3% Latvian43 0.3% Swiss38 0.2% Eastern European37 0.2% Danish36 0.2% Brazilian35 0.2% Lebanese33 0.2% Scandinavian19 0.1% West Indian18 0.1% Czechoslovakian14 0.09% Iraqi13 0.08% Finnish11 0.07% Ukrainian11 0.07% Jamaican10 0.06% Israeli8 0.05% Northern European5 0.03% Belgian5 0.03% Czech1 0.01% African
Geographical mobility in New Smyrna Beach Same house 1 year ago 23,176 87.1% White (Caucasian)959 100.0% Black or African American411 100.0% Asian7 100.0% Native Hawaiian / Pacific Islander590 97.7% Other race1,593 87.1% Two or more races22,780 86.4% White alone, not Hispanic / Latino2,198 92.8% Hispanic or LatinoMoved within same county 1,291 4.8% White / Caucasian9 0.9% Black or African American92 5.0% Two or more races1,345 5.1% White alone, not Hispanic / Latino38 1.6% Hispanic or LatinoMoved within same state 419 1.6% White / Caucasian1 0.1% Black or African American8 1.3% Other race52 2.9% Two or more races461 1.7% White alone, not Hispanic / Latino25 1.1% Hispanic or LatinoMoved from different state 1,737 6.5% White / Caucasian37 78.3% American Indian / Alaska Native20 5.1% Asian78 4.2% Two or more races1,745 6.6% White alone, not Hispanic / Latino209 8.8% Hispanic or LatinoMoved from abroad 59 0.2% White80 0.3% White alone, not Hispanic / Latino4 0.2% Hispanic or Latino
Children Nativity (place of birth) in New Smyrna Beach
Children under 6 years - Living with two parents Both parents native 1,310 100.0% NativeOne native, one foreign-born parent 52 100.0% NativeChildren under 6 years - Living with one parent Native parent 287 100.0% NativeChildren 6 to 17 years - Living with two parents Both parents native 911 99.6% Native4 0.4% Foreign-bornOne native, one foreign-born parent 136 100.0% NativeChildren 6 to 17 years - Living with one parent Native parent 1,064 100.0% NativeForeign-born parent 45 50.6% Native44 49.4% Foreign-born
Grandparents responsible for own grandchildren in New Smyrna Beach
Grandparents (30 to 59 years) White / Caucasian 12 100.0% Not responsible for grandchildrenWhite alone, not Hispanic / Latino 13 100.0% Not responsible for grandchildrenGrandparents (60 years and over) White / Caucasian 18 10.0% Responsible for grandchildren164 90.0% Not responsible for grandchildrenWhite alone, not Hispanic / Latino 18 10.2% Responsible for grandchildren159 89.8% Not responsible for grandchildren