Races in New Philadelphia, Ohio (OH) Detailed Stats
Data:
Races - White alone (%)
Races - White alone (% change since 2000)
Races - Black alone (%)
Races - Black alone (% change since 2000)
Races - American Indian alone (%)
Races - American Indian alone (% change since 2000)
Races - Asian alone (%)
Races - Asian alone (% change since 2000)
Races - Hispanic (%)
Races - Hispanic (% change since 2000)
Races - Native Hawaiian and Other Pacific Islander alone (%)
Races - Native Hawaiian and Other Pacific Islander alone (% change since 2000)
Races - Two or more races(%)
Races - Two or more races(% change since 2000)
Races - Other race alone (%)
Races - Other race alone (% change since 2000)
Racial diversity
Place of birth - Born in state of residence (%)
Place of birth - Born in state of residence (%) - White
Place of birth - Born in state of residence (%) - Black or African American
Place of birth - Born in state of residence (%) - Asian
Place of birth - Born in state of residence (%) - Hispanic or Latino
Place of birth - Born in state of residence (%) - American Indian and Alaska Native
Place of birth - Born in state of residence (%) - Multirace
Place of birth - Born in state of residence (%) - Other Race
Place of birth - Born in other state (%)
Place of birth - Born in other state (%) - White
Place of birth - Born in other state (%) - Black or African American
Place of birth - Born in other state (%) - Asian
Place of birth - Born in other state (%) - Hispanic or Latino
Place of birth - Born in other state (%) - American Indian and Alaska Native
Place of birth - Born in other state (%) - Multirace
Place of birth - Born in other state (%) - Other Race
Place of birth - Native, outside of US (%)
Place of birth - Native, outside of US (%) - White
Place of birth - Native, outside of US (%) - Black or African American
Place of birth - Native, outside of US (%) - Asian
Place of birth - Native, outside of US (%) - Hispanic or Latino
Place of birth - Native, outside of US (%) - American Indian and Alaska Native
Place of birth - Native, outside of US (%) - Multirace
Place of birth - Native, outside of US (%) - Other Race
Place of birth - Foreign born (%)
Place of birth - Foreign born (%) - White
Place of birth - Foreign born (%) - Black or African American
Place of birth - Foreign born (%) - Asian
Place of birth - Foreign born (%) - Hispanic or Latino
Place of birth - Foreign born (%) - American Indian and Alaska Native
Place of birth - Foreign born (%) - Multirace
Place of birth - Foreign born (%) - Other Race
Residents speaking English at home (%)
Residents speaking English at home - Born in the United States (%)
Residents speaking English at home - Native, born elsewhere (%)
Residents speaking English at home - Foreign born (%)
Residents speaking Spanish at home (%)
Residents speaking Spanish at home - Born in the United States (%)
Residents speaking Spanish at home - Native, born elsewhere (%)
Residents speaking Spanish at home - Foreign born (%)
Residents speaking other language at home (%)
Residents speaking other language at home - Born in the United States (%)
Residents speaking other language at home - Native, born elsewhere (%)
Residents speaking other language at home - Foreign born (%)
Marital status - Never married (%)
Marital status - Now married (%)
Marital status - Separated (%)
Marital status - Widowed (%)
Marital status - Divorced (%)
Ancestries Reported - Arab (%)
Ancestries Reported - Czech (%)
Ancestries Reported - Danish (%)
Ancestries Reported - Dutch (%)
Ancestries Reported - English (%)
Ancestries Reported - French (%)
Ancestries Reported - French Canadian (%)
Ancestries Reported - German (%)
Ancestries Reported - Greek (%)
Ancestries Reported - Hungarian (%)
Ancestries Reported - Irish (%)
Ancestries Reported - Italian (%)
Ancestries Reported - Lithuanian (%)
Ancestries Reported - Norwegian (%)
Ancestries Reported - Polish (%)
Ancestries Reported - Portuguese (%)
Ancestries Reported - Russian (%)
Ancestries Reported - Scotch-Irish (%)
Ancestries Reported - Scottish (%)
Ancestries Reported - Slovak (%)
Ancestries Reported - Subsaharan African (%)
Ancestries Reported - Swedish (%)
Ancestries Reported - Swiss (%)
Ancestries Reported - Ukrainian (%)
Ancestries Reported - United States (%)
Ancestries Reported - Welsh (%)
Ancestries Reported - West Indian (%)
Ancestries Reported - Other (%)
Geographical mobility - Same house 1 year ago (%)
Geographical mobility - Same house 1 year ago (%) - White
Geographical mobility - Same house 1 year ago (%) - Black or African American
Geographical mobility - Same house 1 year ago (%) - Asian
Geographical mobility - Same house 1 year ago (%) - Hispanic or Latino
Geographical mobility - Same house 1 year ago (%) - American Indian and Alaska Native
Geographical mobility - Same house 1 year ago (%) - Multirace
Geographical mobility - Same house 1 year ago (%) - Other Race
Geographical mobility - Moved within same county (%)
Geographical mobility - Moved within same county (%) - White
Geographical mobility - Moved within same county (%) - Black or African American
Geographical mobility - Moved within same county (%) - Asian
Geographical mobility - Moved within same county (%) - Hispanic or Latino
Geographical mobility - Moved within same county (%) - American Indian and Alaska Native
Geographical mobility - Moved within same county (%) - Multirace
Geographical mobility - Moved within same county (%) - Other Race
Geographical mobility - Moved from different county within same state (%)
Geographical mobility - Moved from different county within same state (%) - White
Geographical mobility - Moved from different county within same state (%) - Black or African American
Geographical mobility - Moved from different county within same state (%) - Asian
Geographical mobility - Moved from different county within same state (%) - Hispanic or Latino
Geographical mobility - Moved from different county within same state (%) - American Indian and Alaska Native
Geographical mobility - Moved from different county within same state (%) - Multirace
Geographical mobility - Moved from different county within same state (%) - Other Race
Geographical mobility - Moved from different state (%)
Geographical mobility - Moved from different state (%) - White
Geographical mobility - Moved from different state (%) - Black or African American
Geographical mobility - Moved from different state (%) - Asian
Geographical mobility - Moved from different state (%) - Hispanic or Latino
Geographical mobility - Moved from different state (%) - American Indian and Alaska Native
Geographical mobility - Moved from different state (%) - Multirace
Geographical mobility - Moved from different state (%) - Other Race
Geographical mobility - Moved from abroad (%)
Geographical mobility - Moved from abroad (%) - White
Geographical mobility - Moved from abroad (%) - Black or African American
Geographical mobility - Moved from abroad (%) - Asian
Geographical mobility - Moved from abroad (%) - Hispanic or Latino
Geographical mobility - Moved from abroad (%) - American Indian and Alaska Native
Geographical mobility - Moved from abroad (%) - Multirace
Geographical mobility - Moved from abroad (%) - Other Race
Place of birth for the foreign-born population - Ireland (%)
Place of birth for the foreign-born population - Denmark (%)
Place of birth for the foreign-born population - Norway (%)
Place of birth for the foreign-born population - Sweden (%)
Place of birth for the foreign-born population - United Kingdom (%)
Place of birth for the foreign-born population - England (%)
Place of birth for the foreign-born population - Scotland (%)
Place of birth for the foreign-born population - Other Northern Europe (%)
Place of birth for the foreign-born population - Austria (%)
Place of birth for the foreign-born population - Belgium (%)
Place of birth for the foreign-born population - France (%)
Place of birth for the foreign-born population - Germany (%)
Place of birth for the foreign-born population - Netherlands (%)
Place of birth for the foreign-born population - Switzerland (%)
Place of birth for the foreign-born population - Other Western Europe (%)
Place of birth for the foreign-born population - Greece (%)
Place of birth for the foreign-born population - Italy (%)
Place of birth for the foreign-born population - Portugal (%)
Place of birth for the foreign-born population - Spain (%)
Place of birth for the foreign-born population - Other Southern Europe (%)
Place of birth for the foreign-born population - Albania (%)
Place of birth for the foreign-born population - Belarus (%)
Place of birth for the foreign-born population - Bosnia and Herzegovina (%)
Place of birth for the foreign-born population - Bulgaria (%)
Place of birth for the foreign-born population - Croatia (%)
Place of birth for the foreign-born population - Czechoslovakia (%)
Place of birth for the foreign-born population - Hungary (%)
Place of birth for the foreign-born population - Latvia (%)
Place of birth for the foreign-born population - Lithuania (%)
Place of birth for the foreign-born population - North Macedonia (Macedonia) (%)
Place of birth for the foreign-born population - Moldova (%)
Place of birth for the foreign-born population - Poland (%)
Place of birth for the foreign-born population - Romania (%)
Place of birth for the foreign-born population - Russia (%)
Place of birth for the foreign-born population - Serbia (%)
Place of birth for the foreign-born population - Ukraine (%)
Place of birth for the foreign-born population - Other Eastern Europe (%)
Place of birth for the foreign-born population - China (%)
Place of birth for the foreign-born population - Hong Kong (%)
Place of birth for the foreign-born population - Taiwan (%)
Place of birth for the foreign-born population - Japan (%)
Place of birth for the foreign-born population - Korea (%)
Place of birth for the foreign-born population - Other Eastern Asia (%)
Place of birth for the foreign-born population - Afghanistan (%)
Place of birth for the foreign-born population - Bangladesh (%)
Place of birth for the foreign-born population - India (%)
Place of birth for the foreign-born population - Iran (%)
Place of birth for the foreign-born population - Kazakhstan (%)
Place of birth for the foreign-born population - Nepal (%)
Place of birth for the foreign-born population - Pakistan (%)
Place of birth for the foreign-born population - Sri Lanka (%)
Place of birth for the foreign-born population - Uzbekistan (%)
Place of birth for the foreign-born population - Other South Central Asia (%)
Place of birth for the foreign-born population - Burma (%)
Place of birth for the foreign-born population - Cambodia (%)
Place of birth for the foreign-born population - Indonesia (%)
Place of birth for the foreign-born population - Laos (%)
Place of birth for the foreign-born population - Malaysia (%)
Place of birth for the foreign-born population - Philippines (%)
Place of birth for the foreign-born population - Singapore (%)
Place of birth for the foreign-born population - Thailand (%)
Place of birth for the foreign-born population - Vietnam (%)
Place of birth for the foreign-born population - Other South Eastern Asia (%)
Place of birth for the foreign-born population - Armenia (%)
Place of birth for the foreign-born population - Iraq (%)
Place of birth for the foreign-born population - Israel (%)
Place of birth for the foreign-born population - Jordan (%)
Place of birth for the foreign-born population - Kuwait (%)
Place of birth for the foreign-born population - Lebanon (%)
Place of birth for the foreign-born population - Saudi Arabia (%)
Place of birth for the foreign-born population - Syria (%)
Place of birth for the foreign-born population - Turkey (%)
Place of birth for the foreign-born population - Yemen (%)
Place of birth for the foreign-born population - Other Western Asia (%)
Place of birth for the foreign-born population - Eritrea (%)
Place of birth for the foreign-born population - Ethiopia (%)
Place of birth for the foreign-born population - Kenya (%)
Place of birth for the foreign-born population - Somalia (%)
Place of birth for the foreign-born population - Uganda (%)
Place of birth for the foreign-born population - Zimbabwe (%)
Place of birth for the foreign-born population - Other Eastern Africa (%)
Place of birth for the foreign-born population - Cameroon (%)
Place of birth for the foreign-born population - Congo (%)
Place of birth for the foreign-born population - Democratic Republic of Congo (Zaire) (%)
Place of birth for the foreign-born population - Other Middle Africa (%)
Place of birth for the foreign-born population - Egypt (%)
Place of birth for the foreign-born population - Morocco (%)
Place of birth for the foreign-born population - Sudan (%)
Place of birth for the foreign-born population - Other Northern Africa (%)
Place of birth for the foreign-born population - South Africa (%)
Place of birth for the foreign-born population - Other Southern Africa (%)
Place of birth for the foreign-born population - Cabo Verde (%)
Place of birth for the foreign-born population - Ghana (%)
Place of birth for the foreign-born population - Liberia (%)
Place of birth for the foreign-born population - Nigeria (%)
Place of birth for the foreign-born population - Senegal (%)
Place of birth for the foreign-born population - Sierra Leone (%)
Place of birth for the foreign-born population - Other Western Africa (%)
Place of birth for the foreign-born population - Australia (%)
Place of birth for the foreign-born population - New Zealand (%)
Place of birth for the foreign-born population - Fiji (%)
Place of birth for the foreign-born population - Micronesia (%)
Place of birth for the foreign-born population - Bahamas (%)
Place of birth for the foreign-born population - Barbados (%)
Place of birth for the foreign-born population - Cuba (%)
Place of birth for the foreign-born population - Dominica (%)
Place of birth for the foreign-born population - Dominican Republic (%)
Place of birth for the foreign-born population - Grenada (%)
Place of birth for the foreign-born population - Haiti (%)
Place of birth for the foreign-born population - Jamaica (%)
Place of birth for the foreign-born population - St. Vincent and the Grenadines (%)
Place of birth for the foreign-born population - Trinidad and Tobago (%)
Place of birth for the foreign-born population - West Indies (%)
Place of birth for the foreign-born population - Other Caribbean (%)
Place of birth for the foreign-born population - Belize (%)
Place of birth for the foreign-born population - Costa Rica (%)
Place of birth for the foreign-born population - El Salvador (%)
Place of birth for the foreign-born population - Guatemala (%)
Place of birth for the foreign-born population - Honduras (%)
Place of birth for the foreign-born population - Mexico (%)
Place of birth for the foreign-born population - Nicaragua (%)
Place of birth for the foreign-born population - Panama (%)
Place of birth for the foreign-born population - Other Central America (%)
Place of birth for the foreign-born population - Argentina (%)
Place of birth for the foreign-born population - Bolivia (%)
Place of birth for the foreign-born population - Brazil (%)
Place of birth for the foreign-born population - Chile (%)
Place of birth for the foreign-born population - Colombia (%)
Place of birth for the foreign-born population - Ecuador (%)
Place of birth for the foreign-born population - Guyana (%)
Place of birth for the foreign-born population - Peru (%)
Place of birth for the foreign-born population - Uruguay (%)
Place of birth for the foreign-born population - Venezuela (%)
Place of birth for the foreign-born population - Other South America (%)
Place of birth for the foreign-born population - Canada (%)
Place of birth for the foreign-born population - Other Northern America (%)
Place of birth for the foreign-born population - Other (%)
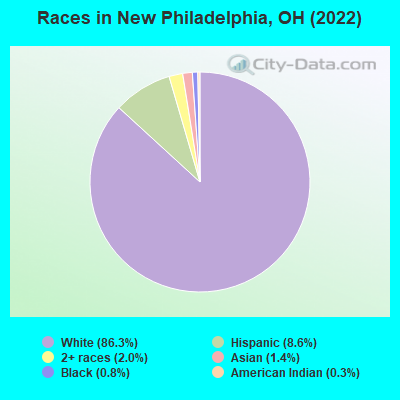
According to 2022 data, the most numerous races in New Philadelphia, OH are White alone (15,169 residents), Black alone (147 residents), and Two or more races (358 residents). 89.9% of New Philadelphia residents speak English at home. 4.4% of New Philadelphia, OH residents are foreign-born (1.6% born in Latin America, 1.2% born in Asia, 0.6% born in Africa), which is 9.2% greater than the foreign-born rate of 4.0% across the entire state of Ohio.
Race distribution in New Philadelphia
2000 2022
9,538,111 84.0% White alone 1,290,662 11.4% Black alone 217,123 1.9% Hispanic 137,770 1.2% Two or more races 131,670 1.2% Asian alone 21,985 0.2% American Indian alone 13,483 0.1% Other race alone 2,336 0.02% Native Hawaiian and Other
8,948,793 76.1% White alone 1,401,403 11.9% Black alone 529,291 4.5% Two or more races 517,232 4.4% Hispanic 293,387 2.5% Asian alone 52,805 0.4% Other race alone 9,785 0.08% American Indian alone 3,362 0.03% Native Hawaiian and Other
Income and house value in New Philadelphia Median household income in 2022 $54,362 White non-Hispanic householders$99,226 Asian householders$41,009 Two or more races householdersMedian 2022 house value $178,077 White Non-Hispanic householders$187,429 Black or African American householders$124,207 American Indian or Alaska Native householders $321,800 Asian householders$152,463 Native Hawaiian and other Pacific Islander householders$132,135 Two or more races householdersover $1,000,000 Hispanic or Latino householders
Median age by race in New Philadelphia
44.5 Median age for White residents41.2 47.1 32.6 Median age for Black or African American residents45.9 14.7 25.8 Median age for American Indian / Alaska Native residents25.6 -666,666,666.0 30.8 Median age for Asian residents33.3 60.0 -666,666,666.0 Median age for Native Hawaiian / Pacific Islander residents-666,666,666.0 -666,666,666.0 25.8 Median age for Other race residents-673,400,672.7 46.7 19.3 Median age for Two or more races residents9.6 30.4 47.1 Median age for White alone residents45.0 48.1 22.2 Median age for Hispanic or Latino residents9.7 31.2
Owner/renter occupied households by race in New Philadelphia
House owners and renters - White residents 5,143 65.8% Owner occupied2,667 34.2% Renter occupiedHouse owners and renters - Black or African American residents 20 25.9% Owner occupied56 74.1% Renter occupiedHouse owners and renters - American Indian / Alaska Native residents 20 32.9% Owner occupied41 67.1% Renter occupiedHouse owners and renters - Asian residents 16 17.7% Owner occupied76 82.3% Renter occupiedHouse owners and renters - Other race residents 50 100.0% Renter occupiedHouse owners and renters - Two or more races residents 6 3.9% Owner occupied141 96.1% Renter occupiedHouse owners and renters - White alone residents 4,964 66.8% Owner occupied2,468 33.2% Renter occupiedHouse owners and renters - Hispanic or Latino residents 259 43.4% Owner occupied339 56.6% Renter occupied
Language usage in New Philadelphia
English speakers - Total 89.9% of residents of New Philadelphia speak English at home.
6.7% of residents speak Spanish at home 472 42.3% Speak English very well645 57.7% Speak English less than very well3.6% of residents speak other language at home 529 87.9% Speak English very well73 12.1% Speak English less than very well
English speakers - Born in the United States 86.1% of residents of New Philadelphia speak English at home.
13.1% of residents speak Spanish at home 78 32.8% Speak English very well160 67.2% Speak English less than very well1.8% of residents speak other language at home 33 100.0% Speak English very well
English speakers - Native, born elsewhere 8.5% of residents of New Philadelphia speak English at home.
89.1% of residents speak Spanish at home 224 49.9% Speak English very well225 50.1% Speak English less than very well
English speakers - Foreign-born 15.0% of residents of New Philadelphia speak English at home.
24.1% of residents speak Spanish at home 4 2.2% Speak English very well181 97.8% Speak English less than very well62.5% of residents speak other language at home 418 86.9% Speak English very well63 13.1% Speak English less than very well
White (Caucasian) - Speak only English Native:
92.8% (13,931)Foreign-born:
13.4% (40)
White (Caucasian) - Speak another language Native:
6.9% (1,043)Foreign-born:
74.2% (219)
Black or African American - Speak only English Native:
95.6% (133)Foreign-born:
100.0% (15)
Asian - Speak only English Native:
100.0% (16)Foreign-born:
9.6% (22)
Other race - Speak another language Native:
73.7% (31)Foreign-born:
100.0% (165)
Two or more races - Speak another language Native:
20.6% (89)Foreign-born:
100.0% (47)
White alone - Speak only English Native:
97.2% (13,823)Foreign-born:
32.5% (34)
White alone - Speak another language Native:
1.8% (262)Foreign-born:
100.0% (104)
Hispanic or Latino - Speak only English Native:
10.9% (123)Foreign-born:
10.8% (38)
Hispanic or Latino - Speak another language Native:
93.0% (1,051)Foreign-born:
86.0% (305)
Foreign-born residents in New Philadelphia 768 residents are foreign born (1.6% Latin America , 1.2% Asia , 0.6% Africa ).
Marital status for residents in New Philadelphia Marital status - White (Caucasian) population 15 years and over
Males 35.4% Never married44.5% Now married0.4% Separated6.7% Widowed13.0% DivorcedFemales 26.6% Never married47.7% Now married1.4% Separated8.3% Widowed16.0% DivorcedWomen who gave birth in the past 12 months Now married:
34.1% (71)Unmarried:
65.9% (138)
Women who did not give birth in the past 12 months Now married:
38.4% (1,116)Unmarried:
61.6% (1,786)
Marital status - Black or African American population 15 years and over
Males 42.6% Never married34.1% Now married0.0% Separated0.0% Widowed23.3% DivorcedFemales 89.3% Never married0.0% Now married0.0% Separated0.0% Widowed10.7% DivorcedWomen who did not give birth in the past 12 months Now married:
0.0% (0)Unmarried:
100.0% (26)
Marital status - American Indian / Alaska Native population 15 years and over
Males 52.6% Never married47.4% Now married0.0% Separated0.0% Widowed0.0% DivorcedFemales 100.0% Never married0.0% Now married0.0% Separated0.0% Widowed0.0% DivorcedWomen who did not give birth in the past 12 months Now married:
0.0% (0)Unmarried:
100.0% (22)
Marital status - Asian population 15 years and over
Males 0.0% Never married35.5% Now married0.0% Separated21.7% Widowed42.8% DivorcedFemales 23.9% Never married76.1% Now married0.0% Separated0.0% Widowed0.0% DivorcedWomen who gave birth in the past 12 months Now married:
100.0% (10)Unmarried:
0.0% (0)
Women who did not give birth in the past 12 months Now married:
0.0% (0)Unmarried:
100.0% (22)
Marital status - Other race population 15 years and over
Males 74.1% Never married25.9% Now married0.0% Separated0.0% Widowed0.0% DivorcedFemales 0.0% Never married100.0% Now married0.0% Separated0.0% Widowed0.0% DivorcedWomen who did not give birth in the past 12 months Now married:
100.0% (45)Unmarried:
0.0% (0)
Marital status - Two or more races population 15 years and over
Males 14.8% Never married50.9% Now married5.6% Separated0.0% Widowed28.7% DivorcedFemales 77.0% Never married20.5% Now married0.0% Separated0.0% Widowed2.5% DivorcedWomen who gave birth in the past 12 months Now married:
100.0% (5)Unmarried:
0.0% (0)
Women who did not give birth in the past 12 months Now married:
11.9% (16)Unmarried:
88.1% (119)
Marital status - White alone, not Hispanic / Latino population 15 years and over
Males 33.4% Never married45.4% Now married0.4% Separated7.1% Widowed13.7% DivorcedFemales 24.3% Never married48.9% Now married1.5% Separated8.7% Widowed16.7% DivorcedWomen who gave birth in the past 12 months Now married:
51.8% (71)Unmarried:
48.2% (66)
Women who did not give birth in the past 12 months Now married:
39.3% (1,060)Unmarried:
60.7% (1,637)
Marital status - Hispanic or Latino population 15 years and over
Males 67.8% Never married31.4% Now married0.0% Separated0.0% Widowed0.8% DivorcedFemales 63.1% Never married36.9% Now married0.0% Separated0.0% Widowed0.0% DivorcedWomen who gave birth in the past 12 months Now married:
0.0% (0)Unmarried:
100.0% (76)
Women who did not give birth in the past 12 months Now married:
40.5% (106)Unmarried:
59.5% (156)
Ancestries in New Philadelphia
1,261 18.0% German1,073 15.3% American920 13.1% English625 8.9% Italian466 6.7% Irish179 2.6% Scotch-Irish135 1.9% European93 1.3% Polish70 1.0% Scottish62 0.9% Swiss54 0.8% Welsh50 0.7% Hungarian50 0.7% Serbian45 0.6% French43 0.6% Moroccan30 0.4% Swedish23 0.3% Slovak22 0.3% British18 0.3% Sierra Leonean10 0.1% Slavic9 0.1% Czechoslovakian8 0.1% Dutch3 0.04% Austrian
Children Nativity (place of birth) in New Philadelphia
Children under 6 years - Living with two parents Both parents native 515 100.0% NativeBoth parents foreign-born 9 100.0% NativeOne native, one foreign-born parent 37 100.0% NativeChildren under 6 years - Living with one parent Native parent 553 100.0% Native
Children 6 to 17 years - Living with two parents Both parents native 868 97.3% Native24 2.7% Foreign-bornOne native, one foreign-born parent 100 100.0% NativeChildren 6 to 17 years - Living with one parent Native parent 1,152 100.0% Native
Grandparents responsible for own grandchildren in New Philadelphia
Grandparents (30 to 59 years) White / Caucasian 2 6.2% Responsible for grandchildren33 93.8% Not responsible for grandchildrenWhite alone, not Hispanic / Latino 3 8.5% Responsible for grandchildren33 91.5% Not responsible for grandchildren
Grandparents (60 years and over) White / Caucasian 27 100.0% Not responsible for grandchildrenWhite alone, not Hispanic / Latino 27 100.0% Not responsible for grandchildren