Races in New Hyde Park, New York (NY) Detailed Stats
Data:
Races - White alone (%)
Races - White alone (% change since 2000)
Races - Black alone (%)
Races - Black alone (% change since 2000)
Races - American Indian alone (%)
Races - American Indian alone (% change since 2000)
Races - Asian alone (%)
Races - Asian alone (% change since 2000)
Races - Hispanic (%)
Races - Hispanic (% change since 2000)
Races - Native Hawaiian and Other Pacific Islander alone (%)
Races - Native Hawaiian and Other Pacific Islander alone (% change since 2000)
Races - Two or more races(%)
Races - Two or more races(% change since 2000)
Races - Other race alone (%)
Races - Other race alone (% change since 2000)
Racial diversity
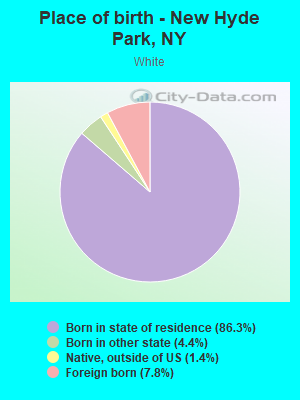
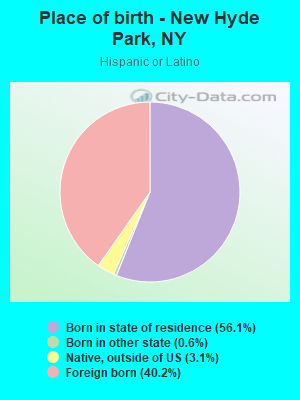
Place of birth - Born in state of residence (%)
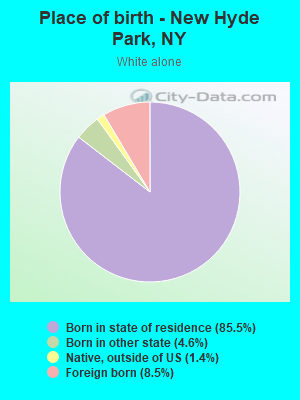
Place of birth - Born in state of residence (%) - White
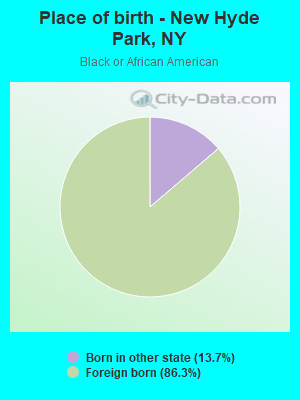
Place of birth - Born in state of residence (%) - Black or African American
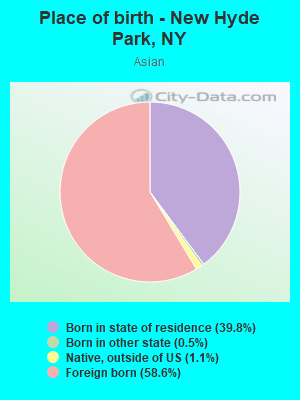
Place of birth - Born in state of residence (%) - Asian
Place of birth - Born in state of residence (%) - Hispanic or Latino
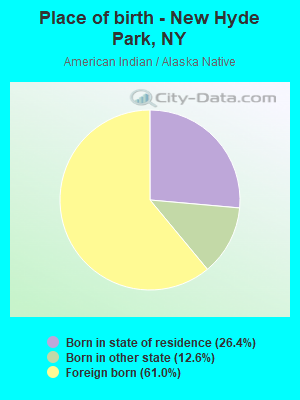
Place of birth - Born in state of residence (%) - American Indian and Alaska Native
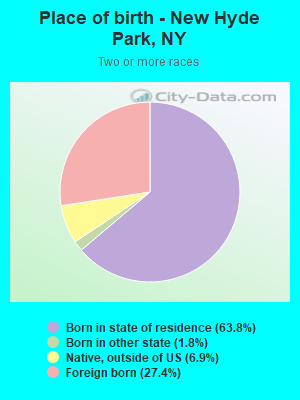
Place of birth - Born in state of residence (%) - Multirace
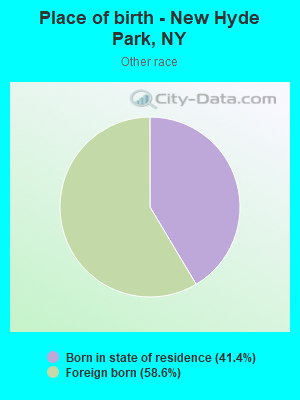
Place of birth - Born in state of residence (%) - Other Race
Place of birth - Born in other state (%)
Place of birth - Born in other state (%) - White
Place of birth - Born in other state (%) - Black or African American
Place of birth - Born in other state (%) - Asian
Place of birth - Born in other state (%) - Hispanic or Latino
Place of birth - Born in other state (%) - American Indian and Alaska Native
Place of birth - Born in other state (%) - Multirace
Place of birth - Born in other state (%) - Other Race
Place of birth - Native, outside of US (%)
Place of birth - Native, outside of US (%) - White
Place of birth - Native, outside of US (%) - Black or African American
Place of birth - Native, outside of US (%) - Asian
Place of birth - Native, outside of US (%) - Hispanic or Latino
Place of birth - Native, outside of US (%) - American Indian and Alaska Native
Place of birth - Native, outside of US (%) - Multirace
Place of birth - Native, outside of US (%) - Other Race
Place of birth - Foreign born (%)
Place of birth - Foreign born (%) - White
Place of birth - Foreign born (%) - Black or African American
Place of birth - Foreign born (%) - Asian
Place of birth - Foreign born (%) - Hispanic or Latino
Place of birth - Foreign born (%) - American Indian and Alaska Native
Place of birth - Foreign born (%) - Multirace
Place of birth - Foreign born (%) - Other Race
Residents speaking English at home (%)
Residents speaking English at home - Born in the United States (%)
Residents speaking English at home - Native, born elsewhere (%)
Residents speaking English at home - Foreign born (%)
Residents speaking Spanish at home (%)
Residents speaking Spanish at home - Born in the United States (%)
Residents speaking Spanish at home - Native, born elsewhere (%)
Residents speaking Spanish at home - Foreign born (%)
Residents speaking other language at home (%)
Residents speaking other language at home - Born in the United States (%)
Residents speaking other language at home - Native, born elsewhere (%)
Residents speaking other language at home - Foreign born (%)
Marital status - Never married (%)
Marital status - Now married (%)
Marital status - Separated (%)
Marital status - Widowed (%)
Marital status - Divorced (%)
Ancestries Reported - Arab (%)
Ancestries Reported - Czech (%)
Ancestries Reported - Danish (%)
Ancestries Reported - Dutch (%)
Ancestries Reported - English (%)
Ancestries Reported - French (%)
Ancestries Reported - French Canadian (%)
Ancestries Reported - German (%)
Ancestries Reported - Greek (%)
Ancestries Reported - Hungarian (%)
Ancestries Reported - Irish (%)
Ancestries Reported - Italian (%)
Ancestries Reported - Lithuanian (%)
Ancestries Reported - Norwegian (%)
Ancestries Reported - Polish (%)
Ancestries Reported - Portuguese (%)
Ancestries Reported - Russian (%)
Ancestries Reported - Scotch-Irish (%)
Ancestries Reported - Scottish (%)
Ancestries Reported - Slovak (%)
Ancestries Reported - Subsaharan African (%)
Ancestries Reported - Swedish (%)
Ancestries Reported - Swiss (%)
Ancestries Reported - Ukrainian (%)
Ancestries Reported - United States (%)
Ancestries Reported - Welsh (%)
Ancestries Reported - West Indian (%)
Ancestries Reported - Other (%)
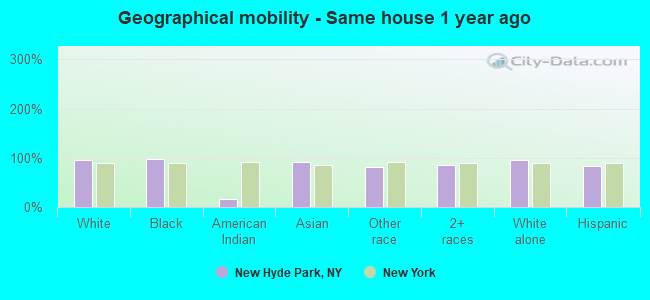
Geographical mobility - Same house 1 year ago (%)
Geographical mobility - Same house 1 year ago (%) - White
Geographical mobility - Same house 1 year ago (%) - Black or African American
Geographical mobility - Same house 1 year ago (%) - Asian
Geographical mobility - Same house 1 year ago (%) - Hispanic or Latino
Geographical mobility - Same house 1 year ago (%) - American Indian and Alaska Native
Geographical mobility - Same house 1 year ago (%) - Multirace
Geographical mobility - Same house 1 year ago (%) - Other Race
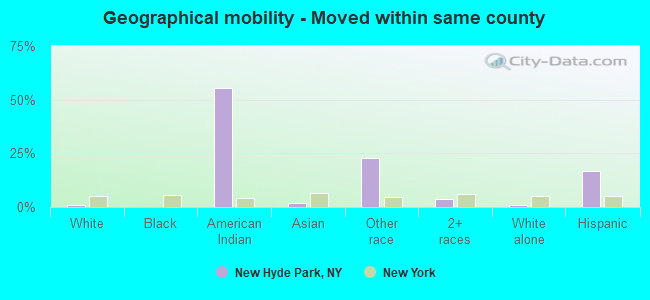
Geographical mobility - Moved within same county (%)
Geographical mobility - Moved within same county (%) - White
Geographical mobility - Moved within same county (%) - Black or African American
Geographical mobility - Moved within same county (%) - Asian
Geographical mobility - Moved within same county (%) - Hispanic or Latino
Geographical mobility - Moved within same county (%) - American Indian and Alaska Native
Geographical mobility - Moved within same county (%) - Multirace
Geographical mobility - Moved within same county (%) - Other Race
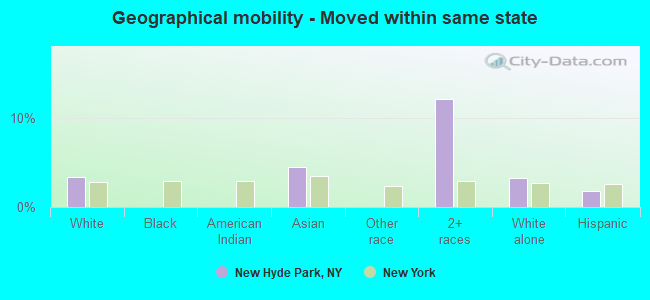
Geographical mobility - Moved from different county within same state (%)
Geographical mobility - Moved from different county within same state (%) - White
Geographical mobility - Moved from different county within same state (%) - Black or African American
Geographical mobility - Moved from different county within same state (%) - Asian
Geographical mobility - Moved from different county within same state (%) - Hispanic or Latino
Geographical mobility - Moved from different county within same state (%) - American Indian and Alaska Native
Geographical mobility - Moved from different county within same state (%) - Multirace
Geographical mobility - Moved from different county within same state (%) - Other Race
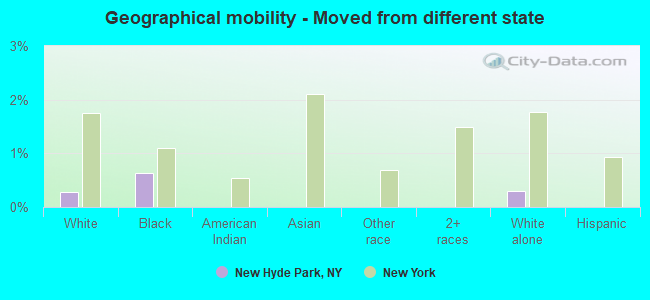
Geographical mobility - Moved from different state (%)
Geographical mobility - Moved from different state (%) - White
Geographical mobility - Moved from different state (%) - Black or African American
Geographical mobility - Moved from different state (%) - Asian
Geographical mobility - Moved from different state (%) - Hispanic or Latino
Geographical mobility - Moved from different state (%) - American Indian and Alaska Native
Geographical mobility - Moved from different state (%) - Multirace
Geographical mobility - Moved from different state (%) - Other Race
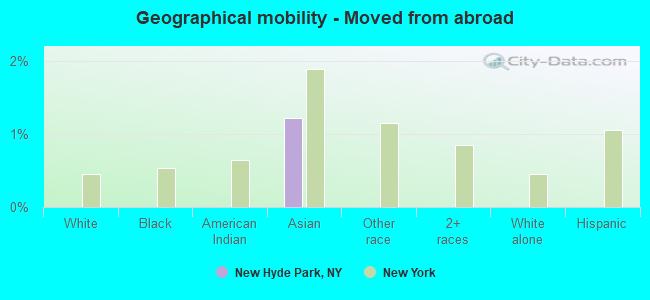
Geographical mobility - Moved from abroad (%)
Geographical mobility - Moved from abroad (%) - White
Geographical mobility - Moved from abroad (%) - Black or African American
Geographical mobility - Moved from abroad (%) - Asian
Geographical mobility - Moved from abroad (%) - Hispanic or Latino
Geographical mobility - Moved from abroad (%) - American Indian and Alaska Native
Geographical mobility - Moved from abroad (%) - Multirace
Geographical mobility - Moved from abroad (%) - Other Race
Place of birth for the foreign-born population - Ireland (%)
Place of birth for the foreign-born population - Denmark (%)
Place of birth for the foreign-born population - Norway (%)
Place of birth for the foreign-born population - Sweden (%)
Place of birth for the foreign-born population - United Kingdom (%)
Place of birth for the foreign-born population - England (%)
Place of birth for the foreign-born population - Scotland (%)
Place of birth for the foreign-born population - Other Northern Europe (%)
Place of birth for the foreign-born population - Austria (%)
Place of birth for the foreign-born population - Belgium (%)
Place of birth for the foreign-born population - France (%)
Place of birth for the foreign-born population - Germany (%)
Place of birth for the foreign-born population - Netherlands (%)
Place of birth for the foreign-born population - Switzerland (%)
Place of birth for the foreign-born population - Other Western Europe (%)
Place of birth for the foreign-born population - Greece (%)
Place of birth for the foreign-born population - Italy (%)
Place of birth for the foreign-born population - Portugal (%)
Place of birth for the foreign-born population - Spain (%)
Place of birth for the foreign-born population - Other Southern Europe (%)
Place of birth for the foreign-born population - Albania (%)
Place of birth for the foreign-born population - Belarus (%)
Place of birth for the foreign-born population - Bosnia and Herzegovina (%)
Place of birth for the foreign-born population - Bulgaria (%)
Place of birth for the foreign-born population - Croatia (%)
Place of birth for the foreign-born population - Czechoslovakia (%)
Place of birth for the foreign-born population - Hungary (%)
Place of birth for the foreign-born population - Latvia (%)
Place of birth for the foreign-born population - Lithuania (%)
Place of birth for the foreign-born population - North Macedonia (Macedonia) (%)
Place of birth for the foreign-born population - Moldova (%)
Place of birth for the foreign-born population - Poland (%)
Place of birth for the foreign-born population - Romania (%)
Place of birth for the foreign-born population - Russia (%)
Place of birth for the foreign-born population - Serbia (%)
Place of birth for the foreign-born population - Ukraine (%)
Place of birth for the foreign-born population - Other Eastern Europe (%)
Place of birth for the foreign-born population - China (%)
Place of birth for the foreign-born population - Hong Kong (%)
Place of birth for the foreign-born population - Taiwan (%)
Place of birth for the foreign-born population - Japan (%)
Place of birth for the foreign-born population - Korea (%)
Place of birth for the foreign-born population - Other Eastern Asia (%)
Place of birth for the foreign-born population - Afghanistan (%)
Place of birth for the foreign-born population - Bangladesh (%)
Place of birth for the foreign-born population - India (%)
Place of birth for the foreign-born population - Iran (%)
Place of birth for the foreign-born population - Kazakhstan (%)
Place of birth for the foreign-born population - Nepal (%)
Place of birth for the foreign-born population - Pakistan (%)
Place of birth for the foreign-born population - Sri Lanka (%)
Place of birth for the foreign-born population - Uzbekistan (%)
Place of birth for the foreign-born population - Other South Central Asia (%)
Place of birth for the foreign-born population - Burma (%)
Place of birth for the foreign-born population - Cambodia (%)
Place of birth for the foreign-born population - Indonesia (%)
Place of birth for the foreign-born population - Laos (%)
Place of birth for the foreign-born population - Malaysia (%)
Place of birth for the foreign-born population - Philippines (%)
Place of birth for the foreign-born population - Singapore (%)
Place of birth for the foreign-born population - Thailand (%)
Place of birth for the foreign-born population - Vietnam (%)
Place of birth for the foreign-born population - Other South Eastern Asia (%)
Place of birth for the foreign-born population - Armenia (%)
Place of birth for the foreign-born population - Iraq (%)
Place of birth for the foreign-born population - Israel (%)
Place of birth for the foreign-born population - Jordan (%)
Place of birth for the foreign-born population - Kuwait (%)
Place of birth for the foreign-born population - Lebanon (%)
Place of birth for the foreign-born population - Saudi Arabia (%)
Place of birth for the foreign-born population - Syria (%)
Place of birth for the foreign-born population - Turkey (%)
Place of birth for the foreign-born population - Yemen (%)
Place of birth for the foreign-born population - Other Western Asia (%)
Place of birth for the foreign-born population - Eritrea (%)
Place of birth for the foreign-born population - Ethiopia (%)
Place of birth for the foreign-born population - Kenya (%)
Place of birth for the foreign-born population - Somalia (%)
Place of birth for the foreign-born population - Uganda (%)
Place of birth for the foreign-born population - Zimbabwe (%)
Place of birth for the foreign-born population - Other Eastern Africa (%)
Place of birth for the foreign-born population - Cameroon (%)
Place of birth for the foreign-born population - Congo (%)
Place of birth for the foreign-born population - Democratic Republic of Congo (Zaire) (%)
Place of birth for the foreign-born population - Other Middle Africa (%)
Place of birth for the foreign-born population - Egypt (%)
Place of birth for the foreign-born population - Morocco (%)
Place of birth for the foreign-born population - Sudan (%)
Place of birth for the foreign-born population - Other Northern Africa (%)
Place of birth for the foreign-born population - South Africa (%)
Place of birth for the foreign-born population - Other Southern Africa (%)
Place of birth for the foreign-born population - Cabo Verde (%)
Place of birth for the foreign-born population - Ghana (%)
Place of birth for the foreign-born population - Liberia (%)
Place of birth for the foreign-born population - Nigeria (%)
Place of birth for the foreign-born population - Senegal (%)
Place of birth for the foreign-born population - Sierra Leone (%)
Place of birth for the foreign-born population - Other Western Africa (%)
Place of birth for the foreign-born population - Australia (%)
Place of birth for the foreign-born population - New Zealand (%)
Place of birth for the foreign-born population - Fiji (%)
Place of birth for the foreign-born population - Micronesia (%)
Place of birth for the foreign-born population - Bahamas (%)
Place of birth for the foreign-born population - Barbados (%)
Place of birth for the foreign-born population - Cuba (%)
Place of birth for the foreign-born population - Dominica (%)
Place of birth for the foreign-born population - Dominican Republic (%)
Place of birth for the foreign-born population - Grenada (%)
Place of birth for the foreign-born population - Haiti (%)
Place of birth for the foreign-born population - Jamaica (%)
Place of birth for the foreign-born population - St. Vincent and the Grenadines (%)
Place of birth for the foreign-born population - Trinidad and Tobago (%)
Place of birth for the foreign-born population - West Indies (%)
Place of birth for the foreign-born population - Other Caribbean (%)
Place of birth for the foreign-born population - Belize (%)
Place of birth for the foreign-born population - Costa Rica (%)
Place of birth for the foreign-born population - El Salvador (%)
Place of birth for the foreign-born population - Guatemala (%)
Place of birth for the foreign-born population - Honduras (%)
Place of birth for the foreign-born population - Mexico (%)
Place of birth for the foreign-born population - Nicaragua (%)
Place of birth for the foreign-born population - Panama (%)
Place of birth for the foreign-born population - Other Central America (%)
Place of birth for the foreign-born population - Argentina (%)
Place of birth for the foreign-born population - Bolivia (%)
Place of birth for the foreign-born population - Brazil (%)
Place of birth for the foreign-born population - Chile (%)
Place of birth for the foreign-born population - Colombia (%)
Place of birth for the foreign-born population - Ecuador (%)
Place of birth for the foreign-born population - Guyana (%)
Place of birth for the foreign-born population - Peru (%)
Place of birth for the foreign-born population - Uruguay (%)
Place of birth for the foreign-born population - Venezuela (%)
Place of birth for the foreign-born population - Other South America (%)
Place of birth for the foreign-born population - Canada (%)
Place of birth for the foreign-born population - Other Northern America (%)
Place of birth for the foreign-born population - Other (%)
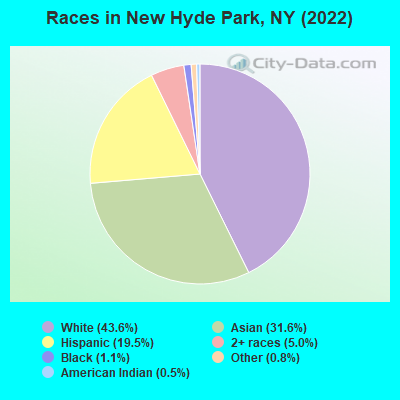
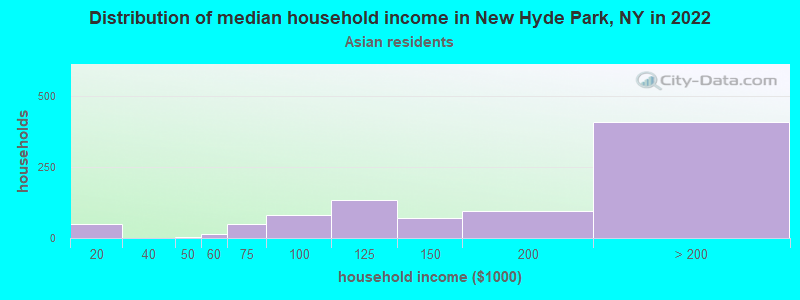
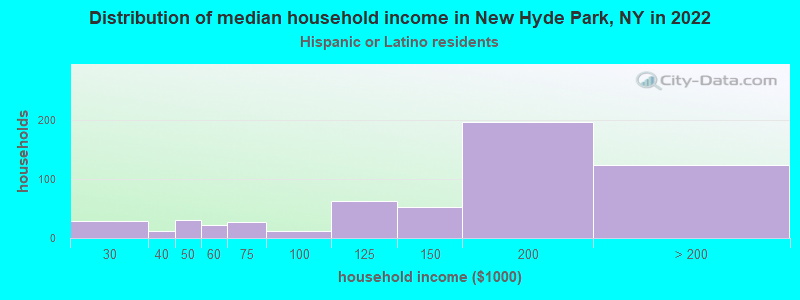
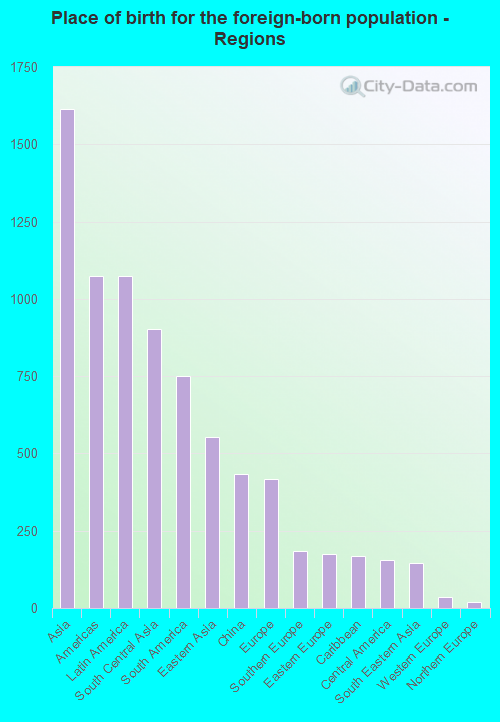
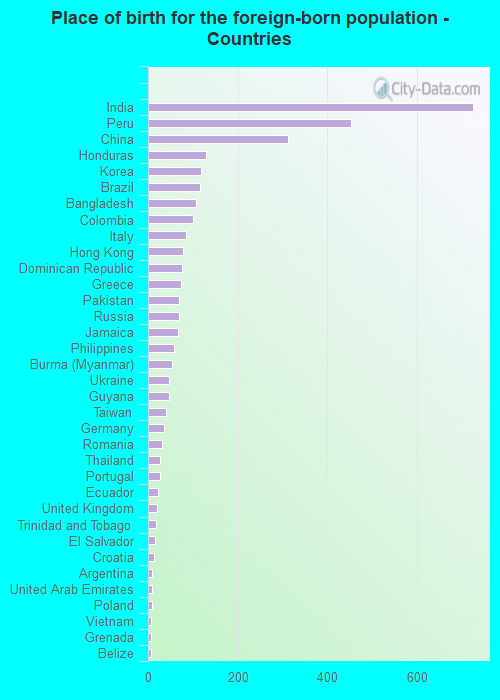
According to 2022 data, the most numerous races in New Hyde Park, NY are White alone (4,444 residents), Hispanic (1,987 residents), and Black alone (111 residents). 58.6% of New Hyde Park residents speak English at home. 30.6% of New Hyde Park, NY residents are foreign-born (15.9% born in Asia, 10.6% born in Latin America, 4.1% born in Europe), which is 28.1% greater than the foreign-born rate of 22.0% across the entire state of New York.
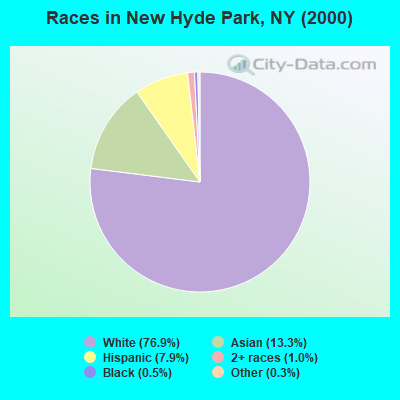
Race distribution in New Hyde Park
2000 2022
11,760,981 62.0% White alone 2,867,583 15.1% Hispanic 2,812,623 14.8% Black alone 1,035,926 5.5% Asian alone 366,116 1.9% Two or more races 75,499 0.4% Other race alone 52,499 0.3% American Indian alone 5,230 0.03% Native Hawaiian and Other
10,408,933 52.9% White alone 3,867,299 19.7% Hispanic 2,633,840 13.4% Black alone 1,776,286 9.0% Asian alone 732,670 3.7% Two or more races 216,110 1.1% Other race alone 35,082 0.2% American Indian alone 6,931 0.04% Native Hawaiian and Other
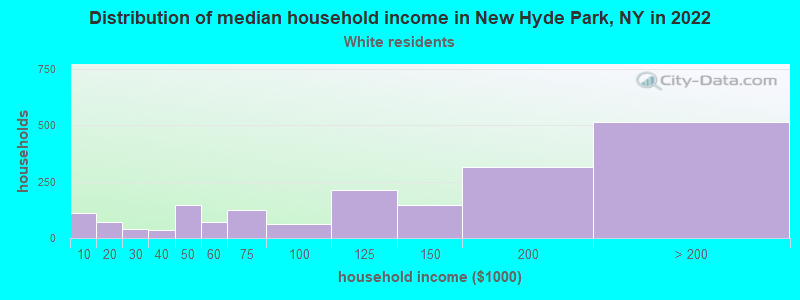
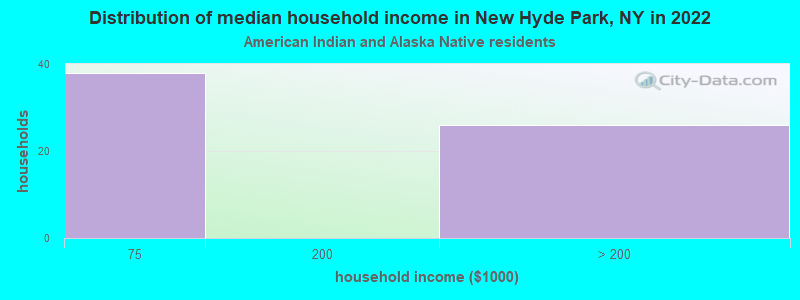
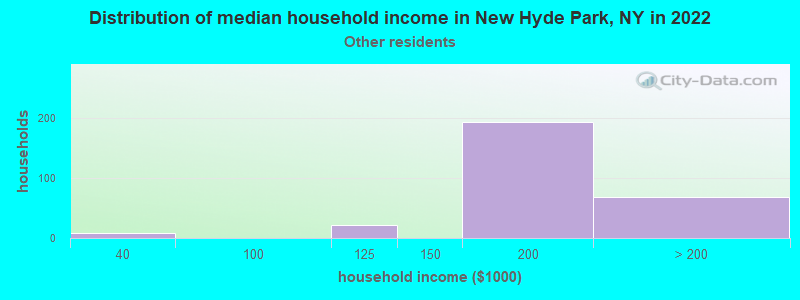
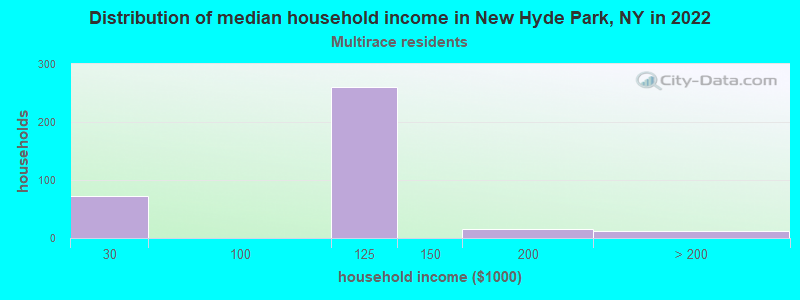
Income and house value in New Hyde Park Median household income in 2022 $134,937 White non-Hispanic householders$177,568 Asian householders$170,385 Some other race householders$115,236 Two or more races householders$155,444 Hispanic or Latino race householdersMedian 2022 house value $699,645 White Non-Hispanic householdersover $1,000,000 Black or African American householdersover $1,000,000 American Indian or Alaska Native householders $793,588 Asian householdersover $1,000,000 Some other race householders$736,178 Two or more races householders$852,737 Hispanic or Latino householders
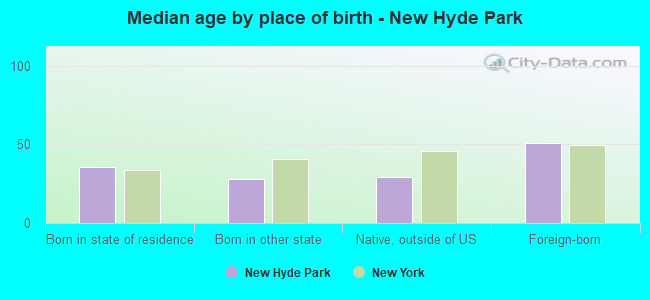
Median age by race in New Hyde Park
49.9 Median age for White residents48.8 52.8 39.4 Median age for Black or African American residents47.8 38.9 43.6 Median age for American Indian / Alaska Native residents38.3 -837,121,211.3 37.3 Median age for Asian residents36.6 37.4 -487,992,314.6 Median age for Native Hawaiian / Pacific Islander residents-477,502,295.2 -497,387,669.3 38.5 Median age for Other race residents38.7 39.2 25.9 Median age for Two or more races residents36.5 23.9 52.4 Median age for White alone residents48.0 54.3 37.5 Median age for Hispanic or Latino residents39.2 36.2
Owner/renter occupied households by race in New Hyde Park
House owners and renters - White residents 1,569 84.7% Owner occupied283 15.3% Renter occupiedHouse owners and renters - Black or African American residents 22 100.0% Owner occupiedHouse owners and renters - American Indian / Alaska Native residents 35 47.5% Owner occupied39 52.5% Renter occupiedHouse owners and renters - Asian residents 773 86.8% Owner occupied118 13.2% Renter occupiedHouse owners and renters - Other race residents 226 77.8% Owner occupied65 22.2% Renter occupiedHouse owners and renters - Two or more races residents 229 70.1% Owner occupied98 29.9% Renter occupiedHouse owners and renters - White alone residents 1,456 87.7% Owner occupied204 12.3% Renter occupiedHouse owners and renters - Hispanic or Latino residents 361 64.7% Owner occupied197 35.3% Renter occupied
Language usage in New Hyde Park
English speakers - Total 58.6% of residents of New Hyde Park speak English at home.
16.0% of residents speak Spanish at home 1,033 66.6% Speak English very well519 33.4% Speak English less than very well25.9% of residents speak other language at home 1,683 67.1% Speak English very well827 32.9% Speak English less than very well
English speakers - Born in the United States 90.3% of residents of New Hyde Park speak English at home.
5.0% of residents speak Spanish at home 14 100.0% Speak English very well4.7% of residents speak other language at home 13 100.0% Speak English very well
English speakers - Native, born elsewhere 27.0% of residents of New Hyde Park speak English at home.
36.2% of residents speak Spanish at home 37 67.3% Speak English very well18 32.7% Speak English less than very well42.8% of residents speak other language at home 20 30.8% Speak English very well45 69.2% Speak English less than very well
English speakers - Foreign-born 15.1% of residents of New Hyde Park speak English at home.
23.6% of residents speak Spanish at home 251 33.1% Speak English very well508 66.9% Speak English less than very well63.2% of residents speak other language at home 1,274 62.7% Speak English very well759 37.3% Speak English less than very well
White (Caucasian) - Speak only English Native:
93.9% (4,148)Foreign-born:
12.7% (48)
White (Caucasian) - Speak another language Native:
6.2% (275)Foreign-born:
83.6% (315)
Black or African American - Speak only English Native:
99.1% (16)Foreign-born:
72.9% (67)
Asian - Speak only English Native:
60.8% (580)Foreign-born:
12.2% (232)
Asian - Speak another language Native:
40.0% (382)Foreign-born:
87.7% (1,659)
Other race - Speak only English Native:
8.3% (41)Foreign-born:
2.9% (19)
Other race - Speak another language Native:
86.8% (427)Foreign-born:
98.5% (665)
Two or more races - Speak only English Native:
53.9% (328)Foreign-born:
48.4% (140)
Two or more races - Speak another language Native:
49.0% (298)Foreign-born:
46.9% (136)
White alone - Speak only English Native:
98.3% (3,952)Foreign-born:
6.9% (26)
White alone - Speak another language Native:
2.1% (84)Foreign-born:
93.7% (356)
Hispanic or Latino - Speak only English Native:
34.9% (408)Foreign-born:
3.2% (25)
Hispanic or Latino - Speak another language Native:
65.4% (764)Foreign-born:
96.8% (769)
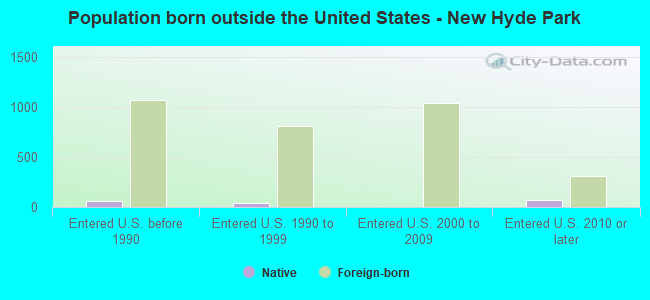
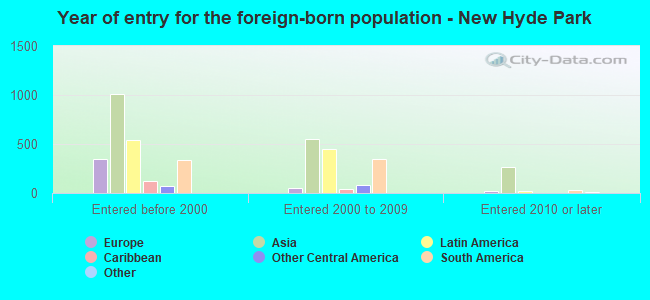
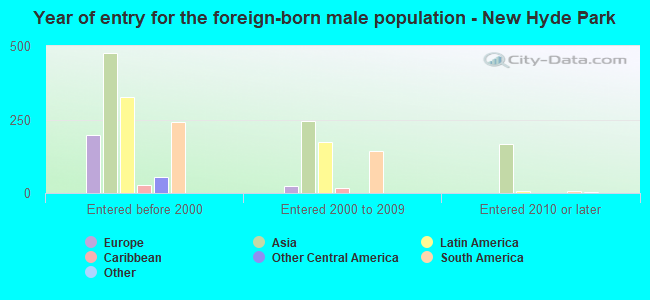
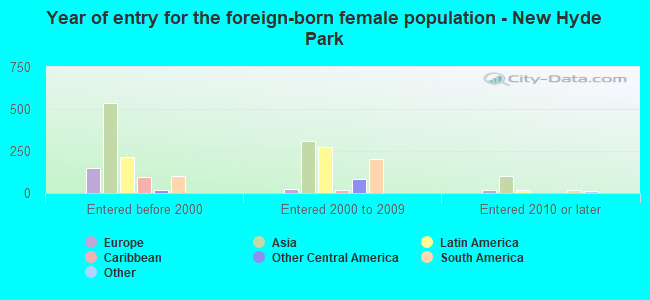
Foreign-born residents in New Hyde Park 3,121 residents are foreign born (15.9% Asia , 10.6% Latin America , 4.1% Europe ).
This city:
30.6%New York:
22.6%
Marital status for residents in New Hyde Park Marital status - White (Caucasian) population 15 years and over
Males 37.8% Never married55.4% Now married0.8% Separated1.8% Widowed4.2% DivorcedFemales 30.1% Never married54.3% Now married0.7% Separated8.4% Widowed6.5% DivorcedWomen who gave birth in the past 12 months Now married:
100.0% (40)Unmarried:
0.0% (0)
Women who did not give birth in the past 12 months Now married:
38.4% (364)Unmarried:
61.6% (583)
Marital status - Black or African American population 15 years and over
Males 38.0% Never married62.0% Now married0.0% Separated0.0% Widowed0.0% DivorcedFemales 23.7% Never married74.6% Now married0.0% Separated0.0% Widowed1.7% DivorcedWomen who did not give birth in the past 12 months Now married:
62.2% (22)Unmarried:
37.8% (13)
Marital status - American Indian / Alaska Native population 15 years and over
Males 50.0% Never married20.4% Now married0.0% Separated0.0% Widowed29.6% DivorcedFemales 51.9% Never married48.1% Now married0.0% Separated0.0% Widowed0.0% DivorcedWomen who did not give birth in the past 12 months Now married:
0.0% (0)Unmarried:
100.0% (39)
Marital status - Asian population 15 years and over
Males 30.8% Never married60.9% Now married0.2% Separated0.4% Widowed7.7% DivorcedFemales 15.5% Never married67.0% Now married0.0% Separated9.2% Widowed8.2% DivorcedWomen who gave birth in the past 12 months Now married:
85.1% (95)Unmarried:
14.9% (17)
Women who did not give birth in the past 12 months Now married:
70.0% (470)Unmarried:
30.0% (201)
Marital status - Other race population 15 years and over
Males 36.8% Never married63.2% Now married0.0% Separated0.0% Widowed0.0% DivorcedFemales 34.6% Never married62.3% Now married3.1% Separated0.0% Widowed0.0% DivorcedWomen who gave birth in the past 12 months Now married:
0.0% (0)Unmarried:
100.0% (14)
Women who did not give birth in the past 12 months Now married:
59.8% (132)Unmarried:
40.2% (89)
Marital status - Two or more races population 15 years and over
Males 28.0% Never married72.0% Now married0.0% Separated0.0% Widowed0.0% DivorcedFemales 35.0% Never married38.1% Now married0.0% Separated6.6% Widowed20.4% DivorcedWomen who gave birth in the past 12 months Now married:
100.0% (18)Unmarried:
0.0% (0)
Women who did not give birth in the past 12 months Now married:
23.5% (47)Unmarried:
76.5% (153)
Marital status - White alone, not Hispanic / Latino population 15 years and over
Males 36.5% Never married57.5% Now married1.0% Separated2.0% Widowed3.0% DivorcedFemales 28.5% Never married56.4% Now married0.7% Separated8.3% Widowed6.1% DivorcedWomen who gave birth in the past 12 months Now married:
100.0% (43)Unmarried:
0.0% (0)
Women who did not give birth in the past 12 months Now married:
38.9% (325)Unmarried:
61.1% (512)
Marital status - Hispanic or Latino population 15 years and over
Males 45.2% Never married47.1% Now married0.0% Separated0.0% Widowed7.7% DivorcedFemales 39.9% Never married48.2% Now married1.6% Separated5.1% Widowed5.2% DivorcedWomen who gave birth in the past 12 months Now married:
0.0% (0)Unmarried:
100.0% (12)
Women who did not give birth in the past 12 months Now married:
43.5% (187)Unmarried:
56.5% (243)
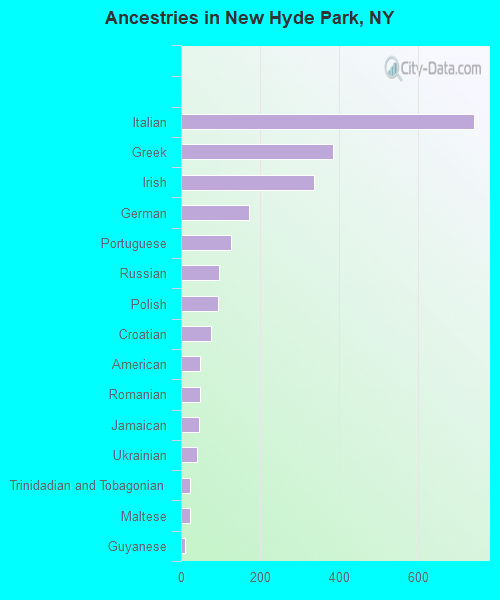
Ancestries in New Hyde Park
743 12.7% Italian386 6.6% Greek336 5.8% Irish172 3.0% German127 2.2% Portuguese96 1.6% Russian94 1.6% Polish77 1.3% Croatian48 0.8% American48 0.8% Romanian45 0.8% Jamaican41 0.7% Ukrainian23 0.4% Trinidadian and Tobagonian22 0.4% Maltese9 0.2% Guyanese6 0.1% Turkish1 0.02% English1 0.02% Kenyan1 0.02% Nigerian
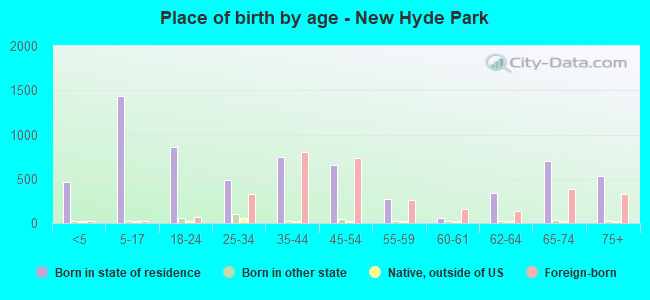
Children Nativity (place of birth) in New Hyde Park
Children under 6 years - Living with two parents Both parents native 48 100.0% NativeBoth parents foreign-born 322 97.4% Native9 2.6% Foreign-bornOne native, one foreign-born parent 116 100.0% NativeChildren under 6 years - Living with one parent Native parent 85 100.0% NativeForeign-born parent 54 100.0% NativeChildren 6 to 17 years - Living with two parents Both parents native 548 100.0% NativeBoth parents foreign-born 295 92.2% Native25 7.8% Foreign-bornOne native, one foreign-born parent 212 100.0% NativeChildren 6 to 17 years - Living with one parent Native parent 92 100.0% NativeForeign-born parent 153 47.2% Native171 52.8% Foreign-born
Grandparents responsible for own grandchildren in New Hyde Park
Grandparents (30 to 59 years) Asian 9 31.9% Responsible for grandchildren19 68.1% Not responsible for grandchildrenOther race 27 28.6% Responsible for grandchildren67 71.4% Not responsible for grandchildrenHispanic or Latino 25 34.3% Responsible for grandchildren47 65.7% Not responsible for grandchildrenGrandparents (60 years and over) Asian 41 19.8% Responsible for grandchildren164 80.2% Not responsible for grandchildrenOther race 18 100.0% Responsible for grandchildrenHispanic or Latino 30 75.0% Responsible for grandchildren10 25.0% Not responsible for grandchildren