Races in New Britain, Connecticut (CT) Detailed Stats
Data:
Races - White alone (%)
Races - White alone (% change since 2000)
Races - Black alone (%)
Races - Black alone (% change since 2000)
Races - American Indian alone (%)
Races - American Indian alone (% change since 2000)
Races - Asian alone (%)
Races - Asian alone (% change since 2000)
Races - Hispanic (%)
Races - Hispanic (% change since 2000)
Races - Native Hawaiian and Other Pacific Islander alone (%)
Races - Native Hawaiian and Other Pacific Islander alone (% change since 2000)
Races - Two or more races(%)
Races - Two or more races(% change since 2000)
Races - Other race alone (%)
Races - Other race alone (% change since 2000)
Racial diversity
Place of birth - Born in state of residence (%)
Place of birth - Born in state of residence (%) - White
Place of birth - Born in state of residence (%) - Black or African American
Place of birth - Born in state of residence (%) - Asian
Place of birth - Born in state of residence (%) - Hispanic or Latino
Place of birth - Born in state of residence (%) - American Indian and Alaska Native
Place of birth - Born in state of residence (%) - Multirace
Place of birth - Born in state of residence (%) - Other Race
Place of birth - Born in other state (%)
Place of birth - Born in other state (%) - White
Place of birth - Born in other state (%) - Black or African American
Place of birth - Born in other state (%) - Asian
Place of birth - Born in other state (%) - Hispanic or Latino
Place of birth - Born in other state (%) - American Indian and Alaska Native
Place of birth - Born in other state (%) - Multirace
Place of birth - Born in other state (%) - Other Race
Place of birth - Native, outside of US (%)
Place of birth - Native, outside of US (%) - White
Place of birth - Native, outside of US (%) - Black or African American
Place of birth - Native, outside of US (%) - Asian
Place of birth - Native, outside of US (%) - Hispanic or Latino
Place of birth - Native, outside of US (%) - American Indian and Alaska Native
Place of birth - Native, outside of US (%) - Multirace
Place of birth - Native, outside of US (%) - Other Race
Place of birth - Foreign born (%)
Place of birth - Foreign born (%) - White
Place of birth - Foreign born (%) - Black or African American
Place of birth - Foreign born (%) - Asian
Place of birth - Foreign born (%) - Hispanic or Latino
Place of birth - Foreign born (%) - American Indian and Alaska Native
Place of birth - Foreign born (%) - Multirace
Place of birth - Foreign born (%) - Other Race
Residents speaking English at home (%)
Residents speaking English at home - Born in the United States (%)
Residents speaking English at home - Native, born elsewhere (%)
Residents speaking English at home - Foreign born (%)
Residents speaking Spanish at home (%)
Residents speaking Spanish at home - Born in the United States (%)
Residents speaking Spanish at home - Native, born elsewhere (%)
Residents speaking Spanish at home - Foreign born (%)
Residents speaking other language at home (%)
Residents speaking other language at home - Born in the United States (%)
Residents speaking other language at home - Native, born elsewhere (%)
Residents speaking other language at home - Foreign born (%)
Marital status - Never married (%)
Marital status - Now married (%)
Marital status - Separated (%)
Marital status - Widowed (%)
Marital status - Divorced (%)
Ancestries Reported - Arab (%)
Ancestries Reported - Czech (%)
Ancestries Reported - Danish (%)
Ancestries Reported - Dutch (%)
Ancestries Reported - English (%)
Ancestries Reported - French (%)
Ancestries Reported - French Canadian (%)
Ancestries Reported - German (%)
Ancestries Reported - Greek (%)
Ancestries Reported - Hungarian (%)
Ancestries Reported - Irish (%)
Ancestries Reported - Italian (%)
Ancestries Reported - Lithuanian (%)
Ancestries Reported - Norwegian (%)
Ancestries Reported - Polish (%)
Ancestries Reported - Portuguese (%)
Ancestries Reported - Russian (%)
Ancestries Reported - Scotch-Irish (%)
Ancestries Reported - Scottish (%)
Ancestries Reported - Slovak (%)
Ancestries Reported - Subsaharan African (%)
Ancestries Reported - Swedish (%)
Ancestries Reported - Swiss (%)
Ancestries Reported - Ukrainian (%)
Ancestries Reported - United States (%)
Ancestries Reported - Welsh (%)
Ancestries Reported - West Indian (%)
Ancestries Reported - Other (%)
Geographical mobility - Same house 1 year ago (%)
Geographical mobility - Same house 1 year ago (%) - White
Geographical mobility - Same house 1 year ago (%) - Black or African American
Geographical mobility - Same house 1 year ago (%) - Asian
Geographical mobility - Same house 1 year ago (%) - Hispanic or Latino
Geographical mobility - Same house 1 year ago (%) - American Indian and Alaska Native
Geographical mobility - Same house 1 year ago (%) - Multirace
Geographical mobility - Same house 1 year ago (%) - Other Race
Geographical mobility - Moved within same county (%)
Geographical mobility - Moved within same county (%) - White
Geographical mobility - Moved within same county (%) - Black or African American
Geographical mobility - Moved within same county (%) - Asian
Geographical mobility - Moved within same county (%) - Hispanic or Latino
Geographical mobility - Moved within same county (%) - American Indian and Alaska Native
Geographical mobility - Moved within same county (%) - Multirace
Geographical mobility - Moved within same county (%) - Other Race
Geographical mobility - Moved from different county within same state (%)
Geographical mobility - Moved from different county within same state (%) - White
Geographical mobility - Moved from different county within same state (%) - Black or African American
Geographical mobility - Moved from different county within same state (%) - Asian
Geographical mobility - Moved from different county within same state (%) - Hispanic or Latino
Geographical mobility - Moved from different county within same state (%) - American Indian and Alaska Native
Geographical mobility - Moved from different county within same state (%) - Multirace
Geographical mobility - Moved from different county within same state (%) - Other Race
Geographical mobility - Moved from different state (%)
Geographical mobility - Moved from different state (%) - White
Geographical mobility - Moved from different state (%) - Black or African American
Geographical mobility - Moved from different state (%) - Asian
Geographical mobility - Moved from different state (%) - Hispanic or Latino
Geographical mobility - Moved from different state (%) - American Indian and Alaska Native
Geographical mobility - Moved from different state (%) - Multirace
Geographical mobility - Moved from different state (%) - Other Race
Geographical mobility - Moved from abroad (%)
Geographical mobility - Moved from abroad (%) - White
Geographical mobility - Moved from abroad (%) - Black or African American
Geographical mobility - Moved from abroad (%) - Asian
Geographical mobility - Moved from abroad (%) - Hispanic or Latino
Geographical mobility - Moved from abroad (%) - American Indian and Alaska Native
Geographical mobility - Moved from abroad (%) - Multirace
Geographical mobility - Moved from abroad (%) - Other Race
Place of birth for the foreign-born population - Ireland (%)
Place of birth for the foreign-born population - Denmark (%)
Place of birth for the foreign-born population - Norway (%)
Place of birth for the foreign-born population - Sweden (%)
Place of birth for the foreign-born population - United Kingdom (%)
Place of birth for the foreign-born population - England (%)
Place of birth for the foreign-born population - Scotland (%)
Place of birth for the foreign-born population - Other Northern Europe (%)
Place of birth for the foreign-born population - Austria (%)
Place of birth for the foreign-born population - Belgium (%)
Place of birth for the foreign-born population - France (%)
Place of birth for the foreign-born population - Germany (%)
Place of birth for the foreign-born population - Netherlands (%)
Place of birth for the foreign-born population - Switzerland (%)
Place of birth for the foreign-born population - Other Western Europe (%)
Place of birth for the foreign-born population - Greece (%)
Place of birth for the foreign-born population - Italy (%)
Place of birth for the foreign-born population - Portugal (%)
Place of birth for the foreign-born population - Spain (%)
Place of birth for the foreign-born population - Other Southern Europe (%)
Place of birth for the foreign-born population - Albania (%)
Place of birth for the foreign-born population - Belarus (%)
Place of birth for the foreign-born population - Bosnia and Herzegovina (%)
Place of birth for the foreign-born population - Bulgaria (%)
Place of birth for the foreign-born population - Croatia (%)
Place of birth for the foreign-born population - Czechoslovakia (%)
Place of birth for the foreign-born population - Hungary (%)
Place of birth for the foreign-born population - Latvia (%)
Place of birth for the foreign-born population - Lithuania (%)
Place of birth for the foreign-born population - North Macedonia (Macedonia) (%)
Place of birth for the foreign-born population - Moldova (%)
Place of birth for the foreign-born population - Poland (%)
Place of birth for the foreign-born population - Romania (%)
Place of birth for the foreign-born population - Russia (%)
Place of birth for the foreign-born population - Serbia (%)
Place of birth for the foreign-born population - Ukraine (%)
Place of birth for the foreign-born population - Other Eastern Europe (%)
Place of birth for the foreign-born population - China (%)
Place of birth for the foreign-born population - Hong Kong (%)
Place of birth for the foreign-born population - Taiwan (%)
Place of birth for the foreign-born population - Japan (%)
Place of birth for the foreign-born population - Korea (%)
Place of birth for the foreign-born population - Other Eastern Asia (%)
Place of birth for the foreign-born population - Afghanistan (%)
Place of birth for the foreign-born population - Bangladesh (%)
Place of birth for the foreign-born population - India (%)
Place of birth for the foreign-born population - Iran (%)
Place of birth for the foreign-born population - Kazakhstan (%)
Place of birth for the foreign-born population - Nepal (%)
Place of birth for the foreign-born population - Pakistan (%)
Place of birth for the foreign-born population - Sri Lanka (%)
Place of birth for the foreign-born population - Uzbekistan (%)
Place of birth for the foreign-born population - Other South Central Asia (%)
Place of birth for the foreign-born population - Burma (%)
Place of birth for the foreign-born population - Cambodia (%)
Place of birth for the foreign-born population - Indonesia (%)
Place of birth for the foreign-born population - Laos (%)
Place of birth for the foreign-born population - Malaysia (%)
Place of birth for the foreign-born population - Philippines (%)
Place of birth for the foreign-born population - Singapore (%)
Place of birth for the foreign-born population - Thailand (%)
Place of birth for the foreign-born population - Vietnam (%)
Place of birth for the foreign-born population - Other South Eastern Asia (%)
Place of birth for the foreign-born population - Armenia (%)
Place of birth for the foreign-born population - Iraq (%)
Place of birth for the foreign-born population - Israel (%)
Place of birth for the foreign-born population - Jordan (%)
Place of birth for the foreign-born population - Kuwait (%)
Place of birth for the foreign-born population - Lebanon (%)
Place of birth for the foreign-born population - Saudi Arabia (%)
Place of birth for the foreign-born population - Syria (%)
Place of birth for the foreign-born population - Turkey (%)
Place of birth for the foreign-born population - Yemen (%)
Place of birth for the foreign-born population - Other Western Asia (%)
Place of birth for the foreign-born population - Eritrea (%)
Place of birth for the foreign-born population - Ethiopia (%)
Place of birth for the foreign-born population - Kenya (%)
Place of birth for the foreign-born population - Somalia (%)
Place of birth for the foreign-born population - Uganda (%)
Place of birth for the foreign-born population - Zimbabwe (%)
Place of birth for the foreign-born population - Other Eastern Africa (%)
Place of birth for the foreign-born population - Cameroon (%)
Place of birth for the foreign-born population - Congo (%)
Place of birth for the foreign-born population - Democratic Republic of Congo (Zaire) (%)
Place of birth for the foreign-born population - Other Middle Africa (%)
Place of birth for the foreign-born population - Egypt (%)
Place of birth for the foreign-born population - Morocco (%)
Place of birth for the foreign-born population - Sudan (%)
Place of birth for the foreign-born population - Other Northern Africa (%)
Place of birth for the foreign-born population - South Africa (%)
Place of birth for the foreign-born population - Other Southern Africa (%)
Place of birth for the foreign-born population - Cabo Verde (%)
Place of birth for the foreign-born population - Ghana (%)
Place of birth for the foreign-born population - Liberia (%)
Place of birth for the foreign-born population - Nigeria (%)
Place of birth for the foreign-born population - Senegal (%)
Place of birth for the foreign-born population - Sierra Leone (%)
Place of birth for the foreign-born population - Other Western Africa (%)
Place of birth for the foreign-born population - Australia (%)
Place of birth for the foreign-born population - New Zealand (%)
Place of birth for the foreign-born population - Fiji (%)
Place of birth for the foreign-born population - Micronesia (%)
Place of birth for the foreign-born population - Bahamas (%)
Place of birth for the foreign-born population - Barbados (%)
Place of birth for the foreign-born population - Cuba (%)
Place of birth for the foreign-born population - Dominica (%)
Place of birth for the foreign-born population - Dominican Republic (%)
Place of birth for the foreign-born population - Grenada (%)
Place of birth for the foreign-born population - Haiti (%)
Place of birth for the foreign-born population - Jamaica (%)
Place of birth for the foreign-born population - St. Vincent and the Grenadines (%)
Place of birth for the foreign-born population - Trinidad and Tobago (%)
Place of birth for the foreign-born population - West Indies (%)
Place of birth for the foreign-born population - Other Caribbean (%)
Place of birth for the foreign-born population - Belize (%)
Place of birth for the foreign-born population - Costa Rica (%)
Place of birth for the foreign-born population - El Salvador (%)
Place of birth for the foreign-born population - Guatemala (%)
Place of birth for the foreign-born population - Honduras (%)
Place of birth for the foreign-born population - Mexico (%)
Place of birth for the foreign-born population - Nicaragua (%)
Place of birth for the foreign-born population - Panama (%)
Place of birth for the foreign-born population - Other Central America (%)
Place of birth for the foreign-born population - Argentina (%)
Place of birth for the foreign-born population - Bolivia (%)
Place of birth for the foreign-born population - Brazil (%)
Place of birth for the foreign-born population - Chile (%)
Place of birth for the foreign-born population - Colombia (%)
Place of birth for the foreign-born population - Ecuador (%)
Place of birth for the foreign-born population - Guyana (%)
Place of birth for the foreign-born population - Peru (%)
Place of birth for the foreign-born population - Uruguay (%)
Place of birth for the foreign-born population - Venezuela (%)
Place of birth for the foreign-born population - Other South America (%)
Place of birth for the foreign-born population - Canada (%)
Place of birth for the foreign-born population - Other Northern America (%)
Place of birth for the foreign-born population - Other (%)
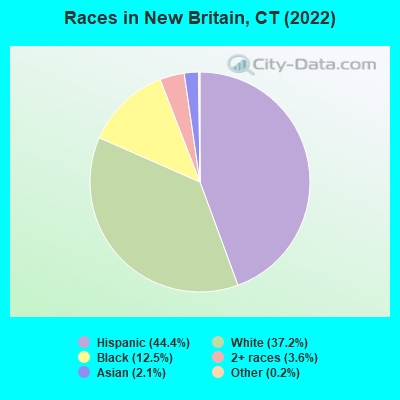
According to 2022 data, the most numerous races in New Britain, CT are White alone (27,708 residents), Hispanic (33,004 residents), and Black alone (9,304 residents). 54.2% of New Britain residents speak English at home. 20.2% of New Britain, CT residents are foreign-born (8.0% born in Europe, 7.1% born in Latin America, 2.3% born in Asia), which is 25.8% greater than the foreign-born rate of 15.0% across the entire state of Connecticut.
Race distribution in New Britain
2000 2022
42,083 58.8% White alone 19,138 26.8% Hispanic 6,965 9.7% Black alone 1,636 2.3% Asian alone 1,471 2.1% Two or more races 122 0.2% Other race alone 106 0.1% American Indian alone 17 0.02% Native Hawaiian and Other
33,004 44.4% Hispanic 27,708 37.2% White alone 9,304 12.5% Black alone 2,685 3.6% Two or more races 1,535 2.1% Asian alone 153 0.2% Other race alone 19 0.03% American Indian alone
2000 2022
2,638,845 77.5% White alone 320,323 9.4% Hispanic 295,571 8.7% Black alone 81,564 2.4% Asian alone 52,896 1.6% Two or more races 8,141 0.2% Other race alone 7,267 0.2% American Indian alone 958 0.03% Native Hawaiian and Other
2,246,913 62.0% White alone 658,978 18.2% Hispanic 353,973 9.8% Black alone 172,929 4.8% Asian alone 159,631 4.4% Two or more races 29,761 0.8% Other race alone 3,428 0.09% American Indian alone 592 0.02% Native Hawaiian and Other
Income and house value in New Britain Median household income in 2022 $46,335 White non-Hispanic householders$68,644 Black householders$29,443 Asian householders$55,040 Some other race householders$49,213 Two or more races householders$51,667 Hispanic or Latino race householdersMedian 2022 house value $220,973 White Non-Hispanic householders$206,695 Black or African American householders$303,243 American Indian or Alaska Native householders $272,647 Asian householders$211,681 Some other race householders$202,388 Two or more races householders$213,494 Hispanic or Latino householders
Median age by race in New Britain
40.8 Median age for White residents39.0 42.4 35.5 Median age for Black or African American residents41.1 29.0 37.7 Median age for American Indian / Alaska Native residents35.5 35.9 35.8 Median age for Asian residents28.6 38.0 -666,666,666.0 Median age for Native Hawaiian / Pacific Islander residents-666,666,666.0 -666,666,666.0 33.5 Median age for Other race residents34.3 33.1 29.0 Median age for Two or more races residents26.5 30.4 50.8 Median age for White alone residents47.9 52.8 30.2 Median age for Hispanic or Latino residents31.3 29.5
Owner/renter occupied households by race in New Britain
House owners and renters - White residents 7,925 48.0% Owner occupied8,570 52.0% Renter occupiedHouse owners and renters - Black or African American residents 2,161 42.9% Owner occupied2,880 57.1% Renter occupiedHouse owners and renters - American Indian / Alaska Native residents 50 31.4% Owner occupied110 68.6% Renter occupiedHouse owners and renters - Asian residents 334 42.0% Owner occupied461 58.0% Renter occupiedHouse owners and renters - Native Hawaiian / Pacific Islander residents 27 100.0% Renter occupiedHouse owners and renters - Other race residents 1,362 27.5% Owner occupied3,594 72.5% Renter occupiedHouse owners and renters - Two or more races residents 1,062 36.4% Owner occupied1,856 63.6% Renter occupiedHouse owners and renters - White alone residents 7,023 52.4% Owner occupied6,392 47.6% Renter occupiedHouse owners and renters - Hispanic or Latino residents 3,607 30.8% Owner occupied8,107 69.2% Renter occupied
Language usage in New Britain
English speakers - Total 54.2% of residents of New Britain speak English at home.
33.0% of residents speak Spanish at home 13,424 57.5% Speak English very well9,905 42.5% Speak English less than very well12.8% of residents speak other language at home 5,163 56.8% Speak English very well3,921 43.2% Speak English less than very well
English speakers - Born in the United States 74.1% of residents of New Britain speak English at home.
20.7% of residents speak Spanish at home 2,409 95.4% Speak English very well117 4.6% Speak English less than very well5.2% of residents speak other language at home 631 100.0% Speak English very well
English speakers - Native, born elsewhere 14.2% of residents of New Britain speak English at home.
79.0% of residents speak Spanish at home 4,667 50.3% Speak English very well4,614 49.7% Speak English less than very well6.8% of residents speak other language at home 717 89.7% Speak English very well82 10.3% Speak English less than very well
English speakers - Foreign-born 20.6% of residents of New Britain speak English at home.
36.6% of residents speak Spanish at home 918 16.9% Speak English very well4,524 83.1% Speak English less than very well42.8% of residents speak other language at home 2,527 39.7% Speak English very well3,839 60.3% Speak English less than very well
White (Caucasian) - Speak only English Native:
73.7% (21,895)Foreign-born:
16.4% (1,192)
White (Caucasian) - Speak another language Native:
26.3% (7,813)Foreign-born:
83.6% (6,060)
Black or African American - Speak only English Native:
89.0% (7,797)Foreign-born:
47.8% (1,590)
Black or African American - Speak another language Native:
11.0% (963)Foreign-born:
52.2% (1,733)
American Indian / Alaska Native - Speak another language Native:
100.0% (289)Foreign-born:
92.6% (172)
Asian - Speak only English Native:
32.1% (230)Foreign-born:
7.9% (90)
Asian - Speak another language Native:
66.8% (478)Foreign-born:
92.6% (1,057)
Other race - Speak only English Native:
29.6% (2,974)Foreign-born:
6.9% (143)
Other race - Speak another language Native:
70.4% (7,071)Foreign-born:
93.1% (1,929)
Two or more races - Speak another language Native:
68.0% (4,416)Foreign-born:
100.0% (1,134)
White alone - Speak only English Native:
88.5% (19,207)Foreign-born:
16.9% (908)
White alone - Speak another language Native:
11.5% (2,491)Foreign-born:
83.1% (4,474)
Hispanic or Latino - Speak only English Native:
30.7% (7,851)Foreign-born:
6.5% (370)
Hispanic or Latino - Speak another language Native:
69.3% (17,731)Foreign-born:
93.5% (5,280)
Foreign-born residents in New Britain 15,072 residents are foreign born (8.0% Europe , 7.1% Latin America , 2.3% Asia ).
This city:
20.2%Connecticut:
15.0%
Marital status for residents in New Britain Marital status - White (Caucasian) population 15 years and over
Males 48.6% Never married32.7% Now married3.8% Separated1.5% Widowed13.4% DivorcedFemales 41.0% Never married33.0% Now married2.0% Separated9.9% Widowed14.2% DivorcedWomen who gave birth in the past 12 months Now married:
81.7% (334)Unmarried:
18.3% (75)
Women who did not give birth in the past 12 months Now married:
28.4% (2,338)Unmarried:
71.6% (5,908)
Marital status - Black or African American population 15 years and over
Males 63.5% Never married19.6% Now married5.8% Separated0.0% Widowed11.0% DivorcedFemales 66.3% Never married20.4% Now married0.0% Separated3.2% Widowed10.1% DivorcedWomen who gave birth in the past 12 months Now married:
0.0% (0)Unmarried:
100.0% (90)
Women who did not give birth in the past 12 months Now married:
17.6% (487)Unmarried:
82.4% (2,275)
Marital status - American Indian / Alaska Native population 15 years and over
Males 22.0% Never married58.3% Now married9.6% Separated0.0% Widowed10.1% DivorcedFemales 28.3% Never married43.4% Now married0.0% Separated0.0% Widowed28.3% DivorcedWomen who did not give birth in the past 12 months Now married:
60.6% (63)Unmarried:
39.4% (41)
Marital status - Asian population 15 years and over
Males 43.9% Never married55.0% Now married1.1% Separated0.0% Widowed0.0% DivorcedFemales 22.3% Never married75.3% Now married0.0% Separated1.4% Widowed1.0% DivorcedWomen who gave birth in the past 12 months Now married:
100.0% (21)Unmarried:
0.0% (0)
Women who did not give birth in the past 12 months Now married:
75.6% (280)Unmarried:
24.4% (90)
Marital status - Other race population 15 years and over
Males 42.1% Never married45.5% Now married0.0% Separated0.4% Widowed12.0% DivorcedFemales 50.1% Never married30.1% Now married1.4% Separated2.3% Widowed16.1% DivorcedWomen who gave birth in the past 12 months Now married:
56.6% (159)Unmarried:
43.4% (122)
Women who did not give birth in the past 12 months Now married:
19.3% (642)Unmarried:
80.7% (2,680)
Marital status - Two or more races population 15 years and over
Males 64.4% Never married21.4% Now married5.9% Separated0.0% Widowed8.4% DivorcedFemales 51.8% Never married26.5% Now married1.3% Separated14.2% Widowed6.1% DivorcedWomen who gave birth in the past 12 months Now married:
15.5% (14)Unmarried:
84.5% (75)
Women who did not give birth in the past 12 months Now married:
26.0% (928)Unmarried:
74.0% (2,647)
Marital status - White alone, not Hispanic / Latino population 15 years and over
Males 48.4% Never married33.2% Now married1.1% Separated2.0% Widowed15.3% DivorcedFemales 34.1% Never married35.2% Now married1.3% Separated12.6% Widowed16.8% DivorcedWomen who gave birth in the past 12 months Now married:
100.0% (263)Unmarried:
0.0% (0)
Women who did not give birth in the past 12 months Now married:
29.8% (1,521)Unmarried:
70.2% (3,589)
Marital status - Hispanic or Latino population 15 years and over
Males 54.1% Never married29.4% Now married6.0% Separated0.1% Widowed10.3% DivorcedFemales 58.0% Never married23.6% Now married2.2% Separated5.4% Widowed10.8% DivorcedWomen who gave birth in the past 12 months Now married:
23.4% (230)Unmarried:
76.6% (755)
Women who did not give birth in the past 12 months Now married:
20.2% (1,729)Unmarried:
79.8% (6,821)
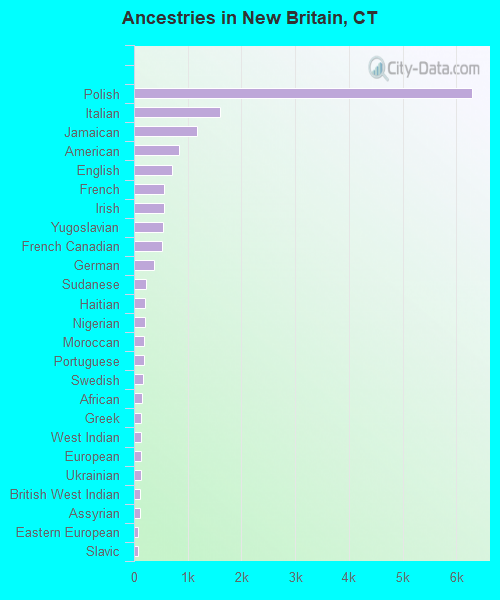
Ancestries in New Britain
6,295 13.9% Polish1,598 3.5% Italian1,171 2.6% Jamaican842 1.9% American705 1.6% English562 1.2% French551 1.2% Irish536 1.2% Yugoslavian522 1.2% French Canadian374 0.8% German220 0.5% Sudanese204 0.5% Haitian200 0.4% Nigerian186 0.4% Moroccan184 0.4% Portuguese163 0.4% Swedish154 0.3% African138 0.3% Greek138 0.3% West Indian137 0.3% European136 0.3% Ukrainian110 0.2% British West Indian103 0.2% Assyrian82 0.2% Eastern European78 0.2% Slavic69 0.2% Lithuanian64 0.1% Romanian53 0.1% Canadian51 0.1% Scottish50 0.1% Scotch-Irish46 0.1% Iranian43 0.10% Hungarian41 0.09% Ghanaian35 0.08% Scandinavian33 0.07% Egyptian33 0.07% Cape Verdean28 0.06% Cajun24 0.05% Northern European22 0.05% British21 0.05% Russian21 0.05% Brazilian20 0.04% Austrian17 0.04% Trinidadian and Tobagonian16 0.04% Guyanese14 0.03% Danish13 0.03% Arab12 0.03% Latvian11 0.02% Dutch11 0.02% Croatian8 0.02% Kenyan8 0.02% Slovak5 0.01% Celtic5 0.01% Lebanese5 0.01% Barbadian
Geographical mobility in New Britain Same house 1 year ago 34,169 89.9% White (Caucasian)10,945 87.4% Black or African American319 63.1% American Indian / Alaska Native1,870 93.7% Asian11,702 90.2% Other race11,871 86.6% Two or more races25,248 92.2% White alone, not Hispanic / Latino27,116 83.7% Hispanic or LatinoMoved within same county 1,395 3.7% White / Caucasian771 6.2% Black or African American86 17.1% American Indian / Alaska Native48 2.4% Asian24 94.6% Native Hawaiian / Pacific Islander795 6.1% Other race1,124 8.2% Two or more races1,188 4.3% White alone, not Hispanic / Latino2,637 8.1% Hispanic or LatinoMoved within same state 535 1.4% White / Caucasian22 0.2% Black or African American48 9.5% American Indian / Alaska Native70 0.5% Other race180 1.3% Two or more races535 2.0% White alone, not Hispanic / Latino114 0.4% Hispanic or LatinoMoved from different state 522 1.4% White / Caucasian632 5.0% Black or African American2 0.4% American Indian / Alaska Native20 1.0% Asian316 2.4% Other race56 0.4% Two or more races423 1.5% White alone, not Hispanic / Latino678 2.1% Hispanic or LatinoMoved from abroad 1,398 3.7% White148 1.2% Black or African American41 2.0% Asian138 1.1% Other race333 2.4% Two or more races1,852 5.7% Hispanic or Latino
Children Nativity (place of birth) in New Britain
Children under 6 years - Living with two parents Both parents native 1,230 100.0% NativeBoth parents foreign-born 519 77.0% Native155 23.0% Foreign-bornOne native, one foreign-born parent 93 100.0% NativeChildren under 6 years - Living with one parent Native parent 3,122 100.0% NativeForeign-born parent 183 92.4% Native15 7.6% Foreign-bornChildren 6 to 17 years - Living with two parents Both parents native 2,117 100.0% NativeBoth parents foreign-born 1,413 81.1% Native329 18.9% Foreign-bornOne native, one foreign-born parent 506 95.0% Native27 5.0% Foreign-bornChildren 6 to 17 years - Living with one parent Native parent 5,315 100.0% NativeForeign-born parent 995 54.1% Native844 45.9% Foreign-born
Place of birth for residents in New Britain 6,195 Europe5,771 Americas5,643 Eastern Europe5,551 Latin America2,481 Caribbean2,073 South America1,784 Asia1,320 Africa996 Central America771 South Central Asia624 Middle Africa394 South Eastern Asia357 Northern Africa320 Western Asia304 Southern Europe298 Eastern Asia219 Northern America211 China200 Western Europe196 Western Africa46 Northern Europe18 Eastern Africa8 Southern Africa5,033 Poland1,297 Dominican Republic792 Jamaica729 Peru724 Ecuador699 Mexico615 Cameroon527 India436 Colombia341 Bosnia and Herzegovina220 Yemen219 Canada200 Haiti185 China169 Honduras169 Morocco166 Vietnam161 Sudan148 Italy148 Nigeria127 Germany123 Laos111 Ukraine111 Portugal102 Guatemala98 Romania96 Trinidad and Tobago92 Bangladesh83 Venezuela76 Philippines65 Korea64 Sri Lanka56 Grenada56 France55 Iran46 England38 Iraq31 Argentina31 Pakistan28 Brazil28 Thailand27 Egypt27 Russia26 Taiwan26 Spain25 El Salvador21 Saudi Arabia21 Ghana20 Japan17 Israel17 Greece13 Lithuania13 Chile11 Cuba11 St. Lucia11 Guyana9 Belgium9 Syria9 Kenya9 Tanzania9 Latvia8 South Africa8 Czechoslovakia7 Barbados7 Austria6 Lebanon5 Jordan
Grandparents responsible for own grandchildren in New Britain
Grandparents (30 to 59 years) White / Caucasian 94 31.9% Responsible for grandchildren201 68.1% Not responsible for grandchildrenBlack or African American 5 21.0% Responsible for grandchildren21 79.0% Not responsible for grandchildrenAsian 11 100.0% Not responsible for grandchildrenOther race 100 56.1% Responsible for grandchildren78 43.9% Not responsible for grandchildrenTwo or more races 414 94.5% Responsible for grandchildren24 5.5% Not responsible for grandchildrenWhite alone, not Hispanic / Latino 50 30.5% Responsible for grandchildren115 69.5% Not responsible for grandchildrenHispanic or Latino 326 61.2% Responsible for grandchildren207 38.8% Not responsible for grandchildrenGrandparents (60 years and over) White / Caucasian 52 15.7% Responsible for grandchildren282 84.3% Not responsible for grandchildrenBlack or African American 81 72.2% Responsible for grandchildren31 27.8% Not responsible for grandchildrenAsian 89 100.0% Not responsible for grandchildrenOther race 110 100.0% Not responsible for grandchildrenTwo or more races 66 29.8% Responsible for grandchildren156 70.2% Not responsible for grandchildrenWhite alone, not Hispanic / Latino 46 14.9% Responsible for grandchildren262 85.1% Not responsible for grandchildrenHispanic or Latino 45 15.1% Responsible for grandchildren251 84.9% Not responsible for grandchildren