Races in Myrtle Grove, Florida (FL) Detailed Stats
Data:
Races - White alone (%)
Races - White alone (% change since 2000)
Races - Black alone (%)
Races - Black alone (% change since 2000)
Races - American Indian alone (%)
Races - American Indian alone (% change since 2000)
Races - Asian alone (%)
Races - Asian alone (% change since 2000)
Races - Hispanic (%)
Races - Hispanic (% change since 2000)
Races - Native Hawaiian and Other Pacific Islander alone (%)
Races - Native Hawaiian and Other Pacific Islander alone (% change since 2000)
Races - Two or more races(%)
Races - Two or more races(% change since 2000)
Races - Other race alone (%)
Races - Other race alone (% change since 2000)
Racial diversity
Place of birth - Born in state of residence (%)
Place of birth - Born in state of residence (%) - White
Place of birth - Born in state of residence (%) - Black or African American
Place of birth - Born in state of residence (%) - Asian
Place of birth - Born in state of residence (%) - Hispanic or Latino
Place of birth - Born in state of residence (%) - American Indian and Alaska Native
Place of birth - Born in state of residence (%) - Multirace
Place of birth - Born in state of residence (%) - Other Race
Place of birth - Born in other state (%)
Place of birth - Born in other state (%) - White
Place of birth - Born in other state (%) - Black or African American
Place of birth - Born in other state (%) - Asian
Place of birth - Born in other state (%) - Hispanic or Latino
Place of birth - Born in other state (%) - American Indian and Alaska Native
Place of birth - Born in other state (%) - Multirace
Place of birth - Born in other state (%) - Other Race
Place of birth - Native, outside of US (%)
Place of birth - Native, outside of US (%) - White
Place of birth - Native, outside of US (%) - Black or African American
Place of birth - Native, outside of US (%) - Asian
Place of birth - Native, outside of US (%) - Hispanic or Latino
Place of birth - Native, outside of US (%) - American Indian and Alaska Native
Place of birth - Native, outside of US (%) - Multirace
Place of birth - Native, outside of US (%) - Other Race
Place of birth - Foreign born (%)
Place of birth - Foreign born (%) - White
Place of birth - Foreign born (%) - Black or African American
Place of birth - Foreign born (%) - Asian
Place of birth - Foreign born (%) - Hispanic or Latino
Place of birth - Foreign born (%) - American Indian and Alaska Native
Place of birth - Foreign born (%) - Multirace
Place of birth - Foreign born (%) - Other Race
Residents speaking English at home (%)
Residents speaking English at home - Born in the United States (%)
Residents speaking English at home - Native, born elsewhere (%)
Residents speaking English at home - Foreign born (%)
Residents speaking Spanish at home (%)
Residents speaking Spanish at home - Born in the United States (%)
Residents speaking Spanish at home - Native, born elsewhere (%)
Residents speaking Spanish at home - Foreign born (%)
Residents speaking other language at home (%)
Residents speaking other language at home - Born in the United States (%)
Residents speaking other language at home - Native, born elsewhere (%)
Residents speaking other language at home - Foreign born (%)
Marital status - Never married (%)
Marital status - Now married (%)
Marital status - Separated (%)
Marital status - Widowed (%)
Marital status - Divorced (%)
Ancestries Reported - Arab (%)
Ancestries Reported - Czech (%)
Ancestries Reported - Danish (%)
Ancestries Reported - Dutch (%)
Ancestries Reported - English (%)
Ancestries Reported - French (%)
Ancestries Reported - French Canadian (%)
Ancestries Reported - German (%)
Ancestries Reported - Greek (%)
Ancestries Reported - Hungarian (%)
Ancestries Reported - Irish (%)
Ancestries Reported - Italian (%)
Ancestries Reported - Lithuanian (%)
Ancestries Reported - Norwegian (%)
Ancestries Reported - Polish (%)
Ancestries Reported - Portuguese (%)
Ancestries Reported - Russian (%)
Ancestries Reported - Scotch-Irish (%)
Ancestries Reported - Scottish (%)
Ancestries Reported - Slovak (%)
Ancestries Reported - Subsaharan African (%)
Ancestries Reported - Swedish (%)
Ancestries Reported - Swiss (%)
Ancestries Reported - Ukrainian (%)
Ancestries Reported - United States (%)
Ancestries Reported - Welsh (%)
Ancestries Reported - West Indian (%)
Ancestries Reported - Other (%)
Geographical mobility - Same house 1 year ago (%)
Geographical mobility - Same house 1 year ago (%) - White
Geographical mobility - Same house 1 year ago (%) - Black or African American
Geographical mobility - Same house 1 year ago (%) - Asian
Geographical mobility - Same house 1 year ago (%) - Hispanic or Latino
Geographical mobility - Same house 1 year ago (%) - American Indian and Alaska Native
Geographical mobility - Same house 1 year ago (%) - Multirace
Geographical mobility - Same house 1 year ago (%) - Other Race
Geographical mobility - Moved within same county (%)
Geographical mobility - Moved within same county (%) - White
Geographical mobility - Moved within same county (%) - Black or African American
Geographical mobility - Moved within same county (%) - Asian
Geographical mobility - Moved within same county (%) - Hispanic or Latino
Geographical mobility - Moved within same county (%) - American Indian and Alaska Native
Geographical mobility - Moved within same county (%) - Multirace
Geographical mobility - Moved within same county (%) - Other Race
Geographical mobility - Moved from different county within same state (%)
Geographical mobility - Moved from different county within same state (%) - White
Geographical mobility - Moved from different county within same state (%) - Black or African American
Geographical mobility - Moved from different county within same state (%) - Asian
Geographical mobility - Moved from different county within same state (%) - Hispanic or Latino
Geographical mobility - Moved from different county within same state (%) - American Indian and Alaska Native
Geographical mobility - Moved from different county within same state (%) - Multirace
Geographical mobility - Moved from different county within same state (%) - Other Race
Geographical mobility - Moved from different state (%)
Geographical mobility - Moved from different state (%) - White
Geographical mobility - Moved from different state (%) - Black or African American
Geographical mobility - Moved from different state (%) - Asian
Geographical mobility - Moved from different state (%) - Hispanic or Latino
Geographical mobility - Moved from different state (%) - American Indian and Alaska Native
Geographical mobility - Moved from different state (%) - Multirace
Geographical mobility - Moved from different state (%) - Other Race
Geographical mobility - Moved from abroad (%)
Geographical mobility - Moved from abroad (%) - White
Geographical mobility - Moved from abroad (%) - Black or African American
Geographical mobility - Moved from abroad (%) - Asian
Geographical mobility - Moved from abroad (%) - Hispanic or Latino
Geographical mobility - Moved from abroad (%) - American Indian and Alaska Native
Geographical mobility - Moved from abroad (%) - Multirace
Geographical mobility - Moved from abroad (%) - Other Race
Place of birth for the foreign-born population - Ireland (%)
Place of birth for the foreign-born population - Denmark (%)
Place of birth for the foreign-born population - Norway (%)
Place of birth for the foreign-born population - Sweden (%)
Place of birth for the foreign-born population - United Kingdom (%)
Place of birth for the foreign-born population - England (%)
Place of birth for the foreign-born population - Scotland (%)
Place of birth for the foreign-born population - Other Northern Europe (%)
Place of birth for the foreign-born population - Austria (%)
Place of birth for the foreign-born population - Belgium (%)
Place of birth for the foreign-born population - France (%)
Place of birth for the foreign-born population - Germany (%)
Place of birth for the foreign-born population - Netherlands (%)
Place of birth for the foreign-born population - Switzerland (%)
Place of birth for the foreign-born population - Other Western Europe (%)
Place of birth for the foreign-born population - Greece (%)
Place of birth for the foreign-born population - Italy (%)
Place of birth for the foreign-born population - Portugal (%)
Place of birth for the foreign-born population - Spain (%)
Place of birth for the foreign-born population - Other Southern Europe (%)
Place of birth for the foreign-born population - Albania (%)
Place of birth for the foreign-born population - Belarus (%)
Place of birth for the foreign-born population - Bosnia and Herzegovina (%)
Place of birth for the foreign-born population - Bulgaria (%)
Place of birth for the foreign-born population - Croatia (%)
Place of birth for the foreign-born population - Czechoslovakia (%)
Place of birth for the foreign-born population - Hungary (%)
Place of birth for the foreign-born population - Latvia (%)
Place of birth for the foreign-born population - Lithuania (%)
Place of birth for the foreign-born population - North Macedonia (Macedonia) (%)
Place of birth for the foreign-born population - Moldova (%)
Place of birth for the foreign-born population - Poland (%)
Place of birth for the foreign-born population - Romania (%)
Place of birth for the foreign-born population - Russia (%)
Place of birth for the foreign-born population - Serbia (%)
Place of birth for the foreign-born population - Ukraine (%)
Place of birth for the foreign-born population - Other Eastern Europe (%)
Place of birth for the foreign-born population - China (%)
Place of birth for the foreign-born population - Hong Kong (%)
Place of birth for the foreign-born population - Taiwan (%)
Place of birth for the foreign-born population - Japan (%)
Place of birth for the foreign-born population - Korea (%)
Place of birth for the foreign-born population - Other Eastern Asia (%)
Place of birth for the foreign-born population - Afghanistan (%)
Place of birth for the foreign-born population - Bangladesh (%)
Place of birth for the foreign-born population - India (%)
Place of birth for the foreign-born population - Iran (%)
Place of birth for the foreign-born population - Kazakhstan (%)
Place of birth for the foreign-born population - Nepal (%)
Place of birth for the foreign-born population - Pakistan (%)
Place of birth for the foreign-born population - Sri Lanka (%)
Place of birth for the foreign-born population - Uzbekistan (%)
Place of birth for the foreign-born population - Other South Central Asia (%)
Place of birth for the foreign-born population - Burma (%)
Place of birth for the foreign-born population - Cambodia (%)
Place of birth for the foreign-born population - Indonesia (%)
Place of birth for the foreign-born population - Laos (%)
Place of birth for the foreign-born population - Malaysia (%)
Place of birth for the foreign-born population - Philippines (%)
Place of birth for the foreign-born population - Singapore (%)
Place of birth for the foreign-born population - Thailand (%)
Place of birth for the foreign-born population - Vietnam (%)
Place of birth for the foreign-born population - Other South Eastern Asia (%)
Place of birth for the foreign-born population - Armenia (%)
Place of birth for the foreign-born population - Iraq (%)
Place of birth for the foreign-born population - Israel (%)
Place of birth for the foreign-born population - Jordan (%)
Place of birth for the foreign-born population - Kuwait (%)
Place of birth for the foreign-born population - Lebanon (%)
Place of birth for the foreign-born population - Saudi Arabia (%)
Place of birth for the foreign-born population - Syria (%)
Place of birth for the foreign-born population - Turkey (%)
Place of birth for the foreign-born population - Yemen (%)
Place of birth for the foreign-born population - Other Western Asia (%)
Place of birth for the foreign-born population - Eritrea (%)
Place of birth for the foreign-born population - Ethiopia (%)
Place of birth for the foreign-born population - Kenya (%)
Place of birth for the foreign-born population - Somalia (%)
Place of birth for the foreign-born population - Uganda (%)
Place of birth for the foreign-born population - Zimbabwe (%)
Place of birth for the foreign-born population - Other Eastern Africa (%)
Place of birth for the foreign-born population - Cameroon (%)
Place of birth for the foreign-born population - Congo (%)
Place of birth for the foreign-born population - Democratic Republic of Congo (Zaire) (%)
Place of birth for the foreign-born population - Other Middle Africa (%)
Place of birth for the foreign-born population - Egypt (%)
Place of birth for the foreign-born population - Morocco (%)
Place of birth for the foreign-born population - Sudan (%)
Place of birth for the foreign-born population - Other Northern Africa (%)
Place of birth for the foreign-born population - South Africa (%)
Place of birth for the foreign-born population - Other Southern Africa (%)
Place of birth for the foreign-born population - Cabo Verde (%)
Place of birth for the foreign-born population - Ghana (%)
Place of birth for the foreign-born population - Liberia (%)
Place of birth for the foreign-born population - Nigeria (%)
Place of birth for the foreign-born population - Senegal (%)
Place of birth for the foreign-born population - Sierra Leone (%)
Place of birth for the foreign-born population - Other Western Africa (%)
Place of birth for the foreign-born population - Australia (%)
Place of birth for the foreign-born population - New Zealand (%)
Place of birth for the foreign-born population - Fiji (%)
Place of birth for the foreign-born population - Micronesia (%)
Place of birth for the foreign-born population - Bahamas (%)
Place of birth for the foreign-born population - Barbados (%)
Place of birth for the foreign-born population - Cuba (%)
Place of birth for the foreign-born population - Dominica (%)
Place of birth for the foreign-born population - Dominican Republic (%)
Place of birth for the foreign-born population - Grenada (%)
Place of birth for the foreign-born population - Haiti (%)
Place of birth for the foreign-born population - Jamaica (%)
Place of birth for the foreign-born population - St. Vincent and the Grenadines (%)
Place of birth for the foreign-born population - Trinidad and Tobago (%)
Place of birth for the foreign-born population - West Indies (%)
Place of birth for the foreign-born population - Other Caribbean (%)
Place of birth for the foreign-born population - Belize (%)
Place of birth for the foreign-born population - Costa Rica (%)
Place of birth for the foreign-born population - El Salvador (%)
Place of birth for the foreign-born population - Guatemala (%)
Place of birth for the foreign-born population - Honduras (%)
Place of birth for the foreign-born population - Mexico (%)
Place of birth for the foreign-born population - Nicaragua (%)
Place of birth for the foreign-born population - Panama (%)
Place of birth for the foreign-born population - Other Central America (%)
Place of birth for the foreign-born population - Argentina (%)
Place of birth for the foreign-born population - Bolivia (%)
Place of birth for the foreign-born population - Brazil (%)
Place of birth for the foreign-born population - Chile (%)
Place of birth for the foreign-born population - Colombia (%)
Place of birth for the foreign-born population - Ecuador (%)
Place of birth for the foreign-born population - Guyana (%)
Place of birth for the foreign-born population - Peru (%)
Place of birth for the foreign-born population - Uruguay (%)
Place of birth for the foreign-born population - Venezuela (%)
Place of birth for the foreign-born population - Other South America (%)
Place of birth for the foreign-born population - Canada (%)
Place of birth for the foreign-born population - Other Northern America (%)
Place of birth for the foreign-born population - Other (%)
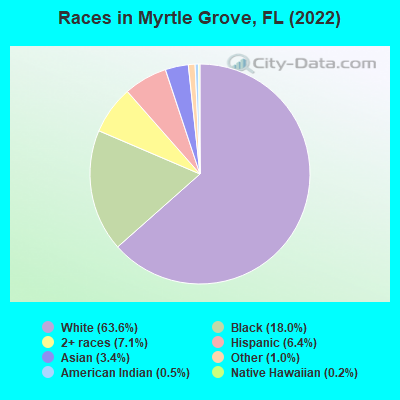
According to 2022 data, the most numerous races in Myrtle Grove, FL are White alone (10,890 residents), Hispanic (1,089 residents), and Black alone (3,092 residents). 90.9% of Myrtle Grove residents speak English at home. 6.6% of Myrtle Grove, FL residents are foreign-born (2.8% born in Asia, 2.3% born in Latin America), which is 215.9% less than the foreign-born rate of 21.0% across the entire state of Florida.
Race distribution in Myrtle Grove
2000 2022
10,458,509 65.4% White alone 2,682,715 16.8% Hispanic 2,264,268 14.2% Black alone 261,693 1.6% Asian alone 236,954 1.5% Two or more races 42,358 0.3% American Indian alone 28,994 0.2% Other race alone 6,887 0.04% Native Hawaiian and Other
11,309,403 50.8% White alone 6,025,039 27.1% Hispanic 3,241,015 14.6% Black alone 861,630 3.9% Two or more races 623,692 2.8% Asian alone 152,054 0.7% Other race alone 22,504 0.1% American Indian alone 9,486 0.04% Native Hawaiian and Other
Income and house value in Myrtle Grove Median household income in 2022 $65,602 White non-Hispanic householders$37,961 Black householders$45,591 Asian householders$132,024 Some other race householders$46,009 Two or more races householders$84,661 Hispanic or Latino race householdersMedian 2022 house value $209,974 White Non-Hispanic householders$196,257 Black or African American householders$106,833 American Indian or Alaska Native householders $205,490 Asian householders$197,840 Native Hawaiian and other Pacific Islander householders$428,654 Some other race householders$215,778 Two or more races householders$231,077 Hispanic or Latino householders
Median age by race in Myrtle Grove
34.8 Median age for White residents31.0 41.8 29.5 Median age for Black or African American residents29.8 27.2 42.0 Median age for American Indian / Alaska Native residents25.9 -792,899,407.5 48.9 Median age for Asian residents22.5 60.7 -679,849,340.2 Median age for Native Hawaiian / Pacific Islander residents-858,307,848.3 -443,298,968.6 37.1 Median age for Other race residents31.4 39.3 25.5 Median age for Two or more races residents29.6 22.2 36.0 Median age for White alone residents31.5 42.1 23.6 Median age for Hispanic or Latino residents23.0 28.2
Owner/renter occupied households by race in Myrtle Grove
House owners and renters - White residents 3,170 69.6% Owner occupied1,384 30.4% Renter occupiedHouse owners and renters - Black or African American residents 301 22.2% Owner occupied1,056 77.8% Renter occupiedHouse owners and renters - American Indian / Alaska Native residents 10 100.0% Renter occupiedHouse owners and renters - Asian residents 64 38.0% Owner occupied104 62.0% Renter occupiedHouse owners and renters - Other race residents 127 53.2% Owner occupied112 46.8% Renter occupiedHouse owners and renters - Two or more races residents 125 26.1% Owner occupied355 73.9% Renter occupiedHouse owners and renters - White alone residents 3,174 70.3% Owner occupied1,344 29.7% Renter occupiedHouse owners and renters - Hispanic or Latino residents 168 52.4% Owner occupied153 47.6% Renter occupied
Language usage in Myrtle Grove
English speakers - Total 90.9% of residents of Myrtle Grove speak English at home.
3.2% of residents speak Spanish at home 448 86.5% Speak English very well70 13.5% Speak English less than very well5.7% of residents speak other language at home 641 69.0% Speak English very well288 31.0% Speak English less than very well
English speakers - Born in the United States 93.1% of residents of Myrtle Grove speak English at home.
4.2% of residents speak Spanish at home 289 79.8% Speak English very well73 20.2% Speak English less than very well3.2% of residents speak other language at home 221 81.0% Speak English very well52 19.0% Speak English less than very well
English speakers - Native, born elsewhere 76.8% of residents of Myrtle Grove speak English at home.
20.3% of residents speak Spanish at home 87 94.6% Speak English very well5 5.4% Speak English less than very well6.8% of residents speak other language at home 31 100.0% Speak English very well
English speakers - Foreign-born 32.5% of residents of Myrtle Grove speak English at home.
9.5% of residents speak Spanish at home 81 77.1% Speak English very well24 22.9% Speak English less than very well55.3% of residents speak other language at home 344 56.4% Speak English very well266 43.6% Speak English less than very well
White (Caucasian) - Speak only English Native:
95.7% (9,943)Foreign-born:
50.9% (117)
White (Caucasian) - Speak another language Native:
4.6% (477)Foreign-born:
49.7% (114)
Black or African American - Speak only English Native:
100.0% (2,804)Foreign-born:
53.3% (138)
American Indian / Alaska Native - Speak only English Native:
77.0% (55)Foreign-born:
61.4% (22)
Asian - Speak only English Native:
74.9% (180)Foreign-born:
1.1% (3)
Asian - Speak another language Native:
24.3% (58)Foreign-born:
99.1% (308)
Other race - Speak only English Native:
100.0% (262)Foreign-born:
28.8% (72)
Other race - Speak another language Native:
7.4% (19)Foreign-born:
41.0% (103)
Two or more races - Speak only English Native:
82.8% (1,202)Foreign-born:
27.9% (29)
Two or more races - Speak another language Native:
16.5% (239)Foreign-born:
71.8% (74)
White alone - Speak only English Native:
96.5% (9,875)Foreign-born:
51.2% (119)
White alone - Speak another language Native:
4.0% (406)Foreign-born:
47.5% (111)
Hispanic or Latino - Speak only English Native:
56.8% (416)Foreign-born:
47.5% (82)
Hispanic or Latino - Speak another language Native:
42.0% (308)Foreign-born:
49.4% (85)
Foreign-born residents in Myrtle Grove 1,139 residents are foreign born (2.8% Asia , 2.3% Latin America ).
This city:
6.6%Florida:
21.1%
Marital status for residents in Myrtle Grove Marital status - White (Caucasian) population 15 years and over
Males 47.8% Never married40.2% Now married1.3% Separated1.8% Widowed9.0% DivorcedFemales 22.2% Never married45.4% Now married2.3% Separated10.6% Widowed19.5% DivorcedWomen who gave birth in the past 12 months Now married:
26.2% (27)Unmarried:
73.8% (77)
Women who did not give birth in the past 12 months Now married:
50.6% (1,218)Unmarried:
49.4% (1,189)
Marital status - Black or African American population 15 years and over
Males 54.5% Never married25.1% Now married11.7% Separated0.6% Widowed8.1% DivorcedFemales 46.1% Never married29.6% Now married2.8% Separated7.6% Widowed13.9% DivorcedWomen who gave birth in the past 12 months Now married:
0.0% (0)Unmarried:
100.0% (39)
Women who did not give birth in the past 12 months Now married:
24.7% (145)Unmarried:
75.3% (440)
Marital status - American Indian / Alaska Native population 15 years and over
Males 71.4% Never married28.6% Now married0.0% Separated0.0% Widowed0.0% DivorcedFemales 0.0% Never married100.0% Now married0.0% Separated0.0% Widowed0.0% DivorcedMarital status - Asian population 15 years and over
Males 50.3% Never married49.7% Now married0.0% Separated0.0% Widowed0.0% DivorcedFemales 1.6% Never married82.3% Now married0.0% Separated14.0% Widowed2.2% DivorcedWomen who gave birth in the past 12 months Now married:
100.0% (11)Unmarried:
0.0% (0)
Women who did not give birth in the past 12 months Now married:
90.6% (120)Unmarried:
9.4% (12)
Marital status - Other race population 15 years and over
Males 51.6% Never married24.7% Now married23.7% Separated0.0% Widowed0.0% DivorcedFemales 30.8% Never married34.8% Now married0.0% Separated34.4% Widowed0.0% DivorcedWomen who gave birth in the past 12 months Now married:
0.0% (0)Unmarried:
100.0% (29)
Women who did not give birth in the past 12 months Now married:
60.5% (126)Unmarried:
39.5% (82)
Marital status - Two or more races population 15 years and over
Males 53.6% Never married33.0% Now married0.0% Separated0.0% Widowed13.4% DivorcedFemales 48.8% Never married29.1% Now married3.0% Separated8.9% Widowed10.2% DivorcedWomen who did not give birth in the past 12 months Now married:
26.2% (127)Unmarried:
73.8% (359)
Marital status - White alone, not Hispanic / Latino population 15 years and over
Males 47.2% Never married40.5% Now married1.3% Separated1.8% Widowed9.2% DivorcedFemales 20.9% Never married46.2% Now married2.4% Separated10.9% Widowed19.6% DivorcedWomen who gave birth in the past 12 months Now married:
19.4% (19)Unmarried:
80.6% (79)
Women who did not give birth in the past 12 months Now married:
52.1% (1,229)Unmarried:
47.9% (1,130)
Marital status - Hispanic or Latino population 15 years and over
Males 57.0% Never married29.0% Now married6.2% Separated0.0% Widowed7.8% DivorcedFemales 48.8% Never married19.9% Now married0.0% Separated22.8% Widowed8.5% DivorcedWomen who gave birth in the past 12 months Now married:
33.3% (9)Unmarried:
66.7% (18)
Women who did not give birth in the past 12 months Now married:
22.5% (50)Unmarried:
77.5% (173)
Ancestries in Myrtle Grove
957 11.6% American723 8.7% Irish486 5.9% German391 4.7% English287 3.5% Italian129 1.6% Haitian99 1.2% Brazilian92 1.1% Scotch-Irish87 1.1% French87 1.1% African74 0.9% Scottish66 0.8% Jamaican54 0.7% British35 0.4% Welsh29 0.4% Czech28 0.3% Canadian27 0.3% Polish24 0.3% Norwegian24 0.3% Russian20 0.2% French Canadian19 0.2% Armenian18 0.2% European15 0.2% Celtic9 0.1% Lithuanian8 0.10% Belgian7 0.08% Austrian4 0.05% Bulgarian3 0.04% Turkish1 0.01% Guyanese
Geographical mobility in Myrtle Grove Same house 1 year ago 8,825 79.8% White (Caucasian)2,451 79.0% Black or African American98 88.9% American Indian / Alaska Native280 51.3% Asian383 72.6% Other race1,025 62.8% Two or more races8,769 81.1% White alone, not Hispanic / Latino505 48.1% Hispanic or LatinoMoved within same county 410 3.7% White / Caucasian263 8.5% Black or African American111 20.4% Asian42 7.9% Other race114 7.0% Two or more races418 3.9% White alone, not Hispanic / Latino35 3.4% Hispanic or LatinoMoved within same state 181 1.6% White / Caucasian216 7.0% Black or African American37 6.8% Asian109 20.7% Other race119 7.3% Two or more races180 1.7% White alone, not Hispanic / Latino50 4.8% Hispanic or LatinoMoved from different state 1,708 15.4% White / Caucasian182 5.9% Black or African American12 10.9% American Indian / Alaska Native134 24.5% Asian66 100.0% Native Hawaiian / Pacific Islander18 3.3% Other race251 15.4% Two or more races1,505 13.9% White alone, not Hispanic / Latino426 40.6% Hispanic or LatinoMoved from abroad 9 0.1% White14 2.7% Other race12 0.8% Two or more races12 0.1% White alone, not Hispanic / Latino21 2.0% Hispanic or Latino
Children Nativity (place of birth) in Myrtle Grove
Children under 6 years - Living with two parents Both parents native 556 100.0% NativeBoth parents foreign-born 82 100.0% NativeOne native, one foreign-born parent 95 100.0% NativeChildren under 6 years - Living with one parent Native parent 269 100.0% NativeForeign-born parent 34 100.0% NativeChildren 6 to 17 years - Living with two parents Both parents native 1,004 100.0% NativeBoth parents foreign-born 34 53.5% Native30 46.5% Foreign-bornOne native, one foreign-born parent 41 100.0% NativeChildren 6 to 17 years - Living with one parent Native parent 519 100.0% NativeForeign-born parent 29 50.6% Native28 49.4% Foreign-born
Grandparents responsible for own grandchildren in Myrtle Grove
Grandparents (30 to 59 years) White / Caucasian 75 100.0% Not responsible for grandchildrenBlack or African American 4 7.2% Responsible for grandchildren56 92.8% Not responsible for grandchildrenTwo or more races 54 100.0% Not responsible for grandchildrenWhite alone, not Hispanic / Latino 75 100.0% Not responsible for grandchildrenGrandparents (60 years and over) White / Caucasian 66 42.4% Responsible for grandchildren90 57.6% Not responsible for grandchildrenWhite alone, not Hispanic / Latino 68 43.1% Responsible for grandchildren90 56.9% Not responsible for grandchildren