Races in Myakka, Florida (FL) Detailed Stats
Ancestries, Foreign-born residents, place of birth
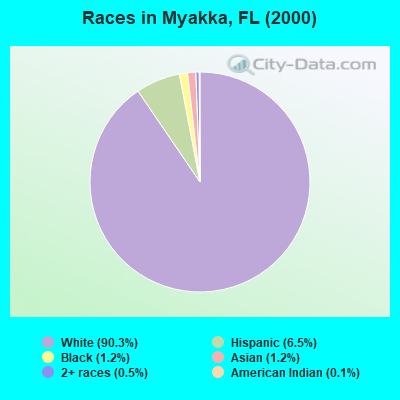
Race distribution in Myakka

- 17,43590.3%White alone
- 1,2616.5%Hispanic
- 2401.2%Black alone
- 2321.2%Asian alone
- 1050.5%Two or more races
- 260.1%American Indian alone
- 160.08%Other race alone
- 30.02%Native Hawaiian and Other
Pacific Islander alone
2000
2022
-
- 10,458,50965.4%White alone
- 2,682,71516.8%Hispanic
- 2,264,26814.2%Black alone
- 261,6931.6%Asian alone
- 236,9541.5%Two or more races
- 42,3580.3%American Indian alone
- 28,9940.2%Other race alone
- 6,8870.04%Native Hawaiian and Other
Pacific Islander alone

-
- 11,309,40350.8%White alone
- 6,025,03927.1%Hispanic
- 3,241,01514.6%Black alone
- 861,6303.9%Two or more races
- 623,6922.8%Asian alone
- 152,0540.7%Other race alone
- 22,5040.1%American Indian alone
- 9,4860.04%Native Hawaiian and Other
Pacific Islander alone

Income and house value in Myakka
- Median household income in 2022
- $130,279White non-Hispanic householders
- $113,522Black householders
- $96,056Asian householders
- $47,795Some other race householders
- $54,047Two or more races householders
- $105,413Hispanic or Latino race householders
- Median 2022 house value
- $804,695White Non-Hispanic householders
- $613,476Black or African American householders
- $576,145Asian householders
- $570,338Some other race householders
- $636,290Two or more races householders
- $692,702Hispanic or Latino householders
Household income for White non-Hispanic householders

Household income for Black householders

Household income for Asian householders

Household income for Two or more races householders

Household income for Hispanic or Latino race householders

Zip code: 34202