Races in Mustang, Oklahoma (OK) Detailed Stats
Data:
Races - White alone (%)
Races - White alone (% change since 2000)
Races - Black alone (%)
Races - Black alone (% change since 2000)
Races - American Indian alone (%)
Races - American Indian alone (% change since 2000)
Races - Asian alone (%)
Races - Asian alone (% change since 2000)
Races - Hispanic (%)
Races - Hispanic (% change since 2000)
Races - Native Hawaiian and Other Pacific Islander alone (%)
Races - Native Hawaiian and Other Pacific Islander alone (% change since 2000)
Races - Two or more races(%)
Races - Two or more races(% change since 2000)
Races - Other race alone (%)
Races - Other race alone (% change since 2000)
Racial diversity
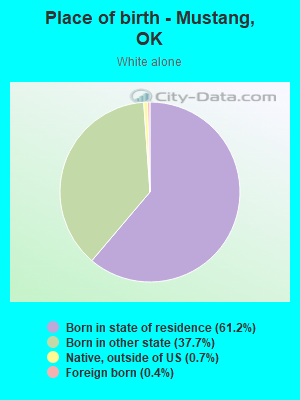
Place of birth - Born in state of residence (%)
Place of birth - Born in state of residence (%) - White
Place of birth - Born in state of residence (%) - Black or African American
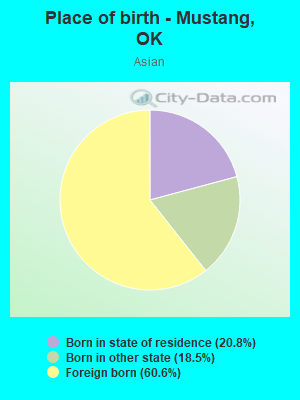
Place of birth - Born in state of residence (%) - Asian
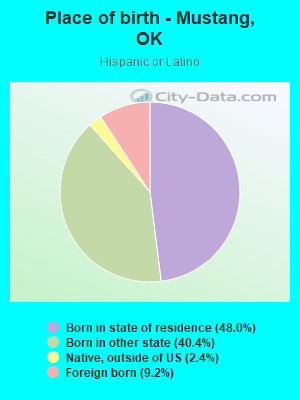
Place of birth - Born in state of residence (%) - Hispanic or Latino
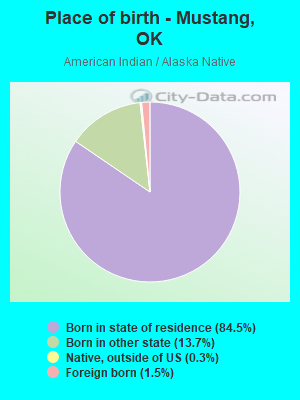
Place of birth - Born in state of residence (%) - American Indian and Alaska Native
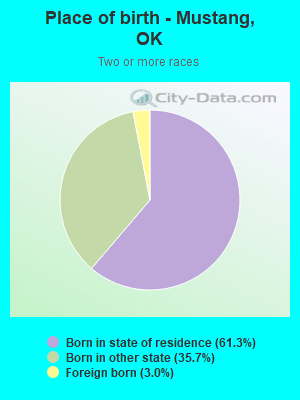
Place of birth - Born in state of residence (%) - Multirace
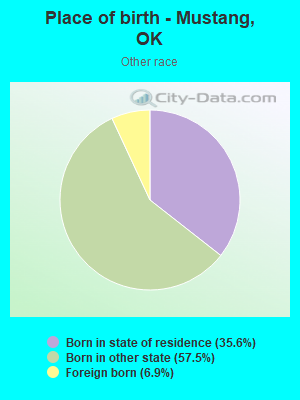
Place of birth - Born in state of residence (%) - Other Race
Place of birth - Born in other state (%)
Place of birth - Born in other state (%) - White
Place of birth - Born in other state (%) - Black or African American
Place of birth - Born in other state (%) - Asian
Place of birth - Born in other state (%) - Hispanic or Latino
Place of birth - Born in other state (%) - American Indian and Alaska Native
Place of birth - Born in other state (%) - Multirace
Place of birth - Born in other state (%) - Other Race
Place of birth - Native, outside of US (%)
Place of birth - Native, outside of US (%) - White
Place of birth - Native, outside of US (%) - Black or African American
Place of birth - Native, outside of US (%) - Asian
Place of birth - Native, outside of US (%) - Hispanic or Latino
Place of birth - Native, outside of US (%) - American Indian and Alaska Native
Place of birth - Native, outside of US (%) - Multirace
Place of birth - Native, outside of US (%) - Other Race
Place of birth - Foreign born (%)
Place of birth - Foreign born (%) - White
Place of birth - Foreign born (%) - Black or African American
Place of birth - Foreign born (%) - Asian
Place of birth - Foreign born (%) - Hispanic or Latino
Place of birth - Foreign born (%) - American Indian and Alaska Native
Place of birth - Foreign born (%) - Multirace
Place of birth - Foreign born (%) - Other Race
Residents speaking English at home (%)
Residents speaking English at home - Born in the United States (%)
Residents speaking English at home - Native, born elsewhere (%)
Residents speaking English at home - Foreign born (%)
Residents speaking Spanish at home (%)
Residents speaking Spanish at home - Born in the United States (%)
Residents speaking Spanish at home - Native, born elsewhere (%)
Residents speaking Spanish at home - Foreign born (%)
Residents speaking other language at home (%)
Residents speaking other language at home - Born in the United States (%)
Residents speaking other language at home - Native, born elsewhere (%)
Residents speaking other language at home - Foreign born (%)
Marital status - Never married (%)
Marital status - Now married (%)
Marital status - Separated (%)
Marital status - Widowed (%)
Marital status - Divorced (%)
Ancestries Reported - Arab (%)
Ancestries Reported - Czech (%)
Ancestries Reported - Danish (%)
Ancestries Reported - Dutch (%)
Ancestries Reported - English (%)
Ancestries Reported - French (%)
Ancestries Reported - French Canadian (%)
Ancestries Reported - German (%)
Ancestries Reported - Greek (%)
Ancestries Reported - Hungarian (%)
Ancestries Reported - Irish (%)
Ancestries Reported - Italian (%)
Ancestries Reported - Lithuanian (%)
Ancestries Reported - Norwegian (%)
Ancestries Reported - Polish (%)
Ancestries Reported - Portuguese (%)
Ancestries Reported - Russian (%)
Ancestries Reported - Scotch-Irish (%)
Ancestries Reported - Scottish (%)
Ancestries Reported - Slovak (%)
Ancestries Reported - Subsaharan African (%)
Ancestries Reported - Swedish (%)
Ancestries Reported - Swiss (%)
Ancestries Reported - Ukrainian (%)
Ancestries Reported - United States (%)
Ancestries Reported - Welsh (%)
Ancestries Reported - West Indian (%)
Ancestries Reported - Other (%)
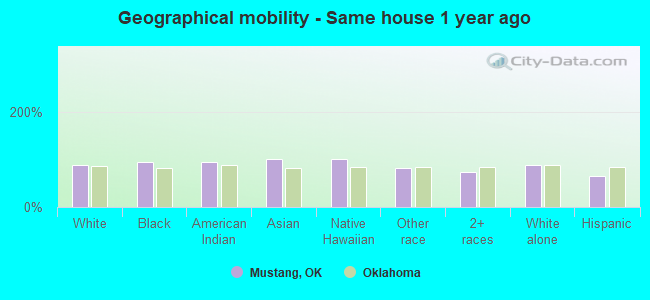
Geographical mobility - Same house 1 year ago (%)
Geographical mobility - Same house 1 year ago (%) - White
Geographical mobility - Same house 1 year ago (%) - Black or African American
Geographical mobility - Same house 1 year ago (%) - Asian
Geographical mobility - Same house 1 year ago (%) - Hispanic or Latino
Geographical mobility - Same house 1 year ago (%) - American Indian and Alaska Native
Geographical mobility - Same house 1 year ago (%) - Multirace
Geographical mobility - Same house 1 year ago (%) - Other Race
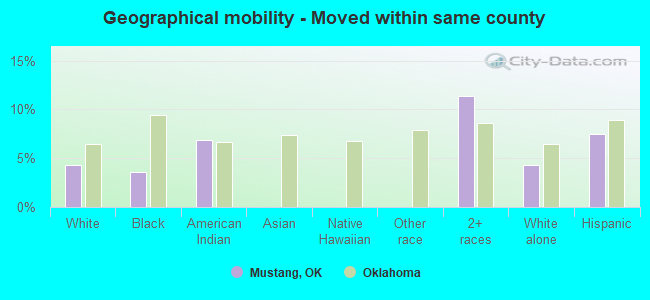
Geographical mobility - Moved within same county (%)
Geographical mobility - Moved within same county (%) - White
Geographical mobility - Moved within same county (%) - Black or African American
Geographical mobility - Moved within same county (%) - Asian
Geographical mobility - Moved within same county (%) - Hispanic or Latino
Geographical mobility - Moved within same county (%) - American Indian and Alaska Native
Geographical mobility - Moved within same county (%) - Multirace
Geographical mobility - Moved within same county (%) - Other Race
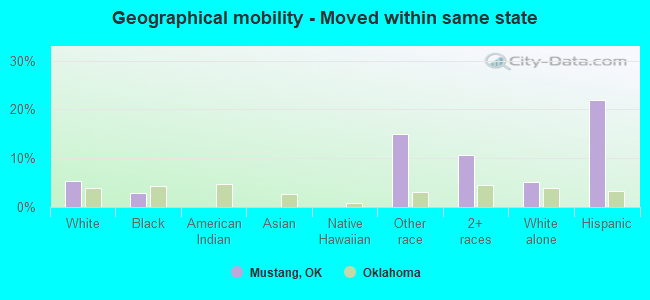
Geographical mobility - Moved from different county within same state (%)
Geographical mobility - Moved from different county within same state (%) - White
Geographical mobility - Moved from different county within same state (%) - Black or African American
Geographical mobility - Moved from different county within same state (%) - Asian
Geographical mobility - Moved from different county within same state (%) - Hispanic or Latino
Geographical mobility - Moved from different county within same state (%) - American Indian and Alaska Native
Geographical mobility - Moved from different county within same state (%) - Multirace
Geographical mobility - Moved from different county within same state (%) - Other Race
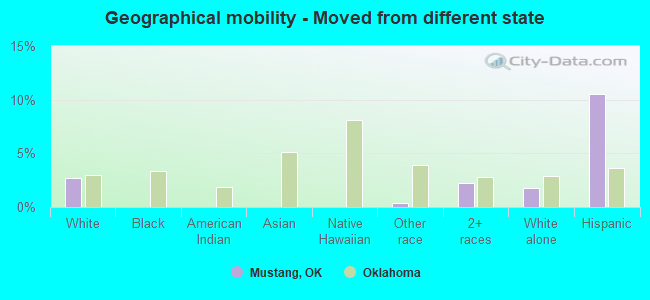
Geographical mobility - Moved from different state (%)
Geographical mobility - Moved from different state (%) - White
Geographical mobility - Moved from different state (%) - Black or African American
Geographical mobility - Moved from different state (%) - Asian
Geographical mobility - Moved from different state (%) - Hispanic or Latino
Geographical mobility - Moved from different state (%) - American Indian and Alaska Native
Geographical mobility - Moved from different state (%) - Multirace
Geographical mobility - Moved from different state (%) - Other Race
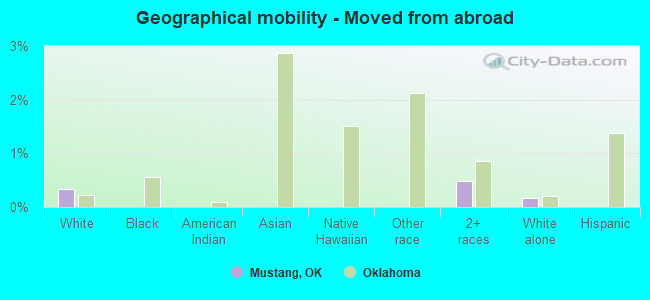
Geographical mobility - Moved from abroad (%)
Geographical mobility - Moved from abroad (%) - White
Geographical mobility - Moved from abroad (%) - Black or African American
Geographical mobility - Moved from abroad (%) - Asian
Geographical mobility - Moved from abroad (%) - Hispanic or Latino
Geographical mobility - Moved from abroad (%) - American Indian and Alaska Native
Geographical mobility - Moved from abroad (%) - Multirace
Geographical mobility - Moved from abroad (%) - Other Race
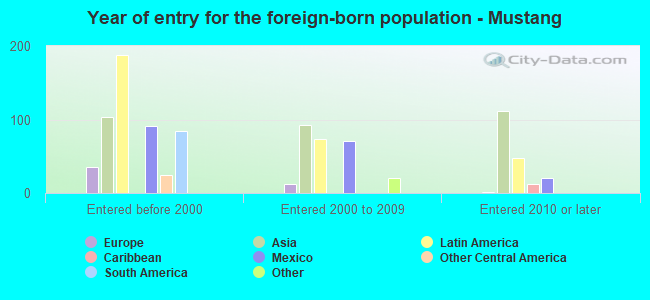
Place of birth for the foreign-born population - Ireland (%)
Place of birth for the foreign-born population - Denmark (%)
Place of birth for the foreign-born population - Norway (%)
Place of birth for the foreign-born population - Sweden (%)
Place of birth for the foreign-born population - United Kingdom (%)
Place of birth for the foreign-born population - England (%)
Place of birth for the foreign-born population - Scotland (%)
Place of birth for the foreign-born population - Other Northern Europe (%)
Place of birth for the foreign-born population - Austria (%)
Place of birth for the foreign-born population - Belgium (%)
Place of birth for the foreign-born population - France (%)
Place of birth for the foreign-born population - Germany (%)
Place of birth for the foreign-born population - Netherlands (%)
Place of birth for the foreign-born population - Switzerland (%)
Place of birth for the foreign-born population - Other Western Europe (%)
Place of birth for the foreign-born population - Greece (%)
Place of birth for the foreign-born population - Italy (%)
Place of birth for the foreign-born population - Portugal (%)
Place of birth for the foreign-born population - Spain (%)
Place of birth for the foreign-born population - Other Southern Europe (%)
Place of birth for the foreign-born population - Albania (%)
Place of birth for the foreign-born population - Belarus (%)
Place of birth for the foreign-born population - Bosnia and Herzegovina (%)
Place of birth for the foreign-born population - Bulgaria (%)
Place of birth for the foreign-born population - Croatia (%)
Place of birth for the foreign-born population - Czechoslovakia (%)
Place of birth for the foreign-born population - Hungary (%)
Place of birth for the foreign-born population - Latvia (%)
Place of birth for the foreign-born population - Lithuania (%)
Place of birth for the foreign-born population - North Macedonia (Macedonia) (%)
Place of birth for the foreign-born population - Moldova (%)
Place of birth for the foreign-born population - Poland (%)
Place of birth for the foreign-born population - Romania (%)
Place of birth for the foreign-born population - Russia (%)
Place of birth for the foreign-born population - Serbia (%)
Place of birth for the foreign-born population - Ukraine (%)
Place of birth for the foreign-born population - Other Eastern Europe (%)
Place of birth for the foreign-born population - China (%)
Place of birth for the foreign-born population - Hong Kong (%)
Place of birth for the foreign-born population - Taiwan (%)
Place of birth for the foreign-born population - Japan (%)
Place of birth for the foreign-born population - Korea (%)
Place of birth for the foreign-born population - Other Eastern Asia (%)
Place of birth for the foreign-born population - Afghanistan (%)
Place of birth for the foreign-born population - Bangladesh (%)
Place of birth for the foreign-born population - India (%)
Place of birth for the foreign-born population - Iran (%)
Place of birth for the foreign-born population - Kazakhstan (%)
Place of birth for the foreign-born population - Nepal (%)
Place of birth for the foreign-born population - Pakistan (%)
Place of birth for the foreign-born population - Sri Lanka (%)
Place of birth for the foreign-born population - Uzbekistan (%)
Place of birth for the foreign-born population - Other South Central Asia (%)
Place of birth for the foreign-born population - Burma (%)
Place of birth for the foreign-born population - Cambodia (%)
Place of birth for the foreign-born population - Indonesia (%)
Place of birth for the foreign-born population - Laos (%)
Place of birth for the foreign-born population - Malaysia (%)
Place of birth for the foreign-born population - Philippines (%)
Place of birth for the foreign-born population - Singapore (%)
Place of birth for the foreign-born population - Thailand (%)
Place of birth for the foreign-born population - Vietnam (%)
Place of birth for the foreign-born population - Other South Eastern Asia (%)
Place of birth for the foreign-born population - Armenia (%)
Place of birth for the foreign-born population - Iraq (%)
Place of birth for the foreign-born population - Israel (%)
Place of birth for the foreign-born population - Jordan (%)
Place of birth for the foreign-born population - Kuwait (%)
Place of birth for the foreign-born population - Lebanon (%)
Place of birth for the foreign-born population - Saudi Arabia (%)
Place of birth for the foreign-born population - Syria (%)
Place of birth for the foreign-born population - Turkey (%)
Place of birth for the foreign-born population - Yemen (%)
Place of birth for the foreign-born population - Other Western Asia (%)
Place of birth for the foreign-born population - Eritrea (%)
Place of birth for the foreign-born population - Ethiopia (%)
Place of birth for the foreign-born population - Kenya (%)
Place of birth for the foreign-born population - Somalia (%)
Place of birth for the foreign-born population - Uganda (%)
Place of birth for the foreign-born population - Zimbabwe (%)
Place of birth for the foreign-born population - Other Eastern Africa (%)
Place of birth for the foreign-born population - Cameroon (%)
Place of birth for the foreign-born population - Congo (%)
Place of birth for the foreign-born population - Democratic Republic of Congo (Zaire) (%)
Place of birth for the foreign-born population - Other Middle Africa (%)
Place of birth for the foreign-born population - Egypt (%)
Place of birth for the foreign-born population - Morocco (%)
Place of birth for the foreign-born population - Sudan (%)
Place of birth for the foreign-born population - Other Northern Africa (%)
Place of birth for the foreign-born population - South Africa (%)
Place of birth for the foreign-born population - Other Southern Africa (%)
Place of birth for the foreign-born population - Cabo Verde (%)
Place of birth for the foreign-born population - Ghana (%)
Place of birth for the foreign-born population - Liberia (%)
Place of birth for the foreign-born population - Nigeria (%)
Place of birth for the foreign-born population - Senegal (%)
Place of birth for the foreign-born population - Sierra Leone (%)
Place of birth for the foreign-born population - Other Western Africa (%)
Place of birth for the foreign-born population - Australia (%)
Place of birth for the foreign-born population - New Zealand (%)
Place of birth for the foreign-born population - Fiji (%)
Place of birth for the foreign-born population - Micronesia (%)
Place of birth for the foreign-born population - Bahamas (%)
Place of birth for the foreign-born population - Barbados (%)
Place of birth for the foreign-born population - Cuba (%)
Place of birth for the foreign-born population - Dominica (%)
Place of birth for the foreign-born population - Dominican Republic (%)
Place of birth for the foreign-born population - Grenada (%)
Place of birth for the foreign-born population - Haiti (%)
Place of birth for the foreign-born population - Jamaica (%)
Place of birth for the foreign-born population - St. Vincent and the Grenadines (%)
Place of birth for the foreign-born population - Trinidad and Tobago (%)
Place of birth for the foreign-born population - West Indies (%)
Place of birth for the foreign-born population - Other Caribbean (%)
Place of birth for the foreign-born population - Belize (%)
Place of birth for the foreign-born population - Costa Rica (%)
Place of birth for the foreign-born population - El Salvador (%)
Place of birth for the foreign-born population - Guatemala (%)
Place of birth for the foreign-born population - Honduras (%)
Place of birth for the foreign-born population - Mexico (%)
Place of birth for the foreign-born population - Nicaragua (%)
Place of birth for the foreign-born population - Panama (%)
Place of birth for the foreign-born population - Other Central America (%)
Place of birth for the foreign-born population - Argentina (%)
Place of birth for the foreign-born population - Bolivia (%)
Place of birth for the foreign-born population - Brazil (%)
Place of birth for the foreign-born population - Chile (%)
Place of birth for the foreign-born population - Colombia (%)
Place of birth for the foreign-born population - Ecuador (%)
Place of birth for the foreign-born population - Guyana (%)
Place of birth for the foreign-born population - Peru (%)
Place of birth for the foreign-born population - Uruguay (%)
Place of birth for the foreign-born population - Venezuela (%)
Place of birth for the foreign-born population - Other South America (%)
Place of birth for the foreign-born population - Canada (%)
Place of birth for the foreign-born population - Other Northern America (%)
Place of birth for the foreign-born population - Other (%)
Latest news about races in Mustang, OK collected exclusively by city-data.com from local newspapers, TV, and radio stations
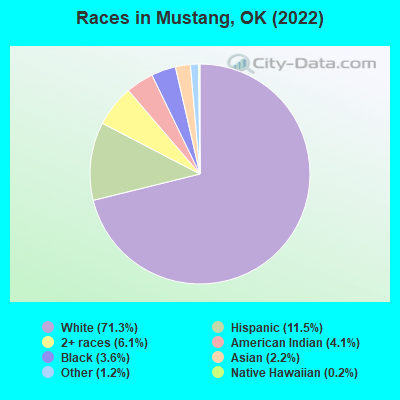
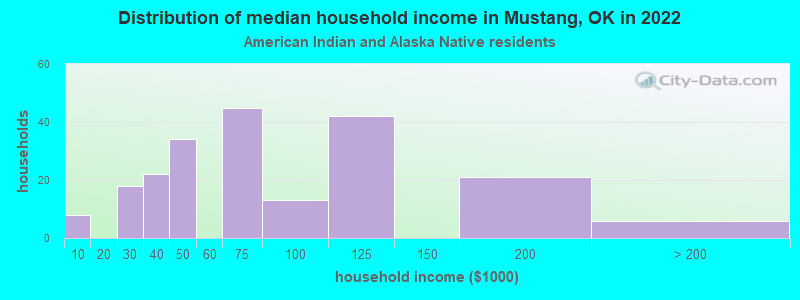
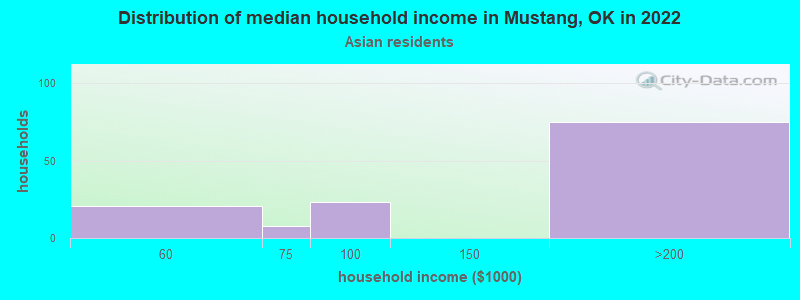
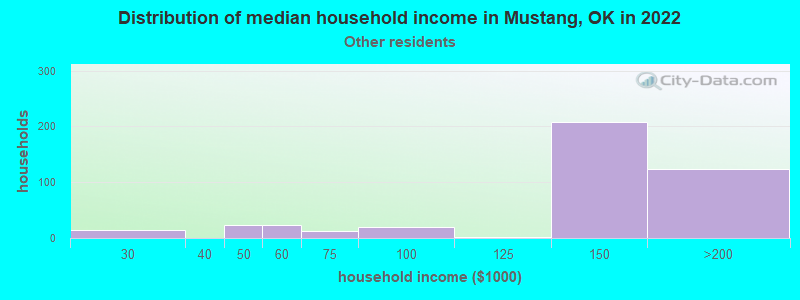
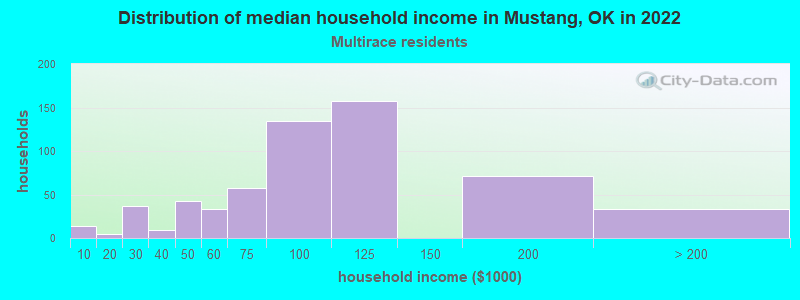
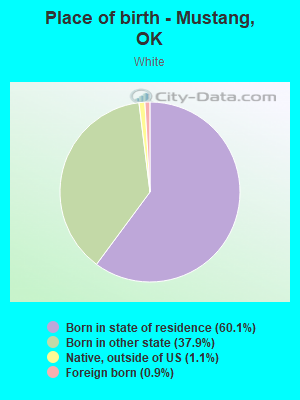
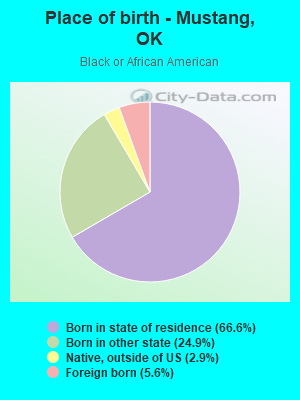
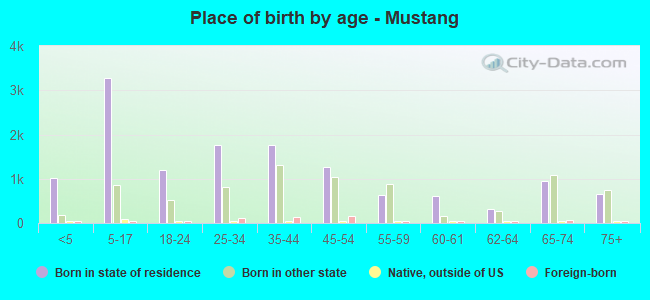
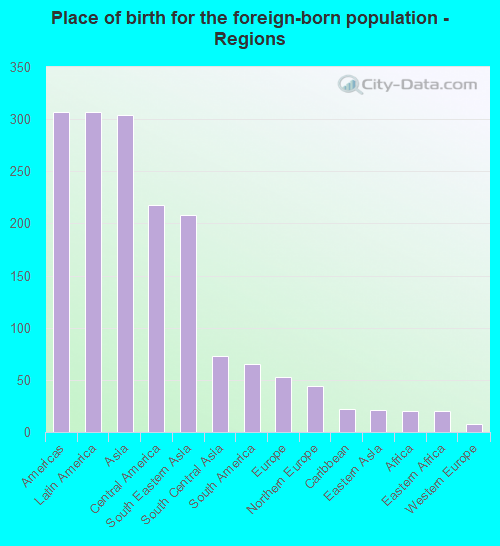
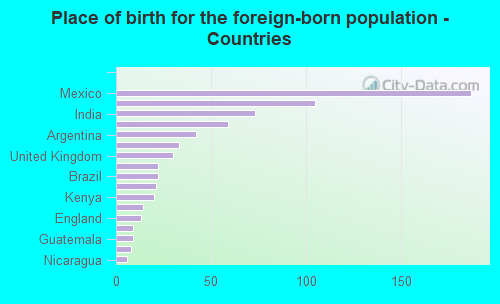
According to 2022 data, the most numerous races in Mustang, OK are White alone (15,804 residents), Hispanic (2,555 residents), and Two or more races (1,358 residents). 92.1% of Mustang residents speak English at home. 3.1% of Mustang, OK residents are foreign-born (1.5% born in Latin America, 1.5% born in Asia), which is 93.7% less than the foreign-born rate of 6.0% across the entire state of Oklahoma.
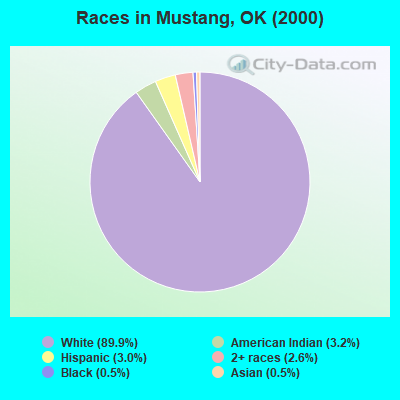
Race distribution in Mustang
2000 2022
2,556,368 74.1% White alone 266,158 7.7% American Indian alone 257,981 7.5% Black alone 179,304 5.2% Hispanic 140,249 4.1% Two or more races 46,172 1.3% Asian alone 2,322 0.07% Other race alone 2,100 0.06% Native Hawaiian and Other
2,517,403 62.6% White alone 486,692 12.1% Hispanic 364,453 9.1% Two or more races 273,650 6.8% American Indian alone 268,543 6.7% Black alone 92,672 2.3% Asian alone 10,786 0.3% Other race alone 5,601 0.1% Native Hawaiian and Other
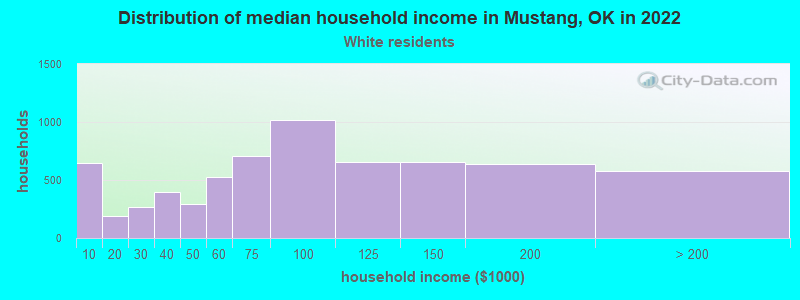
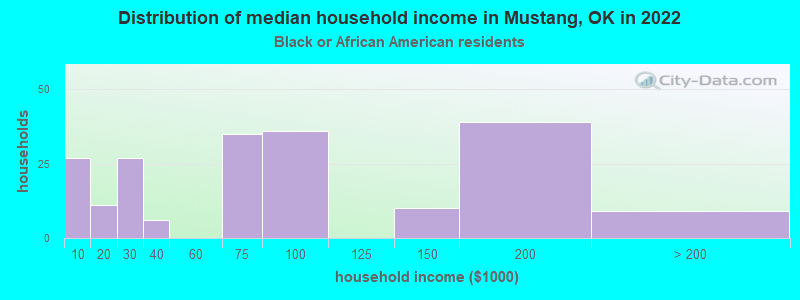
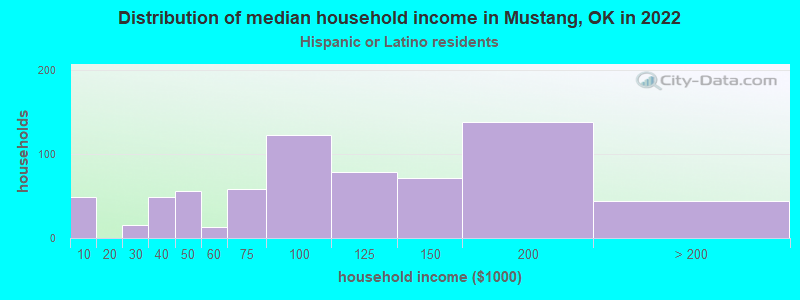
Income and house value in Mustang Median household income in 2022 $80,859 White non-Hispanic householders$91,572 Black householders$68,677 American Indian and Alaska Native householders$132,073 Asian householders$187,256 Some other race householders$96,249 Two or more races householders$96,624 Hispanic or Latino race householdersMedian 2022 house value $235,069 White Non-Hispanic householders$202,288 American Indian or Alaska Native householders $219,939 Asian householders$182,115 Native Hawaiian and other Pacific Islander householders$197,805 Some other race householders$191,922 Two or more races householders$195,003 Hispanic or Latino householders
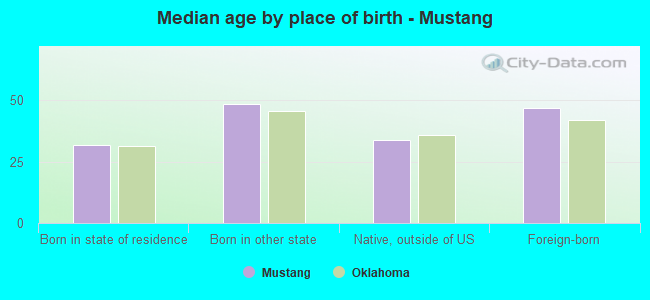
Median age by race in Mustang
41.8 Median age for White residents41.6 42.9 27.5 Median age for Black or African American residents15.9 45.8 32.8 Median age for American Indian / Alaska Native residents42.4 14.5 31.0 Median age for Asian residents29.8 22.5 -846,761,452.5 Median age for Native Hawaiian / Pacific Islander residents-666,666,666.0 -767,251,461.2 63.1 Median age for Other race residents62.9 45.7 24.0 Median age for Two or more races residents23.4 24.3 42.2 Median age for White alone residents41.8 43.5 28.0 Median age for Hispanic or Latino residents28.0 28.8
Owner/renter occupied households by race in Mustang
House owners and renters - White residents 5,016 77.4% Owner occupied1,464 22.6% Renter occupiedHouse owners and renters - Black or African American residents 89 47.1% Owner occupied100 52.9% Renter occupiedHouse owners and renters - American Indian / Alaska Native residents 158 67.3% Owner occupied77 32.7% Renter occupiedHouse owners and renters - Asian residents 100 92.9% Owner occupied8 7.1% Renter occupiedHouse owners and renters - Native Hawaiian / Pacific Islander residents 31 100.0% Renter occupiedHouse owners and renters - Other race residents 184 87.2% Owner occupied27 12.8% Renter occupiedHouse owners and renters - Two or more races residents 467 79.1% Owner occupied123 20.9% Renter occupiedHouse owners and renters - White alone residents 4,871 77.8% Owner occupied1,387 22.2% Renter occupiedHouse owners and renters - Hispanic or Latino residents 614 84.3% Owner occupied114 15.7% Renter occupied
Language usage in Mustang
English speakers - Total 92.1% of residents of Mustang speak English at home.
5.5% of residents speak Spanish at home 979 85.1% Speak English very well171 14.9% Speak English less than very well2.2% of residents speak other language at home 355 75.4% Speak English very well116 24.6% Speak English less than very well
English speakers - Born in the United States 92.8% of residents of Mustang speak English at home.
4.5% of residents speak Spanish at home 314 89.5% Speak English very well37 10.5% Speak English less than very well1.8% of residents speak other language at home 141 100.0% Speak English very well
English speakers - Native, born elsewhere 71.0% of residents of Mustang speak English at home.
15.8% of residents speak Spanish at home 35 100.0% Speak English very well
English speakers - Foreign-born 26.4% of residents of Mustang speak English at home.
34.0% of residents speak Spanish at home 146 66.4% Speak English very well74 33.6% Speak English less than very well34.7% of residents speak other language at home 112 49.8% Speak English very well113 50.2% Speak English less than very well
White (Caucasian) - Speak only English Native:
96.5% (15,168)Foreign-born:
29.6% (44)
White (Caucasian) - Speak another language Native:
3.5% (547)Foreign-born:
68.5% (102)
Black or African American - Speak another language Native:
3.5% (20)Foreign-born:
100.0% (38)
Asian - Speak only English Native:
84.0% (172)Foreign-born:
32.4% (89)
Asian - Speak another language Native:
15.6% (32)Foreign-born:
61.3% (169)
Other race - Speak another language Native:
39.7% (292)Foreign-born:
100.0% (57)
Two or more races - Speak only English Native:
79.6% (1,751)Foreign-born:
10.4% (8)
Two or more races - Speak another language Native:
19.1% (420)Foreign-born:
70.6% (53)
White alone - Speak only English Native:
97.9% (14,746)Foreign-born:
47.7% (32)
White alone - Speak another language Native:
2.3% (347)Foreign-born:
51.5% (34)
Hispanic or Latino - Speak only English Native:
69.1% (1,465)Foreign-born:
10.2% (25)
Hispanic or Latino - Speak another language Native:
30.9% (654)Foreign-born:
91.7% (221)
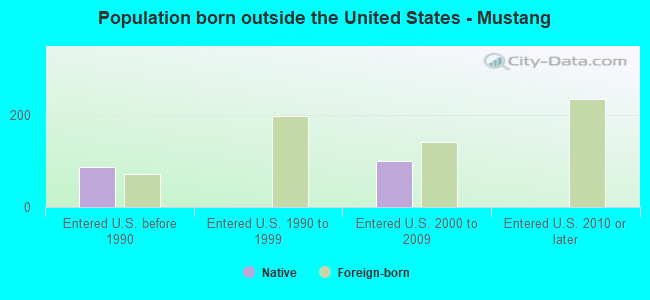
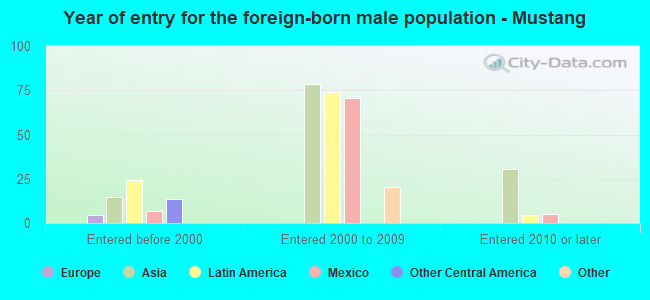
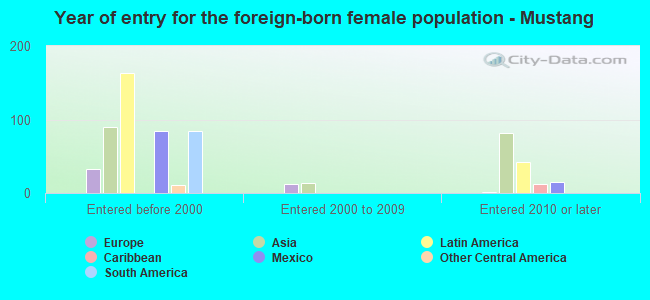
Foreign-born residents in Mustang 686 residents are foreign born (1.5% Latin America , 1.5% Asia ).
This city:
3.1%Oklahoma:
6.1%
Marital status for residents in Mustang Marital status - White (Caucasian) population 15 years and over
Males 22.5% Never married64.1% Now married1.9% Separated1.8% Widowed9.7% DivorcedFemales 14.9% Never married57.7% Now married0.5% Separated9.2% Widowed17.7% DivorcedWomen who gave birth in the past 12 months Now married:
69.4% (180)Unmarried:
30.6% (80)
Women who did not give birth in the past 12 months Now married:
60.2% (2,158)Unmarried:
39.8% (1,424)
Marital status - Black or African American population 15 years and over
Males 63.6% Never married36.4% Now married0.0% Separated0.0% Widowed0.0% DivorcedFemales 27.5% Never married38.7% Now married16.0% Separated3.3% Widowed14.5% DivorcedWomen who gave birth in the past 12 months Now married:
0.0% (0)Unmarried:
100.0% (18)
Women who did not give birth in the past 12 months Now married:
75.3% (126)Unmarried:
24.7% (41)
Marital status - American Indian / Alaska Native population 15 years and over
Males 20.3% Never married57.8% Now married4.3% Separated0.0% Widowed17.6% DivorcedFemales 47.3% Never married33.8% Now married0.0% Separated3.2% Widowed15.8% DivorcedWomen who gave birth in the past 12 months Now married:
100.0% (6)Unmarried:
0.0% (0)
Women who did not give birth in the past 12 months Now married:
25.5% (83)Unmarried:
74.5% (243)
Marital status - Asian population 15 years and over
Males 14.1% Never married85.9% Now married0.0% Separated0.0% Widowed0.0% DivorcedFemales 35.7% Never married54.9% Now married0.0% Separated9.4% Widowed0.0% DivorcedWomen who gave birth in the past 12 months Now married:
100.0% (12)Unmarried:
0.0% (0)
Women who did not give birth in the past 12 months Now married:
51.7% (90)Unmarried:
48.3% (84)
Marital status - Other race population 15 years and over
Males 2.8% Never married90.4% Now married0.0% Separated0.0% Widowed6.9% DivorcedFemales 4.2% Never married87.4% Now married0.0% Separated0.0% Widowed8.4% DivorcedWomen who did not give birth in the past 12 months Now married:
84.0% (49)Unmarried:
16.0% (9)
Marital status - Two or more races population 15 years and over
Males 40.9% Never married49.5% Now married0.0% Separated1.7% Widowed7.9% DivorcedFemales 17.2% Never married37.0% Now married5.8% Separated13.4% Widowed26.5% DivorcedWomen who gave birth in the past 12 months Now married:
81.8% (13)Unmarried:
18.2% (3)
Women who did not give birth in the past 12 months Now married:
43.4% (215)Unmarried:
56.6% (280)
Marital status - White alone, not Hispanic / Latino population 15 years and over
Males 21.8% Never married64.5% Now married2.0% Separated1.9% Widowed9.8% DivorcedFemales 14.4% Never married58.0% Now married0.5% Separated8.9% Widowed18.2% DivorcedWomen who gave birth in the past 12 months Now married:
68.5% (171)Unmarried:
31.5% (79)
Women who did not give birth in the past 12 months Now married:
60.6% (1,982)Unmarried:
39.4% (1,287)
Marital status - Hispanic or Latino population 15 years and over
Males 33.7% Never married59.5% Now married0.0% Separated0.0% Widowed6.7% DivorcedFemales 22.3% Never married49.2% Now married0.4% Separated10.1% Widowed18.0% DivorcedWomen who gave birth in the past 12 months Now married:
100.0% (15)Unmarried:
0.0% (0)
Women who did not give birth in the past 12 months Now married:
53.2% (302)Unmarried:
46.8% (265)
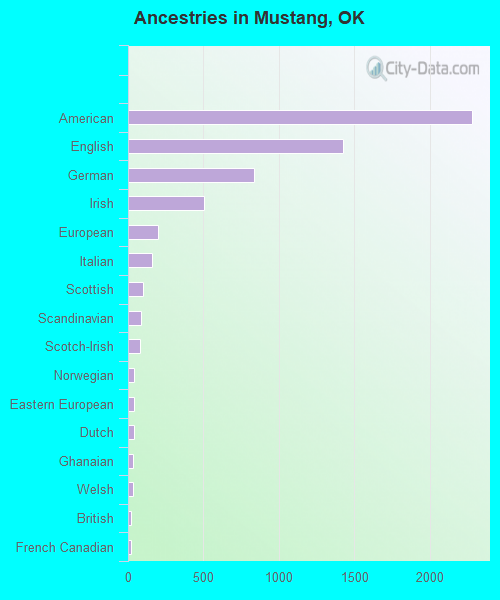
Ancestries in Mustang
2,280 22.3% American1,425 13.9% English835 8.2% German503 4.9% Irish201 2.0% European161 1.6% Italian97 0.9% Scottish85 0.8% Scandinavian79 0.8% Scotch-Irish42 0.4% Norwegian40 0.4% Eastern European39 0.4% Dutch35 0.3% Ghanaian31 0.3% Welsh22 0.2% British22 0.2% French Canadian19 0.2% French15 0.1% Ukrainian10 0.10% Northern European9 0.09% Czech8 0.08% Swedish4 0.04% Bulgarian3 0.03% Dutch West Indian2 0.02% Czechoslovakian
Children Nativity (place of birth) in Mustang
Children under 6 years - Living with two parents Both parents native 901 100.0% NativeBoth parents foreign-born 34 100.0% NativeOne native, one foreign-born parent 70 100.0% NativeChildren under 6 years - Living with one parent Native parent 390 100.0% NativeChildren 6 to 17 years - Living with two parents Both parents native 2,343 100.0% NativeBoth parents foreign-born 108 86.8% Native16 13.2% Foreign-bornOne native, one foreign-born parent 247 100.0% NativeChildren 6 to 17 years - Living with one parent Native parent 994 100.0% NativeForeign-born parent 97 52.8% Native87 47.2% Foreign-born
Grandparents responsible for own grandchildren in Mustang
Grandparents (30 to 59 years) White / Caucasian 95 55.1% Responsible for grandchildren78 44.9% Not responsible for grandchildrenBlack or African American 21 100.0% Responsible for grandchildrenAmerican Indian / Alaska Native 10 100.0% Responsible for grandchildrenTwo or more races 8 100.0% Not responsible for grandchildrenWhite alone, not Hispanic / Latino 95 65.5% Responsible for grandchildren50 34.5% Not responsible for grandchildrenHispanic or Latino 41 100.0% Not responsible for grandchildrenGrandparents (60 years and over) White / Caucasian 29 18.3% Responsible for grandchildren131 81.7% Not responsible for grandchildrenAmerican Indian / Alaska Native 8 100.0% Responsible for grandchildrenTwo or more races 45 100.0% Not responsible for grandchildrenWhite alone, not Hispanic / Latino 30 24.6% Responsible for grandchildren92 75.4% Not responsible for grandchildrenHispanic or Latino 103 100.0% Not responsible for grandchildren