Races in Muskogee, Oklahoma (OK) Detailed Stats
Data:
Races - White alone (%)
Races - White alone (% change since 2000)
Races - Black alone (%)
Races - Black alone (% change since 2000)
Races - American Indian alone (%)
Races - American Indian alone (% change since 2000)
Races - Asian alone (%)
Races - Asian alone (% change since 2000)
Races - Hispanic (%)
Races - Hispanic (% change since 2000)
Races - Native Hawaiian and Other Pacific Islander alone (%)
Races - Native Hawaiian and Other Pacific Islander alone (% change since 2000)
Races - Two or more races(%)
Races - Two or more races(% change since 2000)
Races - Other race alone (%)
Races - Other race alone (% change since 2000)
Racial diversity
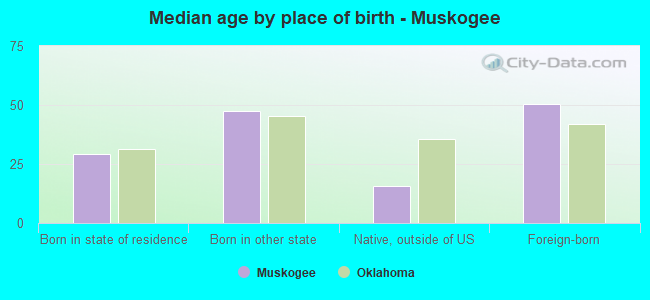
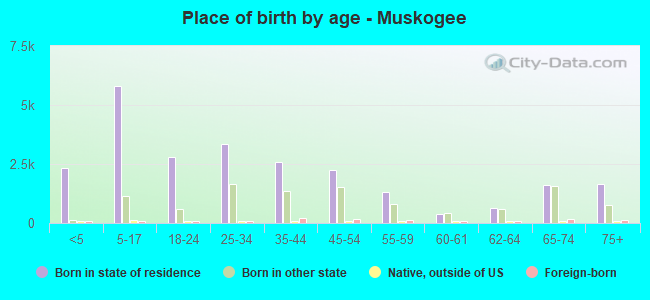
Place of birth - Born in state of residence (%)
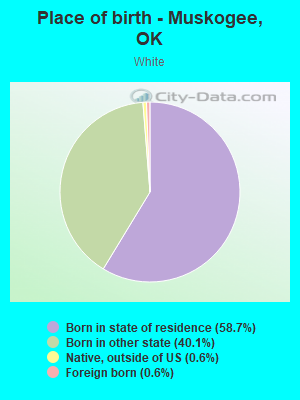
Place of birth - Born in state of residence (%) - White
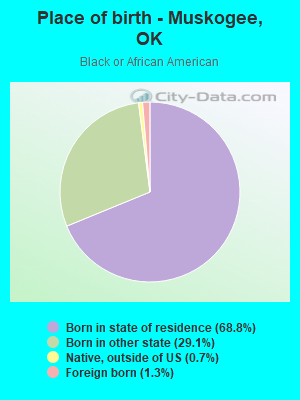
Place of birth - Born in state of residence (%) - Black or African American
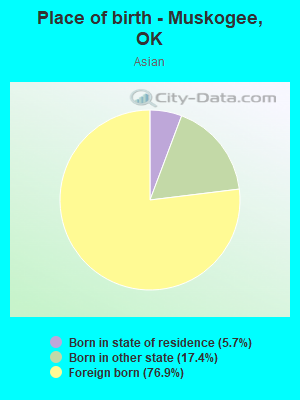
Place of birth - Born in state of residence (%) - Asian
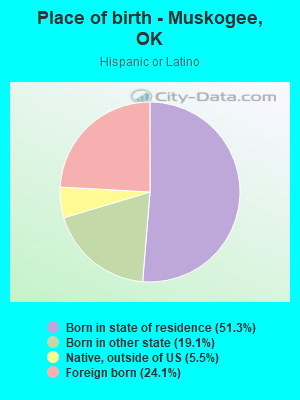
Place of birth - Born in state of residence (%) - Hispanic or Latino
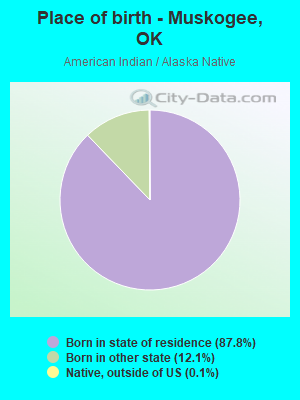
Place of birth - Born in state of residence (%) - American Indian and Alaska Native
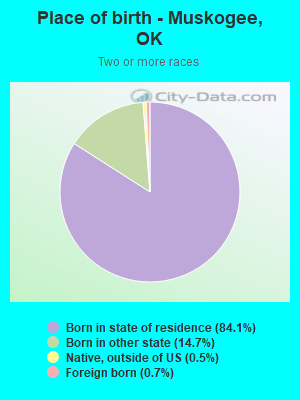
Place of birth - Born in state of residence (%) - Multirace
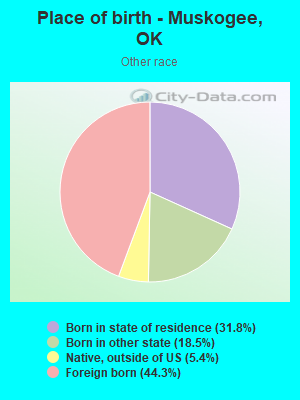
Place of birth - Born in state of residence (%) - Other Race
Place of birth - Born in other state (%)
Place of birth - Born in other state (%) - White
Place of birth - Born in other state (%) - Black or African American
Place of birth - Born in other state (%) - Asian
Place of birth - Born in other state (%) - Hispanic or Latino
Place of birth - Born in other state (%) - American Indian and Alaska Native
Place of birth - Born in other state (%) - Multirace
Place of birth - Born in other state (%) - Other Race
Place of birth - Native, outside of US (%)
Place of birth - Native, outside of US (%) - White
Place of birth - Native, outside of US (%) - Black or African American
Place of birth - Native, outside of US (%) - Asian
Place of birth - Native, outside of US (%) - Hispanic or Latino
Place of birth - Native, outside of US (%) - American Indian and Alaska Native
Place of birth - Native, outside of US (%) - Multirace
Place of birth - Native, outside of US (%) - Other Race
Place of birth - Foreign born (%)
Place of birth - Foreign born (%) - White
Place of birth - Foreign born (%) - Black or African American
Place of birth - Foreign born (%) - Asian
Place of birth - Foreign born (%) - Hispanic or Latino
Place of birth - Foreign born (%) - American Indian and Alaska Native
Place of birth - Foreign born (%) - Multirace
Place of birth - Foreign born (%) - Other Race
Residents speaking English at home (%)
Residents speaking English at home - Born in the United States (%)
Residents speaking English at home - Native, born elsewhere (%)
Residents speaking English at home - Foreign born (%)
Residents speaking Spanish at home (%)
Residents speaking Spanish at home - Born in the United States (%)
Residents speaking Spanish at home - Native, born elsewhere (%)
Residents speaking Spanish at home - Foreign born (%)
Residents speaking other language at home (%)
Residents speaking other language at home - Born in the United States (%)
Residents speaking other language at home - Native, born elsewhere (%)
Residents speaking other language at home - Foreign born (%)
Marital status - Never married (%)
Marital status - Now married (%)
Marital status - Separated (%)
Marital status - Widowed (%)
Marital status - Divorced (%)
Ancestries Reported - Arab (%)
Ancestries Reported - Czech (%)
Ancestries Reported - Danish (%)
Ancestries Reported - Dutch (%)
Ancestries Reported - English (%)
Ancestries Reported - French (%)
Ancestries Reported - French Canadian (%)
Ancestries Reported - German (%)
Ancestries Reported - Greek (%)
Ancestries Reported - Hungarian (%)
Ancestries Reported - Irish (%)
Ancestries Reported - Italian (%)
Ancestries Reported - Lithuanian (%)
Ancestries Reported - Norwegian (%)
Ancestries Reported - Polish (%)
Ancestries Reported - Portuguese (%)
Ancestries Reported - Russian (%)
Ancestries Reported - Scotch-Irish (%)
Ancestries Reported - Scottish (%)
Ancestries Reported - Slovak (%)
Ancestries Reported - Subsaharan African (%)
Ancestries Reported - Swedish (%)
Ancestries Reported - Swiss (%)
Ancestries Reported - Ukrainian (%)
Ancestries Reported - United States (%)
Ancestries Reported - Welsh (%)
Ancestries Reported - West Indian (%)
Ancestries Reported - Other (%)
Geographical mobility - Same house 1 year ago (%)
Geographical mobility - Same house 1 year ago (%) - White
Geographical mobility - Same house 1 year ago (%) - Black or African American
Geographical mobility - Same house 1 year ago (%) - Asian
Geographical mobility - Same house 1 year ago (%) - Hispanic or Latino
Geographical mobility - Same house 1 year ago (%) - American Indian and Alaska Native
Geographical mobility - Same house 1 year ago (%) - Multirace
Geographical mobility - Same house 1 year ago (%) - Other Race
Geographical mobility - Moved within same county (%)
Geographical mobility - Moved within same county (%) - White
Geographical mobility - Moved within same county (%) - Black or African American
Geographical mobility - Moved within same county (%) - Asian
Geographical mobility - Moved within same county (%) - Hispanic or Latino
Geographical mobility - Moved within same county (%) - American Indian and Alaska Native
Geographical mobility - Moved within same county (%) - Multirace
Geographical mobility - Moved within same county (%) - Other Race
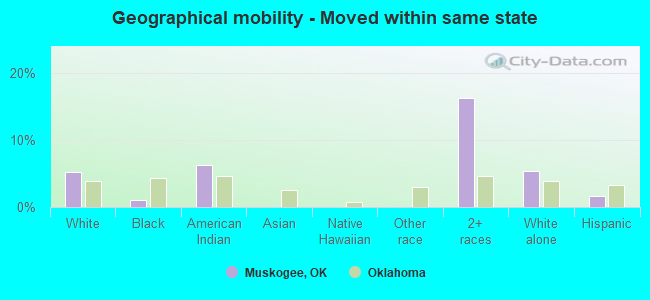
Geographical mobility - Moved from different county within same state (%)
Geographical mobility - Moved from different county within same state (%) - White
Geographical mobility - Moved from different county within same state (%) - Black or African American
Geographical mobility - Moved from different county within same state (%) - Asian
Geographical mobility - Moved from different county within same state (%) - Hispanic or Latino
Geographical mobility - Moved from different county within same state (%) - American Indian and Alaska Native
Geographical mobility - Moved from different county within same state (%) - Multirace
Geographical mobility - Moved from different county within same state (%) - Other Race
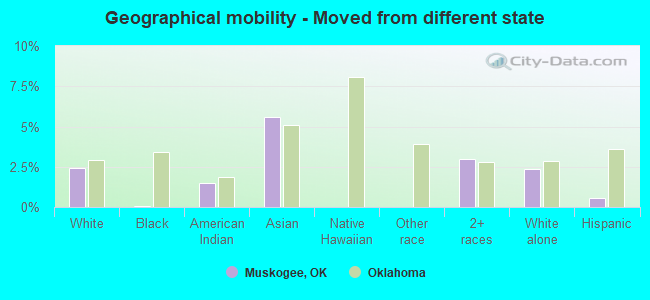
Geographical mobility - Moved from different state (%)
Geographical mobility - Moved from different state (%) - White
Geographical mobility - Moved from different state (%) - Black or African American
Geographical mobility - Moved from different state (%) - Asian
Geographical mobility - Moved from different state (%) - Hispanic or Latino
Geographical mobility - Moved from different state (%) - American Indian and Alaska Native
Geographical mobility - Moved from different state (%) - Multirace
Geographical mobility - Moved from different state (%) - Other Race
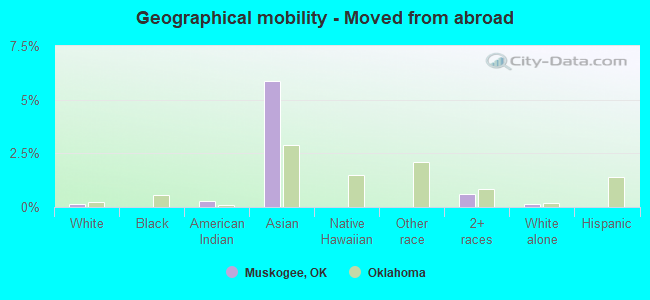
Geographical mobility - Moved from abroad (%)
Geographical mobility - Moved from abroad (%) - White
Geographical mobility - Moved from abroad (%) - Black or African American
Geographical mobility - Moved from abroad (%) - Asian
Geographical mobility - Moved from abroad (%) - Hispanic or Latino
Geographical mobility - Moved from abroad (%) - American Indian and Alaska Native
Geographical mobility - Moved from abroad (%) - Multirace
Geographical mobility - Moved from abroad (%) - Other Race
Place of birth for the foreign-born population - Ireland (%)
Place of birth for the foreign-born population - Denmark (%)
Place of birth for the foreign-born population - Norway (%)
Place of birth for the foreign-born population - Sweden (%)
Place of birth for the foreign-born population - United Kingdom (%)
Place of birth for the foreign-born population - England (%)
Place of birth for the foreign-born population - Scotland (%)
Place of birth for the foreign-born population - Other Northern Europe (%)
Place of birth for the foreign-born population - Austria (%)
Place of birth for the foreign-born population - Belgium (%)
Place of birth for the foreign-born population - France (%)
Place of birth for the foreign-born population - Germany (%)
Place of birth for the foreign-born population - Netherlands (%)
Place of birth for the foreign-born population - Switzerland (%)
Place of birth for the foreign-born population - Other Western Europe (%)
Place of birth for the foreign-born population - Greece (%)
Place of birth for the foreign-born population - Italy (%)
Place of birth for the foreign-born population - Portugal (%)
Place of birth for the foreign-born population - Spain (%)
Place of birth for the foreign-born population - Other Southern Europe (%)
Place of birth for the foreign-born population - Albania (%)
Place of birth for the foreign-born population - Belarus (%)
Place of birth for the foreign-born population - Bosnia and Herzegovina (%)
Place of birth for the foreign-born population - Bulgaria (%)
Place of birth for the foreign-born population - Croatia (%)
Place of birth for the foreign-born population - Czechoslovakia (%)
Place of birth for the foreign-born population - Hungary (%)
Place of birth for the foreign-born population - Latvia (%)
Place of birth for the foreign-born population - Lithuania (%)
Place of birth for the foreign-born population - North Macedonia (Macedonia) (%)
Place of birth for the foreign-born population - Moldova (%)
Place of birth for the foreign-born population - Poland (%)
Place of birth for the foreign-born population - Romania (%)
Place of birth for the foreign-born population - Russia (%)
Place of birth for the foreign-born population - Serbia (%)
Place of birth for the foreign-born population - Ukraine (%)
Place of birth for the foreign-born population - Other Eastern Europe (%)
Place of birth for the foreign-born population - China (%)
Place of birth for the foreign-born population - Hong Kong (%)
Place of birth for the foreign-born population - Taiwan (%)
Place of birth for the foreign-born population - Japan (%)
Place of birth for the foreign-born population - Korea (%)
Place of birth for the foreign-born population - Other Eastern Asia (%)
Place of birth for the foreign-born population - Afghanistan (%)
Place of birth for the foreign-born population - Bangladesh (%)
Place of birth for the foreign-born population - India (%)
Place of birth for the foreign-born population - Iran (%)
Place of birth for the foreign-born population - Kazakhstan (%)
Place of birth for the foreign-born population - Nepal (%)
Place of birth for the foreign-born population - Pakistan (%)
Place of birth for the foreign-born population - Sri Lanka (%)
Place of birth for the foreign-born population - Uzbekistan (%)
Place of birth for the foreign-born population - Other South Central Asia (%)
Place of birth for the foreign-born population - Burma (%)
Place of birth for the foreign-born population - Cambodia (%)
Place of birth for the foreign-born population - Indonesia (%)
Place of birth for the foreign-born population - Laos (%)
Place of birth for the foreign-born population - Malaysia (%)
Place of birth for the foreign-born population - Philippines (%)
Place of birth for the foreign-born population - Singapore (%)
Place of birth for the foreign-born population - Thailand (%)
Place of birth for the foreign-born population - Vietnam (%)
Place of birth for the foreign-born population - Other South Eastern Asia (%)
Place of birth for the foreign-born population - Armenia (%)
Place of birth for the foreign-born population - Iraq (%)
Place of birth for the foreign-born population - Israel (%)
Place of birth for the foreign-born population - Jordan (%)
Place of birth for the foreign-born population - Kuwait (%)
Place of birth for the foreign-born population - Lebanon (%)
Place of birth for the foreign-born population - Saudi Arabia (%)
Place of birth for the foreign-born population - Syria (%)
Place of birth for the foreign-born population - Turkey (%)
Place of birth for the foreign-born population - Yemen (%)
Place of birth for the foreign-born population - Other Western Asia (%)
Place of birth for the foreign-born population - Eritrea (%)
Place of birth for the foreign-born population - Ethiopia (%)
Place of birth for the foreign-born population - Kenya (%)
Place of birth for the foreign-born population - Somalia (%)
Place of birth for the foreign-born population - Uganda (%)
Place of birth for the foreign-born population - Zimbabwe (%)
Place of birth for the foreign-born population - Other Eastern Africa (%)
Place of birth for the foreign-born population - Cameroon (%)
Place of birth for the foreign-born population - Congo (%)
Place of birth for the foreign-born population - Democratic Republic of Congo (Zaire) (%)
Place of birth for the foreign-born population - Other Middle Africa (%)
Place of birth for the foreign-born population - Egypt (%)
Place of birth for the foreign-born population - Morocco (%)
Place of birth for the foreign-born population - Sudan (%)
Place of birth for the foreign-born population - Other Northern Africa (%)
Place of birth for the foreign-born population - South Africa (%)
Place of birth for the foreign-born population - Other Southern Africa (%)
Place of birth for the foreign-born population - Cabo Verde (%)
Place of birth for the foreign-born population - Ghana (%)
Place of birth for the foreign-born population - Liberia (%)
Place of birth for the foreign-born population - Nigeria (%)
Place of birth for the foreign-born population - Senegal (%)
Place of birth for the foreign-born population - Sierra Leone (%)
Place of birth for the foreign-born population - Other Western Africa (%)
Place of birth for the foreign-born population - Australia (%)
Place of birth for the foreign-born population - New Zealand (%)
Place of birth for the foreign-born population - Fiji (%)
Place of birth for the foreign-born population - Micronesia (%)
Place of birth for the foreign-born population - Bahamas (%)
Place of birth for the foreign-born population - Barbados (%)
Place of birth for the foreign-born population - Cuba (%)
Place of birth for the foreign-born population - Dominica (%)
Place of birth for the foreign-born population - Dominican Republic (%)
Place of birth for the foreign-born population - Grenada (%)
Place of birth for the foreign-born population - Haiti (%)
Place of birth for the foreign-born population - Jamaica (%)
Place of birth for the foreign-born population - St. Vincent and the Grenadines (%)
Place of birth for the foreign-born population - Trinidad and Tobago (%)
Place of birth for the foreign-born population - West Indies (%)
Place of birth for the foreign-born population - Other Caribbean (%)
Place of birth for the foreign-born population - Belize (%)
Place of birth for the foreign-born population - Costa Rica (%)
Place of birth for the foreign-born population - El Salvador (%)
Place of birth for the foreign-born population - Guatemala (%)
Place of birth for the foreign-born population - Honduras (%)
Place of birth for the foreign-born population - Mexico (%)
Place of birth for the foreign-born population - Nicaragua (%)
Place of birth for the foreign-born population - Panama (%)
Place of birth for the foreign-born population - Other Central America (%)
Place of birth for the foreign-born population - Argentina (%)
Place of birth for the foreign-born population - Bolivia (%)
Place of birth for the foreign-born population - Brazil (%)
Place of birth for the foreign-born population - Chile (%)
Place of birth for the foreign-born population - Colombia (%)
Place of birth for the foreign-born population - Ecuador (%)
Place of birth for the foreign-born population - Guyana (%)
Place of birth for the foreign-born population - Peru (%)
Place of birth for the foreign-born population - Uruguay (%)
Place of birth for the foreign-born population - Venezuela (%)
Place of birth for the foreign-born population - Other South America (%)
Place of birth for the foreign-born population - Canada (%)
Place of birth for the foreign-born population - Other Northern America (%)
Place of birth for the foreign-born population - Other (%)
Latest news about races in Muskogee, OK collected exclusively by city-data.com from local newspapers, TV, and radio stations
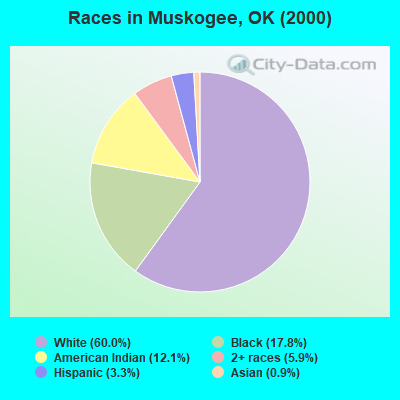
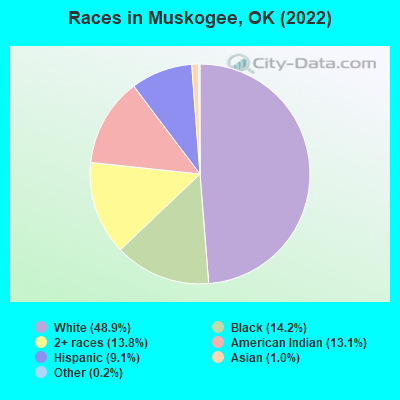
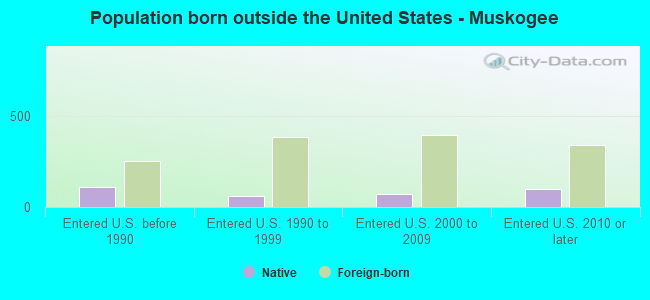
According to 2022 data, the most numerous races in Muskogee, OK are White alone (18,007 residents), Hispanic (3,347 residents), and Two or more races (5,071 residents). 92.5% of Muskogee residents speak English at home. 3.7% of Muskogee, OK residents are foreign-born (2.7% born in Latin America, 0.9% born in Asia), which is 60.7% less than the foreign-born rate of 6.0% across the entire state of Oklahoma.
Race distribution in Muskogee
2000 2022
22,983 60.0% White alone 6,813 17.8% Black alone 4,628 12.1% American Indian alone 2,252 5.9% Two or more races 1,258 3.3% Hispanic 337 0.9% Asian alone 32 0.08% Other race alone 7 0.02% Native Hawaiian and Other
18,007 48.9% White alone 5,215 14.2% Black alone 5,071 13.8% Two or more races 4,830 13.1% American Indian alone 3,347 9.1% Hispanic 351 1.0% Asian alone 67 0.2% Other race alone
2000 2022
2,556,368 74.1% White alone 266,158 7.7% American Indian alone 257,981 7.5% Black alone 179,304 5.2% Hispanic 140,249 4.1% Two or more races 46,172 1.3% Asian alone 2,322 0.07% Other race alone 2,100 0.06% Native Hawaiian and Other
2,517,403 62.6% White alone 486,692 12.1% Hispanic 364,453 9.1% Two or more races 273,650 6.8% American Indian alone 268,543 6.7% Black alone 92,672 2.3% Asian alone 10,786 0.3% Other race alone 5,601 0.1% Native Hawaiian and Other
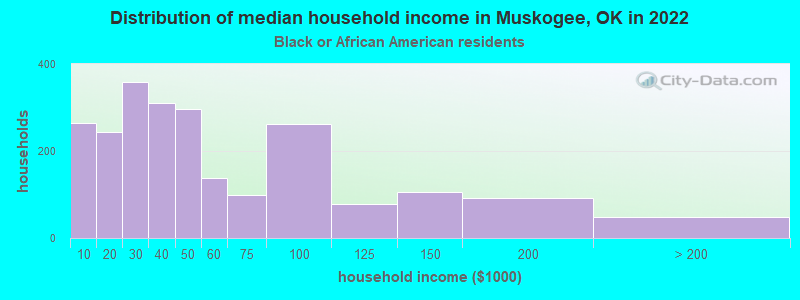
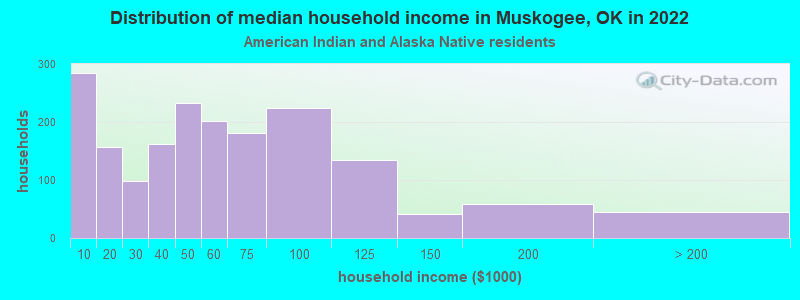
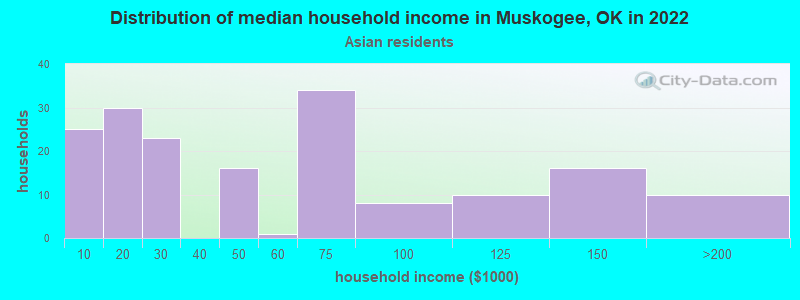
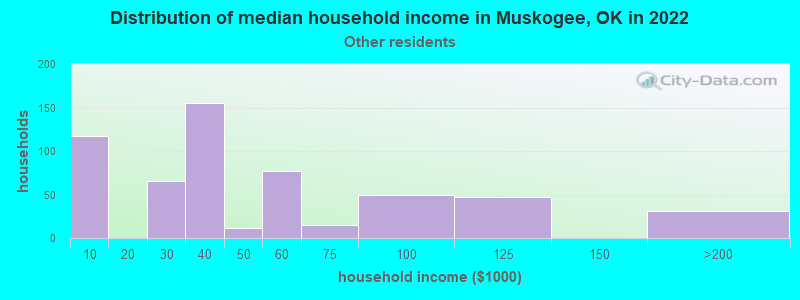
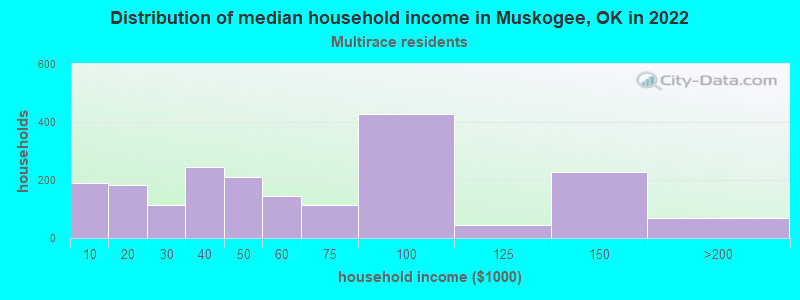
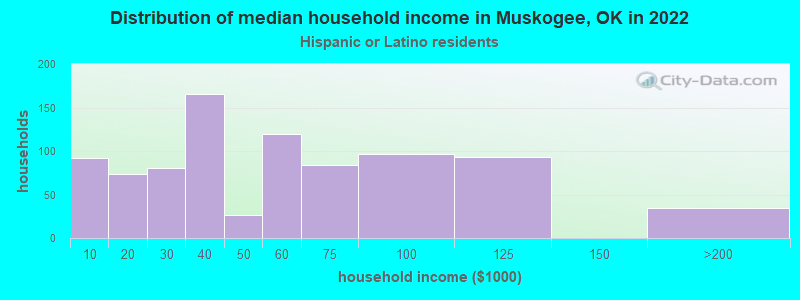
Income and house value in Muskogee Median household income in 2022 $52,341 White non-Hispanic householders$39,167 Black householders$53,210 American Indian and Alaska Native householders$19,210 Asian householders$37,455 Some other race householders$53,719 Two or more races householders$46,177 Hispanic or Latino race householdersMedian 2022 house value $154,020 White Non-Hispanic householders$106,455 Black or African American householders$132,628 American Indian or Alaska Native householders $249,905 Asian householders$213,917 Native Hawaiian and other Pacific Islander householders$108,216 Some other race householders$135,648 Two or more races householders$89,593 Hispanic or Latino householders
Median age by race in Muskogee
42.0 Median age for White residents38.7 44.9 38.0 Median age for Black or African American residents32.8 40.3 27.2 Median age for American Indian / Alaska Native residents26.4 25.2 58.5 Median age for Asian residents57.7 69.1 -666,666,666.0 Median age for Native Hawaiian / Pacific Islander residents-666,666,666.0 -666,666,666.0 28.3 Median age for Other race residents28.6 23.1 25.0 Median age for Two or more races residents17.9 25.8 42.9 Median age for White alone residents39.5 46.7 21.7 Median age for Hispanic or Latino residents26.9 16.3
Owner/renter occupied households by race in Muskogee
House owners and renters - White residents 4,510 54.3% Owner occupied3,800 45.7% Renter occupiedHouse owners and renters - Black or African American residents 953 50.9% Owner occupied921 49.1% Renter occupiedHouse owners and renters - American Indian / Alaska Native residents 901 53.6% Owner occupied781 46.4% Renter occupiedHouse owners and renters - Asian residents 182 75.6% Owner occupied59 24.4% Renter occupiedHouse owners and renters - Native Hawaiian / Pacific Islander residents 5 100.0% Renter occupiedHouse owners and renters - Other race residents 173 39.9% Owner occupied260 60.1% Renter occupiedHouse owners and renters - Two or more races residents 840 41.9% Owner occupied1,163 58.1% Renter occupiedHouse owners and renters - White alone residents 4,417 54.9% Owner occupied3,628 45.1% Renter occupiedHouse owners and renters - Hispanic or Latino residents 267 38.8% Owner occupied421 61.2% Renter occupied
Language usage in Muskogee
English speakers - Total 92.5% of residents of Muskogee speak English at home.
5.9% of residents speak Spanish at home 1,404 69.3% Speak English very well622 30.7% Speak English less than very well1.8% of residents speak other language at home 289 47.9% Speak English very well314 52.1% Speak English less than very well
English speakers - Born in the United States 97.6% of residents of Muskogee speak English at home.
2.2% of residents speak Spanish at home 231 100.0% Speak English very well0.2% of residents speak other language at home 24 100.0% Speak English very well
English speakers - Native, born elsewhere 45.9% of residents of Muskogee speak English at home.
71.7% of residents speak Spanish at home 85 48.6% Speak English very well90 51.4% Speak English less than very well13.1% of residents speak other language at home 9 28.1% Speak English very well23 71.9% Speak English less than very well
English speakers - Foreign-born 9.8% of residents of Muskogee speak English at home.
67.2% of residents speak Spanish at home 410 50.4% Speak English very well403 49.6% Speak English less than very well25.1% of residents speak other language at home 115 38.0% Speak English very well188 62.0% Speak English less than very well
White (Caucasian) - Speak only English Native:
97.9% (17,457)Foreign-born:
43.7% (52)
White (Caucasian) - Speak another language Native:
2.0% (349)Foreign-born:
73.1% (86)
Black or African American - Speak another language Native:
3.2% (157)Foreign-born:
100.0% (60)
Asian - Speak only English Native:
65.9% (46)Foreign-born:
1.9% (5)
Asian - Speak another language Native:
34.0% (24)Foreign-born:
99.0% (245)
Other race - Speak only English Native:
51.3% (457)Foreign-born:
7.9% (64)
Other race - Speak another language Native:
48.4% (431)Foreign-born:
91.3% (741)
Two or more races - Speak only English Native:
89.5% (4,276)Foreign-born:
27.8% (16)
Two or more races - Speak another language Native:
8.8% (420)Foreign-born:
63.0% (36)
White alone - Speak only English Native:
99.4% (17,174)Foreign-born:
47.2% (50)
White alone - Speak another language Native:
0.6% (107)Foreign-born:
57.5% (61)
Hispanic or Latino - Speak only English Native:
56.4% (1,182)Foreign-born:
12.0% (95)
Hispanic or Latino - Speak another language Native:
42.6% (893)Foreign-born:
100.0% (794)
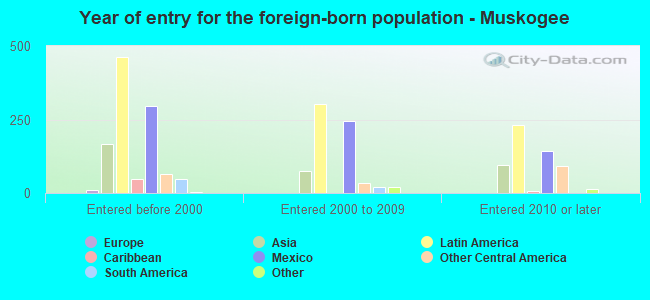
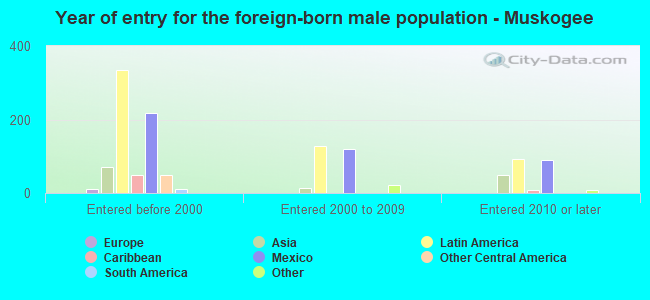
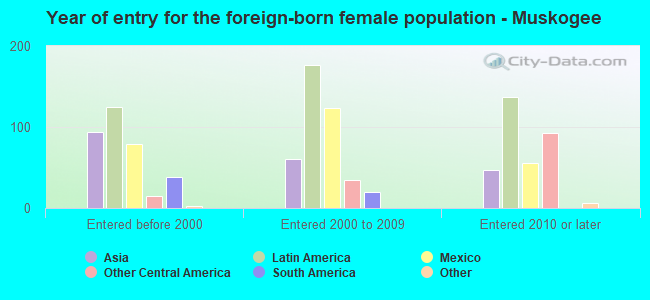
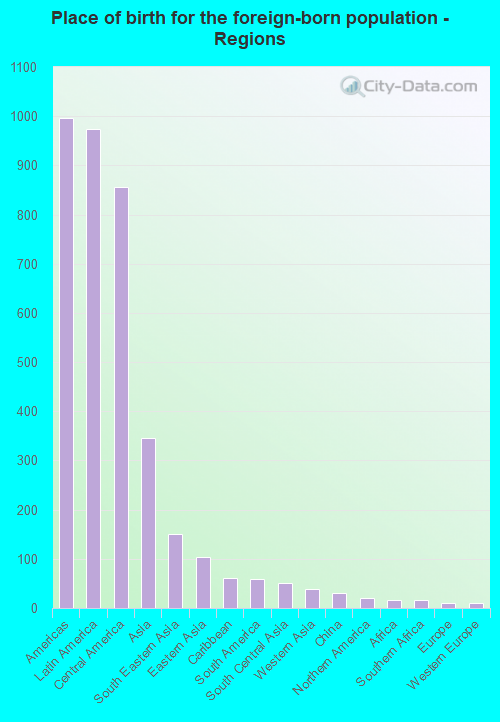
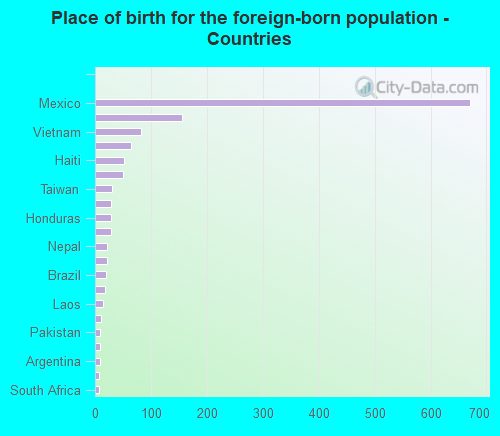
Foreign-born residents in Muskogee 1,374 residents are foreign born (2.7% Latin America , 0.9% Asia ).
This city:
3.7%Oklahoma:
6.1%
Marital status for residents in Muskogee Marital status - White (Caucasian) population 15 years and over
Males 33.2% Never married46.3% Now married2.3% Separated3.3% Widowed14.9% DivorcedFemales 22.5% Never married44.2% Now married3.4% Separated16.5% Widowed13.4% DivorcedWomen who gave birth in the past 12 months Now married:
62.2% (114)Unmarried:
37.8% (69)
Women who did not give birth in the past 12 months Now married:
44.9% (1,655)Unmarried:
55.1% (2,031)
Marital status - Black or African American population 15 years and over
Males 42.5% Never married32.3% Now married4.4% Separated1.6% Widowed19.3% DivorcedFemales 44.8% Never married24.7% Now married3.6% Separated12.7% Widowed14.2% DivorcedWomen who gave birth in the past 12 months Now married:
0.0% (0)Unmarried:
100.0% (84)
Women who did not give birth in the past 12 months Now married:
26.9% (283)Unmarried:
73.1% (769)
Marital status - American Indian / Alaska Native population 15 years and over
Males 44.4% Never married40.6% Now married0.7% Separated0.3% Widowed13.9% DivorcedFemales 40.6% Never married31.5% Now married1.5% Separated7.9% Widowed18.5% DivorcedWomen who gave birth in the past 12 months Now married:
33.5% (50)Unmarried:
66.5% (99)
Women who did not give birth in the past 12 months Now married:
29.7% (337)Unmarried:
70.3% (796)
Marital status - Asian population 15 years and over
Males 30.7% Never married59.6% Now married0.0% Separated7.0% Widowed2.6% DivorcedFemales 3.6% Never married71.0% Now married0.0% Separated25.4% Widowed0.0% DivorcedWomen who gave birth in the past 12 months Now married:
100.0% (25)Unmarried:
0.0% (0)
Women who did not give birth in the past 12 months Now married:
92.0% (81)Unmarried:
8.0% (7)
Marital status - Other race population 15 years and over
Males 31.1% Never married64.9% Now married0.0% Separated0.0% Widowed4.0% DivorcedFemales 35.8% Never married54.3% Now married2.6% Separated0.5% Widowed6.8% DivorcedWomen who did not give birth in the past 12 months Now married:
57.5% (339)Unmarried:
42.5% (251)
Marital status - Two or more races population 15 years and over
Males 38.9% Never married37.6% Now married2.1% Separated5.0% Widowed16.3% DivorcedFemales 43.4% Never married30.7% Now married2.1% Separated9.6% Widowed14.1% DivorcedWomen who gave birth in the past 12 months Now married:
71.2% (68)Unmarried:
28.8% (28)
Women who did not give birth in the past 12 months Now married:
28.6% (485)Unmarried:
71.4% (1,211)
Marital status - White alone, not Hispanic / Latino population 15 years and over
Males 33.4% Never married45.8% Now married2.3% Separated3.4% Widowed15.1% DivorcedFemales 21.7% Never married44.1% Now married3.5% Separated17.0% Widowed13.7% DivorcedWomen who gave birth in the past 12 months Now married:
67.8% (102)Unmarried:
32.2% (49)
Women who did not give birth in the past 12 months Now married:
45.7% (1,611)Unmarried:
54.3% (1,914)
Marital status - Hispanic or Latino population 15 years and over
Males 34.8% Never married60.2% Now married0.0% Separated0.0% Widowed5.0% DivorcedFemales 41.6% Never married50.7% Now married2.1% Separated0.6% Widowed5.0% DivorcedWomen who gave birth in the past 12 months Now married:
45.1% (25)Unmarried:
54.9% (31)
Women who did not give birth in the past 12 months Now married:
46.3% (373)Unmarried:
53.7% (433)
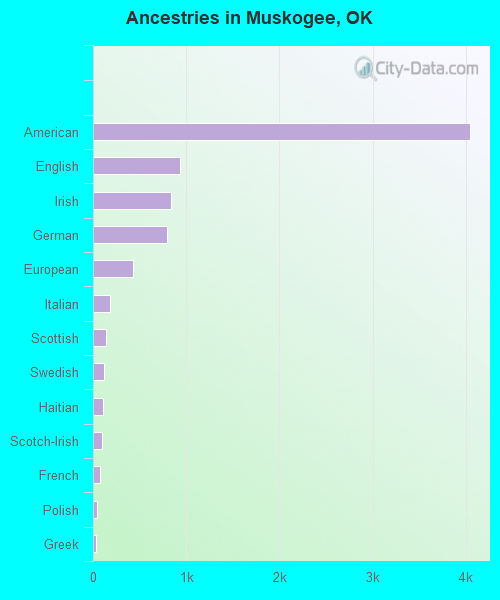
Ancestries in Muskogee
4,047 19.2% American937 4.5% English832 4.0% Irish794 3.8% German427 2.0% European183 0.9% Italian142 0.7% Scottish123 0.6% Swedish111 0.5% Haitian98 0.5% Scotch-Irish71 0.3% French38 0.2% Polish37 0.2% Greek26 0.1% Finnish24 0.1% Israeli21 0.10% Dutch West Indian18 0.09% Danish18 0.09% Eastern European18 0.09% Welsh17 0.08% Canadian16 0.08% Lebanese15 0.07% Dutch12 0.06% Scandinavian11 0.05% Celtic11 0.05% African11 0.05% Jamaican10 0.05% British9 0.04% French Canadian8 0.04% Russian7 0.03% Norwegian4 0.02% Northern European
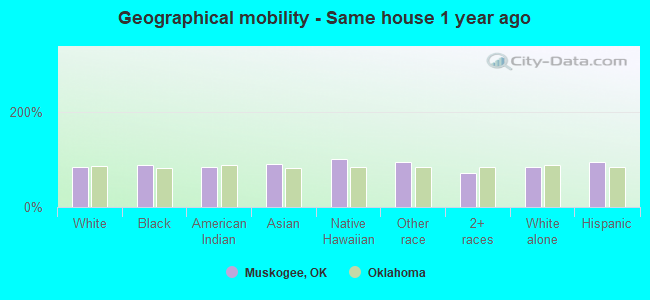
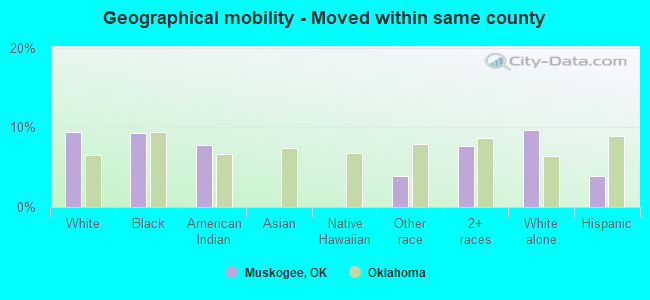
Geographical mobility in Muskogee Same house 1 year ago 15,500 83.0% White (Caucasian)4,685 89.3% Black or African American4,123 83.6% American Indian / Alaska Native293 90.2% Asian6 100.0% Native Hawaiian / Pacific Islander2,032 95.0% Other race3,843 72.1% Two or more races14,848 82.5% White alone, not Hispanic / Latino3,053 94.4% Hispanic or LatinoMoved within same county 1,765 9.5% White / Caucasian490 9.3% Black or African American381 7.7% American Indian / Alaska Native82 3.8% Other race405 7.6% Two or more races1,744 9.7% White alone, not Hispanic / Latino125 3.9% Hispanic or LatinoMoved within same state 963 5.2% White / Caucasian56 1.1% Black or African American309 6.3% American Indian / Alaska Native867 16.3% Two or more races975 5.4% White alone, not Hispanic / Latino52 1.6% Hispanic or LatinoMoved from different state 456 2.4% White / Caucasian2 0.0% Black or African American72 1.5% American Indian / Alaska Native18 5.6% Asian160 3.0% Two or more races428 2.4% White alone, not Hispanic / Latino17 0.5% Hispanic or LatinoMoved from abroad 29 0.2% White13 0.3% American Indian / Alaska Native19 5.9% Asian33 0.6% Two or more races29 0.2% White alone, not Hispanic / Latino
Children Nativity (place of birth) in Muskogee
Children under 6 years - Living with two parents Both parents native 1,233 100.0% NativeBoth parents foreign-born 122 100.0% NativeOne native, one foreign-born parent 32 100.0% NativeChildren under 6 years - Living with one parent Native parent 1,442 100.0% NativeForeign-born parent 25 100.0% NativeChildren 6 to 17 years - Living with two parents Both parents native 2,537 100.0% NativeBoth parents foreign-born 300 96.6% Native11 3.4% Foreign-bornOne native, one foreign-born parent 128 75.8% Native41 24.2% Foreign-bornChildren 6 to 17 years - Living with one parent Native parent 2,864 100.0% NativeForeign-born parent 113 49.9% Native113 50.1% Foreign-born
Grandparents responsible for own grandchildren in Muskogee
Grandparents (30 to 59 years) White / Caucasian 135 64.8% Responsible for grandchildren73 35.2% Not responsible for grandchildrenBlack or African American 29 62.7% Responsible for grandchildren17 37.3% Not responsible for grandchildrenAmerican Indian / Alaska Native 32 27.2% Responsible for grandchildren85 72.8% Not responsible for grandchildrenOther race 21 11.2% Responsible for grandchildren167 88.8% Not responsible for grandchildrenTwo or more races 48 56.7% Responsible for grandchildren37 43.3% Not responsible for grandchildrenWhite alone, not Hispanic / Latino 135 64.8% Responsible for grandchildren73 35.2% Not responsible for grandchildrenHispanic or Latino 22 18.7% Responsible for grandchildren96 81.3% Not responsible for grandchildrenGrandparents (60 years and over) White / Caucasian 304 93.9% Responsible for grandchildren20 6.1% Not responsible for grandchildrenBlack or African American 35 45.6% Responsible for grandchildren42 54.4% Not responsible for grandchildrenAmerican Indian / Alaska Native 80 68.2% Responsible for grandchildren37 31.8% Not responsible for grandchildrenOther race 25 48.9% Responsible for grandchildren26 51.1% Not responsible for grandchildrenTwo or more races 11 100.0% Responsible for grandchildrenWhite alone, not Hispanic / Latino 303 93.9% Responsible for grandchildren20 6.1% Not responsible for grandchildrenHispanic or Latino 28 58.8% Responsible for grandchildren20 41.2% Not responsible for grandchildren