Races in Muskegon, Michigan (MI) Detailed Stats
Data:
Races - White alone (%)
Races - White alone (% change since 2000)
Races - Black alone (%)
Races - Black alone (% change since 2000)
Races - American Indian alone (%)
Races - American Indian alone (% change since 2000)
Races - Asian alone (%)
Races - Asian alone (% change since 2000)
Races - Hispanic (%)
Races - Hispanic (% change since 2000)
Races - Native Hawaiian and Other Pacific Islander alone (%)
Races - Native Hawaiian and Other Pacific Islander alone (% change since 2000)
Races - Two or more races(%)
Races - Two or more races(% change since 2000)
Races - Other race alone (%)
Races - Other race alone (% change since 2000)
Racial diversity
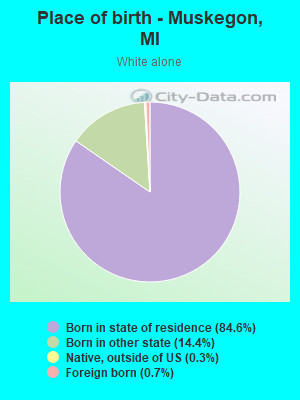
Place of birth - Born in state of residence (%)
Place of birth - Born in state of residence (%) - White
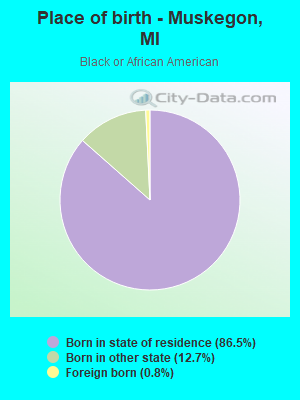
Place of birth - Born in state of residence (%) - Black or African American
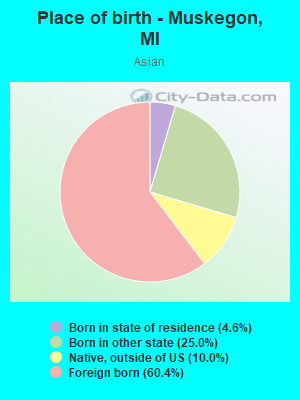
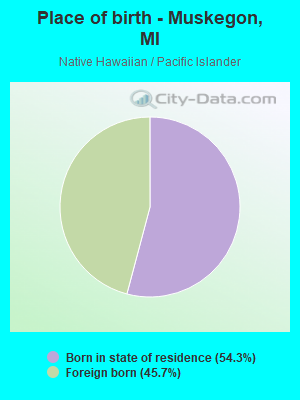
Place of birth - Born in state of residence (%) - Asian
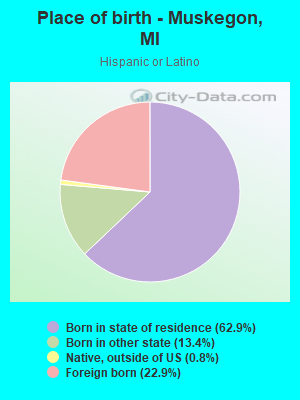
Place of birth - Born in state of residence (%) - Hispanic or Latino
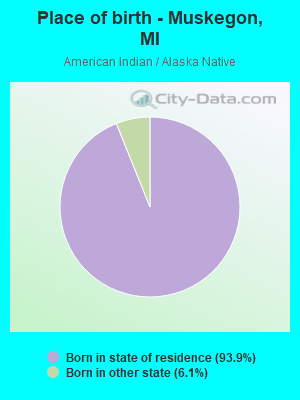
Place of birth - Born in state of residence (%) - American Indian and Alaska Native
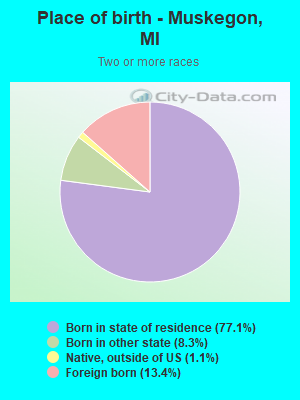
Place of birth - Born in state of residence (%) - Multirace
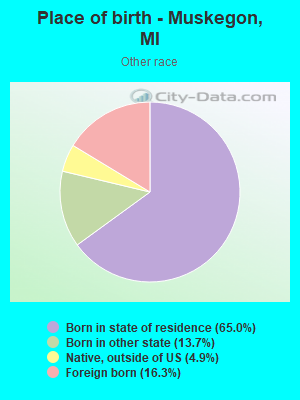
Place of birth - Born in state of residence (%) - Other Race
Place of birth - Born in other state (%)
Place of birth - Born in other state (%) - White
Place of birth - Born in other state (%) - Black or African American
Place of birth - Born in other state (%) - Asian
Place of birth - Born in other state (%) - Hispanic or Latino
Place of birth - Born in other state (%) - American Indian and Alaska Native
Place of birth - Born in other state (%) - Multirace
Place of birth - Born in other state (%) - Other Race
Place of birth - Native, outside of US (%)
Place of birth - Native, outside of US (%) - White
Place of birth - Native, outside of US (%) - Black or African American
Place of birth - Native, outside of US (%) - Asian
Place of birth - Native, outside of US (%) - Hispanic or Latino
Place of birth - Native, outside of US (%) - American Indian and Alaska Native
Place of birth - Native, outside of US (%) - Multirace
Place of birth - Native, outside of US (%) - Other Race
Place of birth - Foreign born (%)
Place of birth - Foreign born (%) - White
Place of birth - Foreign born (%) - Black or African American
Place of birth - Foreign born (%) - Asian
Place of birth - Foreign born (%) - Hispanic or Latino
Place of birth - Foreign born (%) - American Indian and Alaska Native
Place of birth - Foreign born (%) - Multirace
Place of birth - Foreign born (%) - Other Race
Residents speaking English at home (%)
Residents speaking English at home - Born in the United States (%)
Residents speaking English at home - Native, born elsewhere (%)
Residents speaking English at home - Foreign born (%)
Residents speaking Spanish at home (%)
Residents speaking Spanish at home - Born in the United States (%)
Residents speaking Spanish at home - Native, born elsewhere (%)
Residents speaking Spanish at home - Foreign born (%)
Residents speaking other language at home (%)
Residents speaking other language at home - Born in the United States (%)
Residents speaking other language at home - Native, born elsewhere (%)
Residents speaking other language at home - Foreign born (%)
Marital status - Never married (%)
Marital status - Now married (%)
Marital status - Separated (%)
Marital status - Widowed (%)
Marital status - Divorced (%)
Ancestries Reported - Arab (%)
Ancestries Reported - Czech (%)
Ancestries Reported - Danish (%)
Ancestries Reported - Dutch (%)
Ancestries Reported - English (%)
Ancestries Reported - French (%)
Ancestries Reported - French Canadian (%)
Ancestries Reported - German (%)
Ancestries Reported - Greek (%)
Ancestries Reported - Hungarian (%)
Ancestries Reported - Irish (%)
Ancestries Reported - Italian (%)
Ancestries Reported - Lithuanian (%)
Ancestries Reported - Norwegian (%)
Ancestries Reported - Polish (%)
Ancestries Reported - Portuguese (%)
Ancestries Reported - Russian (%)
Ancestries Reported - Scotch-Irish (%)
Ancestries Reported - Scottish (%)
Ancestries Reported - Slovak (%)
Ancestries Reported - Subsaharan African (%)
Ancestries Reported - Swedish (%)
Ancestries Reported - Swiss (%)
Ancestries Reported - Ukrainian (%)
Ancestries Reported - United States (%)
Ancestries Reported - Welsh (%)
Ancestries Reported - West Indian (%)
Ancestries Reported - Other (%)
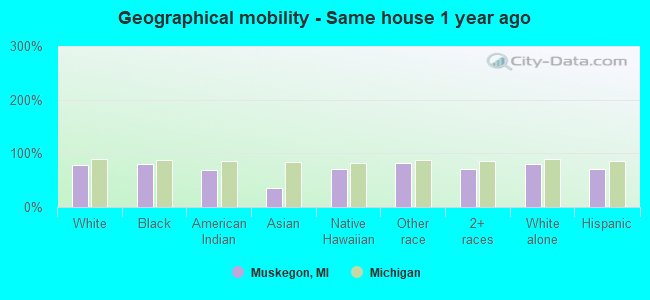
Geographical mobility - Same house 1 year ago (%)
Geographical mobility - Same house 1 year ago (%) - White
Geographical mobility - Same house 1 year ago (%) - Black or African American
Geographical mobility - Same house 1 year ago (%) - Asian
Geographical mobility - Same house 1 year ago (%) - Hispanic or Latino
Geographical mobility - Same house 1 year ago (%) - American Indian and Alaska Native
Geographical mobility - Same house 1 year ago (%) - Multirace
Geographical mobility - Same house 1 year ago (%) - Other Race
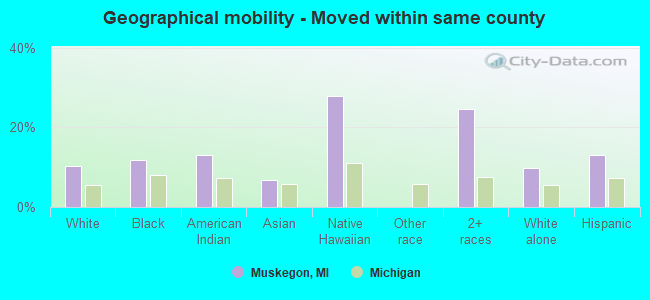
Geographical mobility - Moved within same county (%)
Geographical mobility - Moved within same county (%) - White
Geographical mobility - Moved within same county (%) - Black or African American
Geographical mobility - Moved within same county (%) - Asian
Geographical mobility - Moved within same county (%) - Hispanic or Latino
Geographical mobility - Moved within same county (%) - American Indian and Alaska Native
Geographical mobility - Moved within same county (%) - Multirace
Geographical mobility - Moved within same county (%) - Other Race
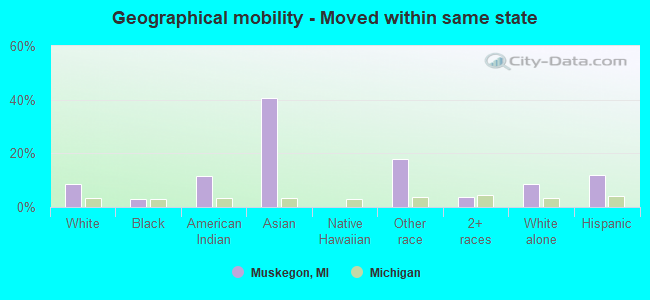
Geographical mobility - Moved from different county within same state (%)
Geographical mobility - Moved from different county within same state (%) - White
Geographical mobility - Moved from different county within same state (%) - Black or African American
Geographical mobility - Moved from different county within same state (%) - Asian
Geographical mobility - Moved from different county within same state (%) - Hispanic or Latino
Geographical mobility - Moved from different county within same state (%) - American Indian and Alaska Native
Geographical mobility - Moved from different county within same state (%) - Multirace
Geographical mobility - Moved from different county within same state (%) - Other Race
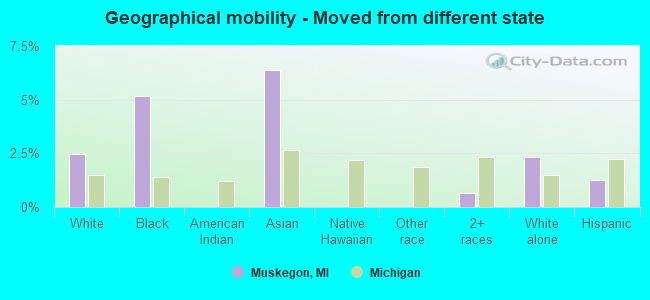
Geographical mobility - Moved from different state (%)
Geographical mobility - Moved from different state (%) - White
Geographical mobility - Moved from different state (%) - Black or African American
Geographical mobility - Moved from different state (%) - Asian
Geographical mobility - Moved from different state (%) - Hispanic or Latino
Geographical mobility - Moved from different state (%) - American Indian and Alaska Native
Geographical mobility - Moved from different state (%) - Multirace
Geographical mobility - Moved from different state (%) - Other Race
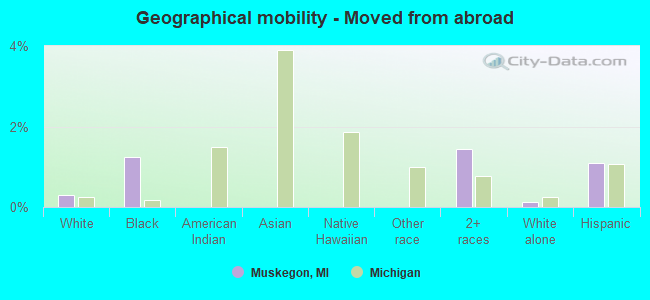
Geographical mobility - Moved from abroad (%)
Geographical mobility - Moved from abroad (%) - White
Geographical mobility - Moved from abroad (%) - Black or African American
Geographical mobility - Moved from abroad (%) - Asian
Geographical mobility - Moved from abroad (%) - Hispanic or Latino
Geographical mobility - Moved from abroad (%) - American Indian and Alaska Native
Geographical mobility - Moved from abroad (%) - Multirace
Geographical mobility - Moved from abroad (%) - Other Race
Place of birth for the foreign-born population - Ireland (%)
Place of birth for the foreign-born population - Denmark (%)
Place of birth for the foreign-born population - Norway (%)
Place of birth for the foreign-born population - Sweden (%)
Place of birth for the foreign-born population - United Kingdom (%)
Place of birth for the foreign-born population - England (%)
Place of birth for the foreign-born population - Scotland (%)
Place of birth for the foreign-born population - Other Northern Europe (%)
Place of birth for the foreign-born population - Austria (%)
Place of birth for the foreign-born population - Belgium (%)
Place of birth for the foreign-born population - France (%)
Place of birth for the foreign-born population - Germany (%)
Place of birth for the foreign-born population - Netherlands (%)
Place of birth for the foreign-born population - Switzerland (%)
Place of birth for the foreign-born population - Other Western Europe (%)
Place of birth for the foreign-born population - Greece (%)
Place of birth for the foreign-born population - Italy (%)
Place of birth for the foreign-born population - Portugal (%)
Place of birth for the foreign-born population - Spain (%)
Place of birth for the foreign-born population - Other Southern Europe (%)
Place of birth for the foreign-born population - Albania (%)
Place of birth for the foreign-born population - Belarus (%)
Place of birth for the foreign-born population - Bosnia and Herzegovina (%)
Place of birth for the foreign-born population - Bulgaria (%)
Place of birth for the foreign-born population - Croatia (%)
Place of birth for the foreign-born population - Czechoslovakia (%)
Place of birth for the foreign-born population - Hungary (%)
Place of birth for the foreign-born population - Latvia (%)
Place of birth for the foreign-born population - Lithuania (%)
Place of birth for the foreign-born population - North Macedonia (Macedonia) (%)
Place of birth for the foreign-born population - Moldova (%)
Place of birth for the foreign-born population - Poland (%)
Place of birth for the foreign-born population - Romania (%)
Place of birth for the foreign-born population - Russia (%)
Place of birth for the foreign-born population - Serbia (%)
Place of birth for the foreign-born population - Ukraine (%)
Place of birth for the foreign-born population - Other Eastern Europe (%)
Place of birth for the foreign-born population - China (%)
Place of birth for the foreign-born population - Hong Kong (%)
Place of birth for the foreign-born population - Taiwan (%)
Place of birth for the foreign-born population - Japan (%)
Place of birth for the foreign-born population - Korea (%)
Place of birth for the foreign-born population - Other Eastern Asia (%)
Place of birth for the foreign-born population - Afghanistan (%)
Place of birth for the foreign-born population - Bangladesh (%)
Place of birth for the foreign-born population - India (%)
Place of birth for the foreign-born population - Iran (%)
Place of birth for the foreign-born population - Kazakhstan (%)
Place of birth for the foreign-born population - Nepal (%)
Place of birth for the foreign-born population - Pakistan (%)
Place of birth for the foreign-born population - Sri Lanka (%)
Place of birth for the foreign-born population - Uzbekistan (%)
Place of birth for the foreign-born population - Other South Central Asia (%)
Place of birth for the foreign-born population - Burma (%)
Place of birth for the foreign-born population - Cambodia (%)
Place of birth for the foreign-born population - Indonesia (%)
Place of birth for the foreign-born population - Laos (%)
Place of birth for the foreign-born population - Malaysia (%)
Place of birth for the foreign-born population - Philippines (%)
Place of birth for the foreign-born population - Singapore (%)
Place of birth for the foreign-born population - Thailand (%)
Place of birth for the foreign-born population - Vietnam (%)
Place of birth for the foreign-born population - Other South Eastern Asia (%)
Place of birth for the foreign-born population - Armenia (%)
Place of birth for the foreign-born population - Iraq (%)
Place of birth for the foreign-born population - Israel (%)
Place of birth for the foreign-born population - Jordan (%)
Place of birth for the foreign-born population - Kuwait (%)
Place of birth for the foreign-born population - Lebanon (%)
Place of birth for the foreign-born population - Saudi Arabia (%)
Place of birth for the foreign-born population - Syria (%)
Place of birth for the foreign-born population - Turkey (%)
Place of birth for the foreign-born population - Yemen (%)
Place of birth for the foreign-born population - Other Western Asia (%)
Place of birth for the foreign-born population - Eritrea (%)
Place of birth for the foreign-born population - Ethiopia (%)
Place of birth for the foreign-born population - Kenya (%)
Place of birth for the foreign-born population - Somalia (%)
Place of birth for the foreign-born population - Uganda (%)
Place of birth for the foreign-born population - Zimbabwe (%)
Place of birth for the foreign-born population - Other Eastern Africa (%)
Place of birth for the foreign-born population - Cameroon (%)
Place of birth for the foreign-born population - Congo (%)
Place of birth for the foreign-born population - Democratic Republic of Congo (Zaire) (%)
Place of birth for the foreign-born population - Other Middle Africa (%)
Place of birth for the foreign-born population - Egypt (%)
Place of birth for the foreign-born population - Morocco (%)
Place of birth for the foreign-born population - Sudan (%)
Place of birth for the foreign-born population - Other Northern Africa (%)
Place of birth for the foreign-born population - South Africa (%)
Place of birth for the foreign-born population - Other Southern Africa (%)
Place of birth for the foreign-born population - Cabo Verde (%)
Place of birth for the foreign-born population - Ghana (%)
Place of birth for the foreign-born population - Liberia (%)
Place of birth for the foreign-born population - Nigeria (%)
Place of birth for the foreign-born population - Senegal (%)
Place of birth for the foreign-born population - Sierra Leone (%)
Place of birth for the foreign-born population - Other Western Africa (%)
Place of birth for the foreign-born population - Australia (%)
Place of birth for the foreign-born population - New Zealand (%)
Place of birth for the foreign-born population - Fiji (%)
Place of birth for the foreign-born population - Micronesia (%)
Place of birth for the foreign-born population - Bahamas (%)
Place of birth for the foreign-born population - Barbados (%)
Place of birth for the foreign-born population - Cuba (%)
Place of birth for the foreign-born population - Dominica (%)
Place of birth for the foreign-born population - Dominican Republic (%)
Place of birth for the foreign-born population - Grenada (%)
Place of birth for the foreign-born population - Haiti (%)
Place of birth for the foreign-born population - Jamaica (%)
Place of birth for the foreign-born population - St. Vincent and the Grenadines (%)
Place of birth for the foreign-born population - Trinidad and Tobago (%)
Place of birth for the foreign-born population - West Indies (%)
Place of birth for the foreign-born population - Other Caribbean (%)
Place of birth for the foreign-born population - Belize (%)
Place of birth for the foreign-born population - Costa Rica (%)
Place of birth for the foreign-born population - El Salvador (%)
Place of birth for the foreign-born population - Guatemala (%)
Place of birth for the foreign-born population - Honduras (%)
Place of birth for the foreign-born population - Mexico (%)
Place of birth for the foreign-born population - Nicaragua (%)
Place of birth for the foreign-born population - Panama (%)
Place of birth for the foreign-born population - Other Central America (%)
Place of birth for the foreign-born population - Argentina (%)
Place of birth for the foreign-born population - Bolivia (%)
Place of birth for the foreign-born population - Brazil (%)
Place of birth for the foreign-born population - Chile (%)
Place of birth for the foreign-born population - Colombia (%)
Place of birth for the foreign-born population - Ecuador (%)
Place of birth for the foreign-born population - Guyana (%)
Place of birth for the foreign-born population - Peru (%)
Place of birth for the foreign-born population - Uruguay (%)
Place of birth for the foreign-born population - Venezuela (%)
Place of birth for the foreign-born population - Other South America (%)
Place of birth for the foreign-born population - Canada (%)
Place of birth for the foreign-born population - Other Northern America (%)
Place of birth for the foreign-born population - Other (%)
Latest news about races in Muskegon, MI collected exclusively by city-data.com from local newspapers, TV, and radio stations
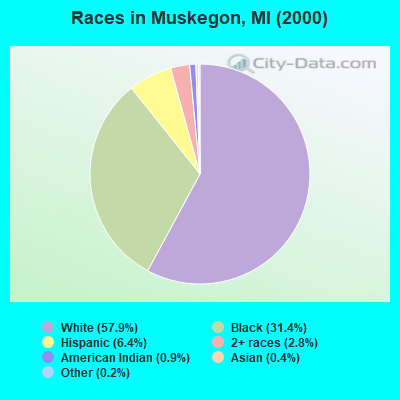
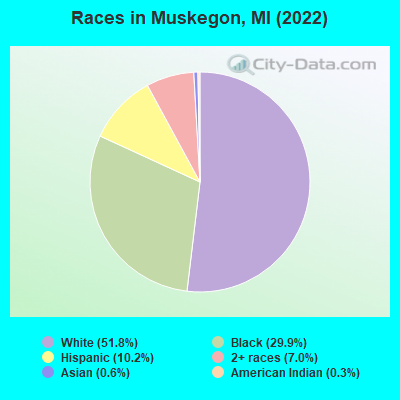
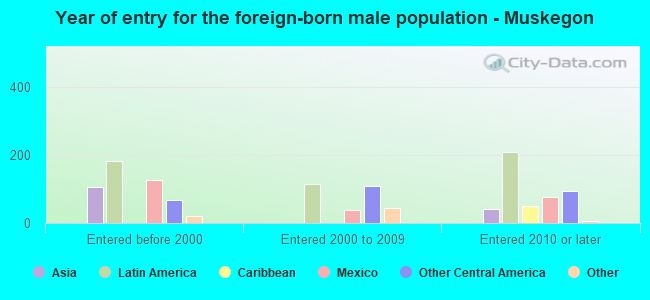
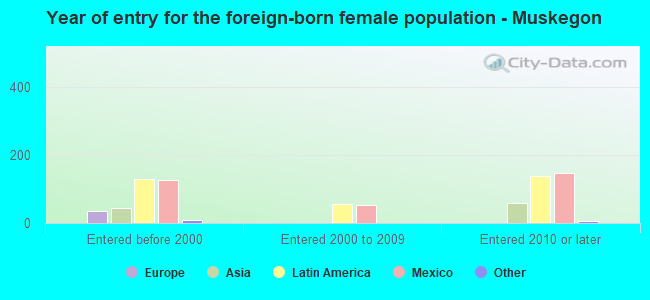
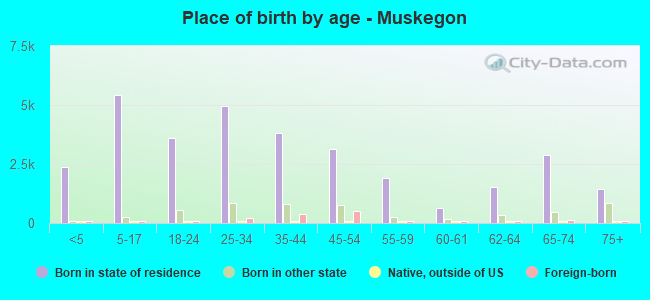
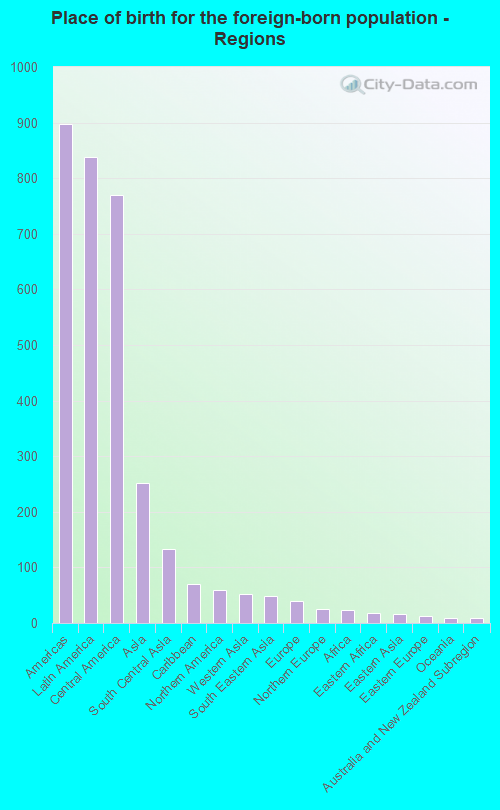
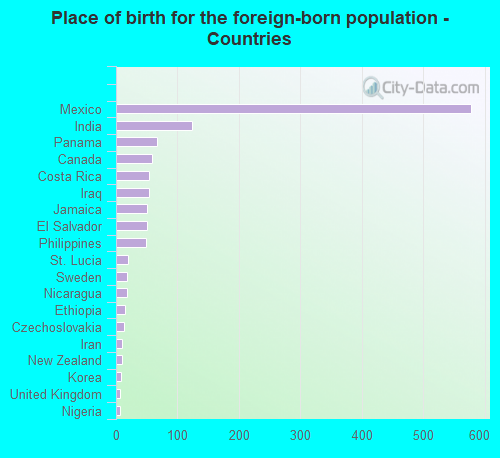
According to 2022 data, the most numerous races in Muskegon, MI are White alone (19,917 residents), Black alone (11,469 residents), and Hispanic (3,907 residents). 94.0% of Muskegon residents speak English at home. 3.2% of Muskegon, MI residents are foreign-born (2.2% born in Latin America, 0.7% born in Asia), which is 88.8% less than the foreign-born rate of 6.0% across the entire state of Michigan.
Race distribution in Muskegon
2000 2022
7,806,691 78.6% White alone 1,402,047 14.1% Black alone 323,877 3.3% Hispanic 175,311 1.8% Asian alone 163,487 1.6% Two or more races 53,421 0.5% American Indian alone 11,465 0.1% Other race alone 2,145 0.02% Native Hawaiian and Other
7,289,051 72.6% White alone 1,310,464 13.1% Black alone 572,405 5.7% Hispanic 450,031 4.5% Two or more races 335,732 3.3% Asian alone 45,217 0.5% Other race alone 29,011 0.3% American Indian alone 2,207 0.02% Native Hawaiian and Other
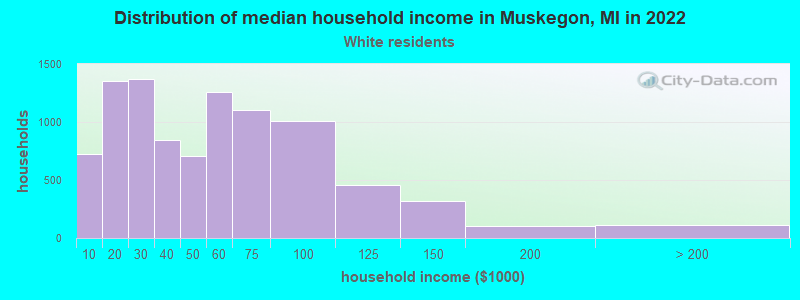
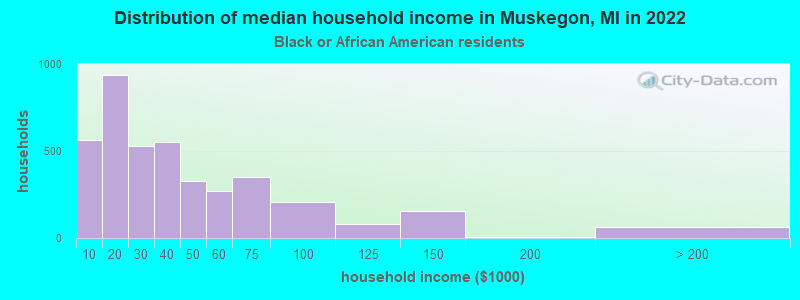
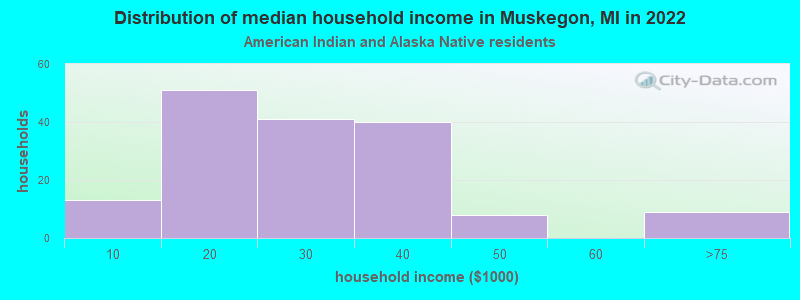
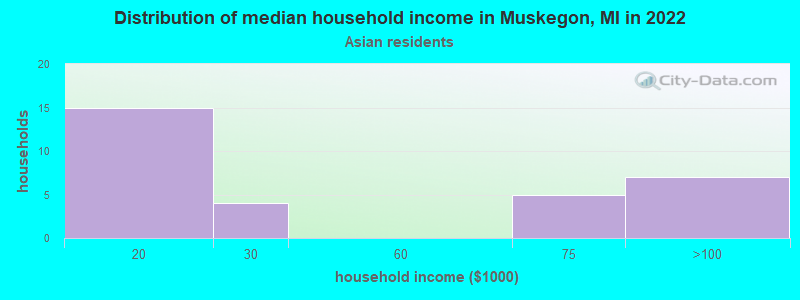
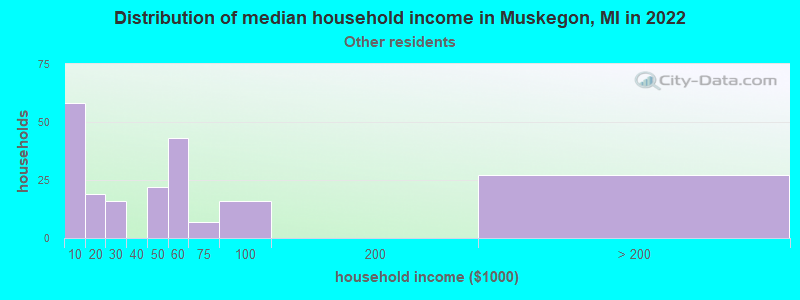
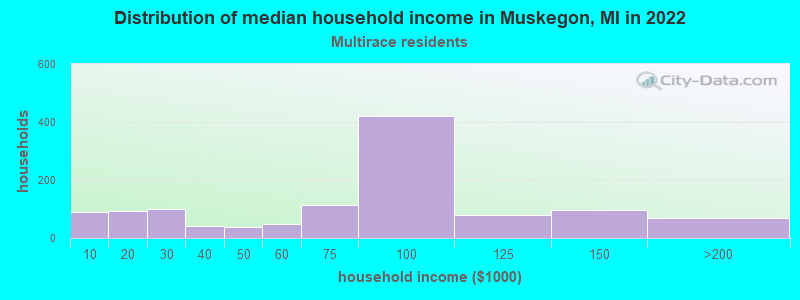
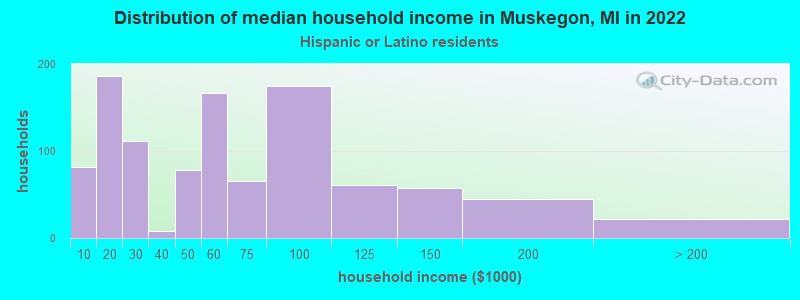
Income and house value in Muskegon Median household income in 2022 $43,826 White non-Hispanic householders$28,723 Black householders$31,393 American Indian and Alaska Native householders$46,630 Some other race householders$77,594 Two or more races householders$38,757 Hispanic or Latino race householdersMedian 2022 house value $117,884 White Non-Hispanic householders$99,662 Black or African American householders$98,733 American Indian or Alaska Native householders $139,453 Asian householders$158,047 Native Hawaiian and other Pacific Islander householders$76,978 Some other race householders$86,089 Two or more races householders$90,737 Hispanic or Latino householders
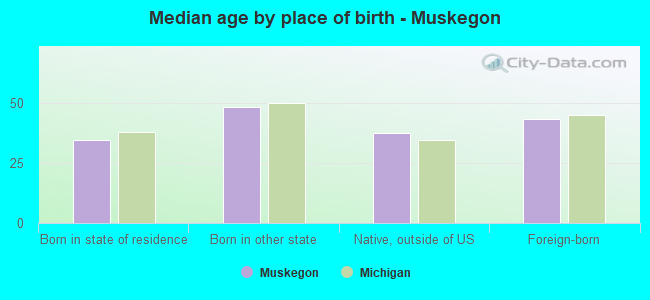
Median age by race in Muskegon
40.4 Median age for White residents39.9 42.0 36.6 Median age for Black or African American residents36.9 36.9 48.0 Median age for American Indian / Alaska Native residents54.3 36.1 42.7 Median age for Asian residents46.6 51.6 41.7 Median age for Native Hawaiian / Pacific Islander residents-666,666,666.0 43.5 37.4 Median age for Other race residents30.6 52.1 18.9 Median age for Two or more races residents17.9 19.3 41.8 Median age for White alone residents40.6 43.4 24.3 Median age for Hispanic or Latino residents23.1 24.7
Owner/renter occupied households by race in Muskegon
House owners and renters - White residents 5,353 61.2% Owner occupied3,395 38.8% Renter occupiedHouse owners and renters - Black or African American residents 1,703 44.0% Owner occupied2,164 56.0% Renter occupiedHouse owners and renters - American Indian / Alaska Native residents 89 55.8% Owner occupied70 44.2% Renter occupiedHouse owners and renters - Asian residents 3 10.2% Owner occupied29 89.8% Renter occupiedHouse owners and renters - Other race residents 94 44.8% Owner occupied115 55.2% Renter occupiedHouse owners and renters - Two or more races residents 602 55.2% Owner occupied488 44.8% Renter occupiedHouse owners and renters - White alone residents 5,087 60.6% Owner occupied3,311 39.4% Renter occupiedHouse owners and renters - Hispanic or Latino residents 488 52.6% Owner occupied440 47.4% Renter occupied
Language usage in Muskegon
English speakers - Total 94.0% of residents of Muskegon speak English at home.
5.6% of residents speak Spanish at home 1,293 64.5% Speak English very well713 35.5% Speak English less than very well1.2% of residents speak other language at home 149 35.8% Speak English very well267 64.2% Speak English less than very well
English speakers - Born in the United States 93.1% of residents of Muskegon speak English at home.
7.0% of residents speak Spanish at home 266 71.7% Speak English very well105 28.3% Speak English less than very well1.2% of residents speak other language at home 38 62.3% Speak English very well23 37.7% Speak English less than very well
English speakers - Native, born elsewhere 68.0% of residents of Muskegon speak English at home.
38.8% of residents speak Spanish at home 43 75.4% Speak English very well14 24.6% Speak English less than very well
English speakers - Foreign-born 20.0% of residents of Muskegon speak English at home.
65.1% of residents speak Spanish at home 335 42.4% Speak English very well455 57.6% Speak English less than very well17.5% of residents speak other language at home 72 34.0% Speak English very well140 66.0% Speak English less than very well
White (Caucasian) - Speak only English Native:
97.7% (19,648)Foreign-born:
22.9% (89)
White (Caucasian) - Speak another language Native:
2.3% (463)Foreign-born:
75.3% (294)
Black or African American - Speak only English Native:
99.4% (10,659)Foreign-born:
36.5% (35)
Black or African American - Speak another language Native:
0.7% (75)Foreign-born:
62.9% (60)
Asian - Speak only English Native:
68.8% (70)Foreign-born:
66.4% (82)
Asian - Speak another language Native:
32.1% (33)Foreign-born:
16.3% (20)
Other race - Speak another language Native:
45.1% (190)Foreign-born:
100.0% (79)
Two or more races - Speak only English Native:
85.1% (3,041)Foreign-born:
8.8% (54)
Two or more races - Speak another language Native:
14.6% (521)Foreign-born:
87.8% (539)
White alone - Speak only English Native:
99.1% (18,675)Foreign-born:
61.0% (88)
White alone - Speak another language Native:
0.9% (167)Foreign-born:
39.2% (56)
Hispanic or Latino - Speak only English Native:
66.6% (1,783)Foreign-born:
4.5% (39)
Hispanic or Latino - Speak another language Native:
34.7% (927)Foreign-born:
95.5% (820)
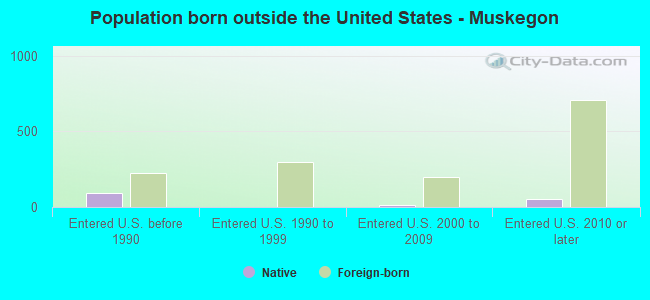
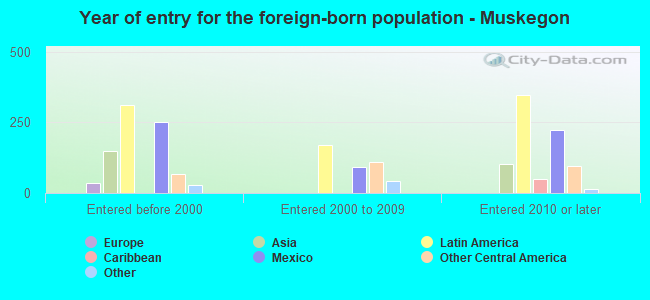
Foreign-born residents in Muskegon 1,221 residents are foreign born (2.2% Latin America , 0.7% Asia ).
This city:
3.2%Michigan:
6.9%
Marital status for residents in Muskegon Marital status - White (Caucasian) population 15 years and over
Males 42.7% Never married32.4% Now married0.9% Separated3.2% Widowed20.7% DivorcedFemales 33.6% Never married31.0% Now married0.9% Separated12.3% Widowed22.2% DivorcedWomen who gave birth in the past 12 months Now married:
35.1% (100)Unmarried:
64.9% (186)
Women who did not give birth in the past 12 months Now married:
28.3% (1,288)Unmarried:
71.7% (3,255)
Marital status - Black or African American population 15 years and over
Males 65.0% Never married16.3% Now married2.6% Separated2.0% Widowed14.1% DivorcedFemales 54.4% Never married17.2% Now married2.7% Separated10.8% Widowed14.8% DivorcedWomen who gave birth in the past 12 months Now married:
0.0% (0)Unmarried:
100.0% (152)
Women who did not give birth in the past 12 months Now married:
16.2% (385)Unmarried:
83.8% (1,991)
Marital status - American Indian / Alaska Native population 15 years and over
Males 55.9% Never married0.0% Now married6.6% Separated0.0% Widowed37.5% DivorcedFemales 40.0% Never married55.0% Now married0.0% Separated0.0% Widowed5.0% DivorcedWomen who did not give birth in the past 12 months Now married:
50.0% (25)Unmarried:
50.0% (25)
Marital status - Asian population 15 years and over
Males 33.7% Never married5.3% Now married0.0% Separated0.0% Widowed61.0% DivorcedFemales 43.2% Never married36.4% Now married0.0% Separated20.5% Widowed0.0% DivorcedWomen who gave birth in the past 12 months Now married:
100.0% (5)Unmarried:
0.0% (0)
Women who did not give birth in the past 12 months Now married:
18.9% (7)Unmarried:
81.1% (31)
Marital status - Other race population 15 years and over
Males 68.0% Never married22.7% Now married0.0% Separated1.0% Widowed8.2% DivorcedFemales 36.6% Never married23.5% Now married19.0% Separated20.9% Widowed0.0% DivorcedWomen who did not give birth in the past 12 months Now married:
53.7% (78)Unmarried:
46.3% (67)
Marital status - Two or more races population 15 years and over
Males 45.9% Never married40.7% Now married5.6% Separated1.4% Widowed6.5% DivorcedFemales 60.7% Never married29.5% Now married6.4% Separated1.4% Widowed2.1% DivorcedWomen who gave birth in the past 12 months Now married:
66.0% (84)Unmarried:
34.0% (43)
Women who did not give birth in the past 12 months Now married:
30.9% (378)Unmarried:
69.1% (844)
Marital status - White alone, not Hispanic / Latino population 15 years and over
Males 42.1% Never married33.2% Now married0.7% Separated3.5% Widowed20.5% DivorcedFemales 32.3% Never married31.3% Now married0.8% Separated12.2% Widowed23.3% DivorcedWomen who gave birth in the past 12 months Now married:
35.1% (101)Unmarried:
64.9% (188)
Women who did not give birth in the past 12 months Now married:
28.2% (1,190)Unmarried:
71.8% (3,024)
Marital status - Hispanic or Latino population 15 years and over
Males 47.0% Never married34.7% Now married3.9% Separated0.1% Widowed14.3% DivorcedFemales 44.9% Never married36.5% Now married7.3% Separated8.8% Widowed2.4% DivorcedWomen who gave birth in the past 12 months Now married:
66.0% (65)Unmarried:
34.0% (33)
Women who did not give birth in the past 12 months Now married:
46.9% (373)Unmarried:
53.1% (423)
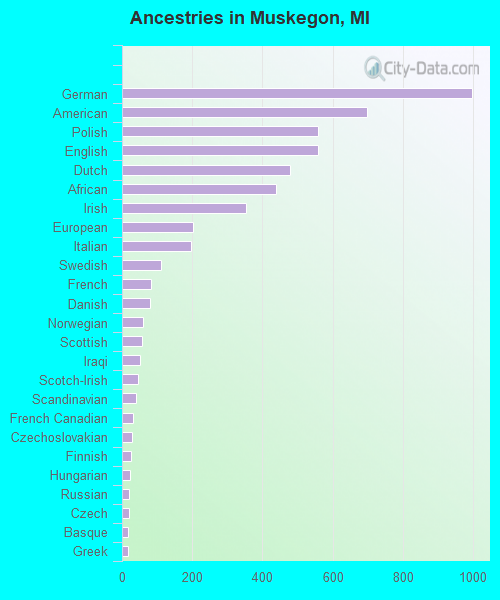
Ancestries in Muskegon
996 5.8% German698 4.1% American559 3.3% Polish559 3.3% English478 2.8% Dutch438 2.6% African353 2.1% Irish201 1.2% European197 1.2% Italian112 0.7% Swedish84 0.5% French80 0.5% Danish60 0.4% Norwegian57 0.3% Scottish52 0.3% Iraqi46 0.3% Scotch-Irish39 0.2% Scandinavian30 0.2% French Canadian28 0.2% Czechoslovakian25 0.1% Finnish24 0.1% Hungarian20 0.1% Russian19 0.1% Czech18 0.1% Basque17 0.10% Greek17 0.10% Slovene16 0.09% Austrian14 0.08% Australian14 0.08% Yugoslavian13 0.08% Slovak10 0.06% Iranian10 0.06% Swiss9 0.05% Moroccan8 0.05% Lithuanian7 0.04% Celtic7 0.04% Nigerian7 0.04% British6 0.04% Belgian6 0.04% Eastern European3 0.02% Trinidadian and Tobagonian2 0.01% Romanian
Geographical mobility in Muskegon Same house 1 year ago 16,777 78.6% White (Caucasian)9,152 80.9% Black or African American141 69.4% American Indian / Alaska Native100 35.2% Asian26 71.3% Native Hawaiian / Pacific Islander399 82.0% Other race3,319 70.9% Two or more races15,623 79.4% White alone, not Hispanic / Latino2,671 70.6% Hispanic or LatinoMoved within same county 2,210 10.3% White / Caucasian1,334 11.8% Black or African American27 13.2% American Indian / Alaska Native19 6.7% Asian10 27.8% Native Hawaiian / Pacific Islander1,154 24.6% Two or more races1,951 9.9% White alone, not Hispanic / Latino495 13.1% Hispanic or LatinoMoved within same state 1,845 8.6% White / Caucasian323 2.9% Black or African American23 11.4% American Indian / Alaska Native115 40.7% Asian87 17.9% Other race175 3.7% Two or more races1,704 8.7% White alone, not Hispanic / Latino456 12.0% Hispanic or LatinoMoved from different state 527 2.5% White / Caucasian583 5.2% Black or African American18 6.4% Asian31 0.7% Two or more races459 2.3% White alone, not Hispanic / Latino48 1.3% Hispanic or LatinoMoved from abroad 62 0.3% White141 1.2% Black or African American67 1.4% Two or more races22 0.1% White alone, not Hispanic / Latino41 1.1% Hispanic or Latino
Children Nativity (place of birth) in Muskegon
Children under 6 years - Living with two parents Both parents native 933 100.0% Native0 0.0% Foreign-bornBoth parents foreign-born 56 82.4% Native12 17.6% Foreign-bornOne native, one foreign-born parent 177 100.0% NativeChildren under 6 years - Living with one parent Native parent 1,679 100.0% NativeForeign-born parent 17 100.0% Foreign-bornChildren 6 to 17 years - Living with two parents Both parents native 1,497 100.0% NativeBoth parents foreign-born 234 89.6% Native27 10.4% Foreign-bornOne native, one foreign-born parent 116 100.0% NativeChildren 6 to 17 years - Living with one parent Native parent 2,750 100.0% NativeForeign-born parent 66 49.3% Native68 50.7% Foreign-born
Grandparents responsible for own grandchildren in Muskegon
Grandparents (30 to 59 years) White / Caucasian 143 48.2% Responsible for grandchildren154 51.8% Not responsible for grandchildrenBlack or African American 39 58.1% Responsible for grandchildren28 41.9% Not responsible for grandchildrenTwo or more races 15 9.5% Responsible for grandchildren139 90.5% Not responsible for grandchildrenWhite alone, not Hispanic / Latino 143 67.7% Responsible for grandchildren68 32.3% Not responsible for grandchildrenHispanic or Latino 180 100.0% Not responsible for grandchildrenGrandparents (60 years and over) White / Caucasian 10 8.0% Responsible for grandchildren114 92.0% Not responsible for grandchildrenBlack or African American 131 75.5% Responsible for grandchildren42 24.5% Not responsible for grandchildrenWhite alone, not Hispanic / Latino 10 14.8% Responsible for grandchildren57 85.2% Not responsible for grandchildrenHispanic or Latino 63 100.0% Not responsible for grandchildren