Races in Mountlake Terrace, Washington (WA) Detailed Stats
Data:
Races - White alone (%)
Races - White alone (% change since 2000)
Races - Black alone (%)
Races - Black alone (% change since 2000)
Races - American Indian alone (%)
Races - American Indian alone (% change since 2000)
Races - Asian alone (%)
Races - Asian alone (% change since 2000)
Races - Hispanic (%)
Races - Hispanic (% change since 2000)
Races - Native Hawaiian and Other Pacific Islander alone (%)
Races - Native Hawaiian and Other Pacific Islander alone (% change since 2000)
Races - Two or more races(%)
Races - Two or more races(% change since 2000)
Races - Other race alone (%)
Races - Other race alone (% change since 2000)
Racial diversity
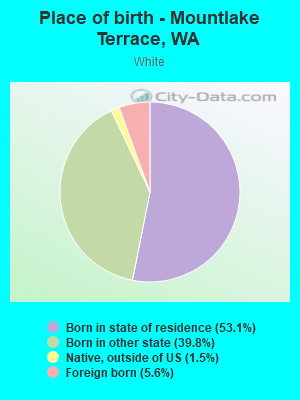
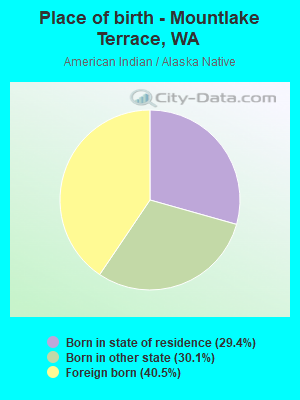
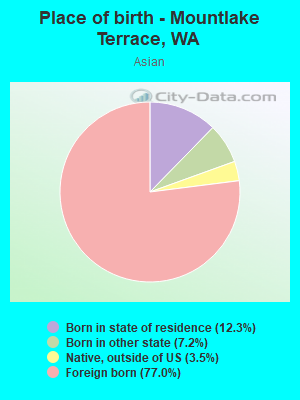
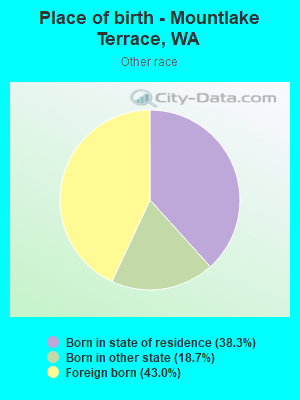
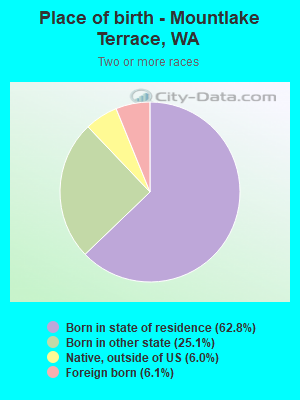
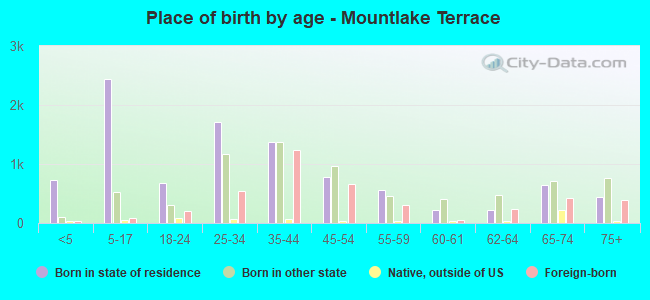
Place of birth - Born in state of residence (%)
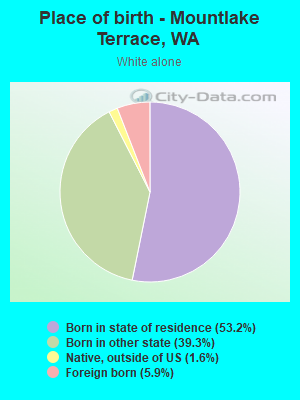
Place of birth - Born in state of residence (%) - White
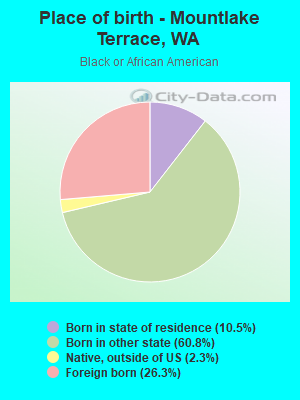
Place of birth - Born in state of residence (%) - Black or African American
Place of birth - Born in state of residence (%) - Asian
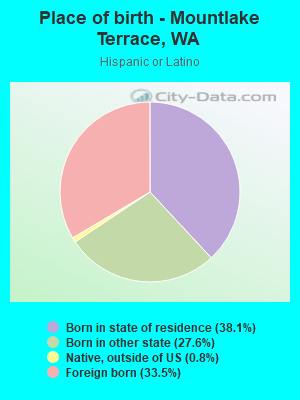
Place of birth - Born in state of residence (%) - Hispanic or Latino
Place of birth - Born in state of residence (%) - American Indian and Alaska Native
Place of birth - Born in state of residence (%) - Multirace
Place of birth - Born in state of residence (%) - Other Race
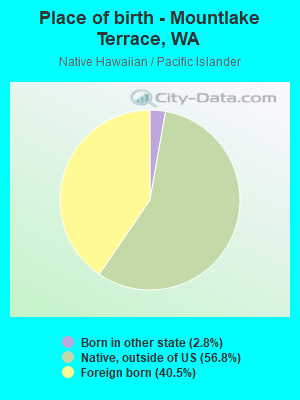
Place of birth - Born in other state (%)
Place of birth - Born in other state (%) - White
Place of birth - Born in other state (%) - Black or African American
Place of birth - Born in other state (%) - Asian
Place of birth - Born in other state (%) - Hispanic or Latino
Place of birth - Born in other state (%) - American Indian and Alaska Native
Place of birth - Born in other state (%) - Multirace
Place of birth - Born in other state (%) - Other Race
Place of birth - Native, outside of US (%)
Place of birth - Native, outside of US (%) - White
Place of birth - Native, outside of US (%) - Black or African American
Place of birth - Native, outside of US (%) - Asian
Place of birth - Native, outside of US (%) - Hispanic or Latino
Place of birth - Native, outside of US (%) - American Indian and Alaska Native
Place of birth - Native, outside of US (%) - Multirace
Place of birth - Native, outside of US (%) - Other Race
Place of birth - Foreign born (%)
Place of birth - Foreign born (%) - White
Place of birth - Foreign born (%) - Black or African American
Place of birth - Foreign born (%) - Asian
Place of birth - Foreign born (%) - Hispanic or Latino
Place of birth - Foreign born (%) - American Indian and Alaska Native
Place of birth - Foreign born (%) - Multirace
Place of birth - Foreign born (%) - Other Race
Residents speaking English at home (%)
Residents speaking English at home - Born in the United States (%)
Residents speaking English at home - Native, born elsewhere (%)
Residents speaking English at home - Foreign born (%)
Residents speaking Spanish at home (%)
Residents speaking Spanish at home - Born in the United States (%)
Residents speaking Spanish at home - Native, born elsewhere (%)
Residents speaking Spanish at home - Foreign born (%)
Residents speaking other language at home (%)
Residents speaking other language at home - Born in the United States (%)
Residents speaking other language at home - Native, born elsewhere (%)
Residents speaking other language at home - Foreign born (%)
Marital status - Never married (%)
Marital status - Now married (%)
Marital status - Separated (%)
Marital status - Widowed (%)
Marital status - Divorced (%)
Ancestries Reported - Arab (%)
Ancestries Reported - Czech (%)
Ancestries Reported - Danish (%)
Ancestries Reported - Dutch (%)
Ancestries Reported - English (%)
Ancestries Reported - French (%)
Ancestries Reported - French Canadian (%)
Ancestries Reported - German (%)
Ancestries Reported - Greek (%)
Ancestries Reported - Hungarian (%)
Ancestries Reported - Irish (%)
Ancestries Reported - Italian (%)
Ancestries Reported - Lithuanian (%)
Ancestries Reported - Norwegian (%)
Ancestries Reported - Polish (%)
Ancestries Reported - Portuguese (%)
Ancestries Reported - Russian (%)
Ancestries Reported - Scotch-Irish (%)
Ancestries Reported - Scottish (%)
Ancestries Reported - Slovak (%)
Ancestries Reported - Subsaharan African (%)
Ancestries Reported - Swedish (%)
Ancestries Reported - Swiss (%)
Ancestries Reported - Ukrainian (%)
Ancestries Reported - United States (%)
Ancestries Reported - Welsh (%)
Ancestries Reported - West Indian (%)
Ancestries Reported - Other (%)
Geographical mobility - Same house 1 year ago (%)
Geographical mobility - Same house 1 year ago (%) - White
Geographical mobility - Same house 1 year ago (%) - Black or African American
Geographical mobility - Same house 1 year ago (%) - Asian
Geographical mobility - Same house 1 year ago (%) - Hispanic or Latino
Geographical mobility - Same house 1 year ago (%) - American Indian and Alaska Native
Geographical mobility - Same house 1 year ago (%) - Multirace
Geographical mobility - Same house 1 year ago (%) - Other Race
Geographical mobility - Moved within same county (%)
Geographical mobility - Moved within same county (%) - White
Geographical mobility - Moved within same county (%) - Black or African American
Geographical mobility - Moved within same county (%) - Asian
Geographical mobility - Moved within same county (%) - Hispanic or Latino
Geographical mobility - Moved within same county (%) - American Indian and Alaska Native
Geographical mobility - Moved within same county (%) - Multirace
Geographical mobility - Moved within same county (%) - Other Race
Geographical mobility - Moved from different county within same state (%)
Geographical mobility - Moved from different county within same state (%) - White
Geographical mobility - Moved from different county within same state (%) - Black or African American
Geographical mobility - Moved from different county within same state (%) - Asian
Geographical mobility - Moved from different county within same state (%) - Hispanic or Latino
Geographical mobility - Moved from different county within same state (%) - American Indian and Alaska Native
Geographical mobility - Moved from different county within same state (%) - Multirace
Geographical mobility - Moved from different county within same state (%) - Other Race
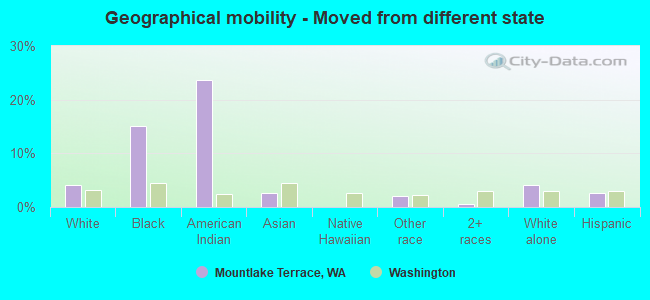
Geographical mobility - Moved from different state (%)
Geographical mobility - Moved from different state (%) - White
Geographical mobility - Moved from different state (%) - Black or African American
Geographical mobility - Moved from different state (%) - Asian
Geographical mobility - Moved from different state (%) - Hispanic or Latino
Geographical mobility - Moved from different state (%) - American Indian and Alaska Native
Geographical mobility - Moved from different state (%) - Multirace
Geographical mobility - Moved from different state (%) - Other Race
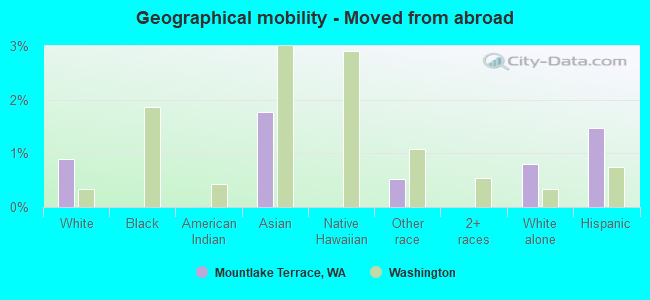
Geographical mobility - Moved from abroad (%)
Geographical mobility - Moved from abroad (%) - White
Geographical mobility - Moved from abroad (%) - Black or African American
Geographical mobility - Moved from abroad (%) - Asian
Geographical mobility - Moved from abroad (%) - Hispanic or Latino
Geographical mobility - Moved from abroad (%) - American Indian and Alaska Native
Geographical mobility - Moved from abroad (%) - Multirace
Geographical mobility - Moved from abroad (%) - Other Race
Place of birth for the foreign-born population - Ireland (%)
Place of birth for the foreign-born population - Denmark (%)
Place of birth for the foreign-born population - Norway (%)
Place of birth for the foreign-born population - Sweden (%)
Place of birth for the foreign-born population - United Kingdom (%)
Place of birth for the foreign-born population - England (%)
Place of birth for the foreign-born population - Scotland (%)
Place of birth for the foreign-born population - Other Northern Europe (%)
Place of birth for the foreign-born population - Austria (%)
Place of birth for the foreign-born population - Belgium (%)
Place of birth for the foreign-born population - France (%)
Place of birth for the foreign-born population - Germany (%)
Place of birth for the foreign-born population - Netherlands (%)
Place of birth for the foreign-born population - Switzerland (%)
Place of birth for the foreign-born population - Other Western Europe (%)
Place of birth for the foreign-born population - Greece (%)
Place of birth for the foreign-born population - Italy (%)
Place of birth for the foreign-born population - Portugal (%)
Place of birth for the foreign-born population - Spain (%)
Place of birth for the foreign-born population - Other Southern Europe (%)
Place of birth for the foreign-born population - Albania (%)
Place of birth for the foreign-born population - Belarus (%)
Place of birth for the foreign-born population - Bosnia and Herzegovina (%)
Place of birth for the foreign-born population - Bulgaria (%)
Place of birth for the foreign-born population - Croatia (%)
Place of birth for the foreign-born population - Czechoslovakia (%)
Place of birth for the foreign-born population - Hungary (%)
Place of birth for the foreign-born population - Latvia (%)
Place of birth for the foreign-born population - Lithuania (%)
Place of birth for the foreign-born population - North Macedonia (Macedonia) (%)
Place of birth for the foreign-born population - Moldova (%)
Place of birth for the foreign-born population - Poland (%)
Place of birth for the foreign-born population - Romania (%)
Place of birth for the foreign-born population - Russia (%)
Place of birth for the foreign-born population - Serbia (%)
Place of birth for the foreign-born population - Ukraine (%)
Place of birth for the foreign-born population - Other Eastern Europe (%)
Place of birth for the foreign-born population - China (%)
Place of birth for the foreign-born population - Hong Kong (%)
Place of birth for the foreign-born population - Taiwan (%)
Place of birth for the foreign-born population - Japan (%)
Place of birth for the foreign-born population - Korea (%)
Place of birth for the foreign-born population - Other Eastern Asia (%)
Place of birth for the foreign-born population - Afghanistan (%)
Place of birth for the foreign-born population - Bangladesh (%)
Place of birth for the foreign-born population - India (%)
Place of birth for the foreign-born population - Iran (%)
Place of birth for the foreign-born population - Kazakhstan (%)
Place of birth for the foreign-born population - Nepal (%)
Place of birth for the foreign-born population - Pakistan (%)
Place of birth for the foreign-born population - Sri Lanka (%)
Place of birth for the foreign-born population - Uzbekistan (%)
Place of birth for the foreign-born population - Other South Central Asia (%)
Place of birth for the foreign-born population - Burma (%)
Place of birth for the foreign-born population - Cambodia (%)
Place of birth for the foreign-born population - Indonesia (%)
Place of birth for the foreign-born population - Laos (%)
Place of birth for the foreign-born population - Malaysia (%)
Place of birth for the foreign-born population - Philippines (%)
Place of birth for the foreign-born population - Singapore (%)
Place of birth for the foreign-born population - Thailand (%)
Place of birth for the foreign-born population - Vietnam (%)
Place of birth for the foreign-born population - Other South Eastern Asia (%)
Place of birth for the foreign-born population - Armenia (%)
Place of birth for the foreign-born population - Iraq (%)
Place of birth for the foreign-born population - Israel (%)
Place of birth for the foreign-born population - Jordan (%)
Place of birth for the foreign-born population - Kuwait (%)
Place of birth for the foreign-born population - Lebanon (%)
Place of birth for the foreign-born population - Saudi Arabia (%)
Place of birth for the foreign-born population - Syria (%)
Place of birth for the foreign-born population - Turkey (%)
Place of birth for the foreign-born population - Yemen (%)
Place of birth for the foreign-born population - Other Western Asia (%)
Place of birth for the foreign-born population - Eritrea (%)
Place of birth for the foreign-born population - Ethiopia (%)
Place of birth for the foreign-born population - Kenya (%)
Place of birth for the foreign-born population - Somalia (%)
Place of birth for the foreign-born population - Uganda (%)
Place of birth for the foreign-born population - Zimbabwe (%)
Place of birth for the foreign-born population - Other Eastern Africa (%)
Place of birth for the foreign-born population - Cameroon (%)
Place of birth for the foreign-born population - Congo (%)
Place of birth for the foreign-born population - Democratic Republic of Congo (Zaire) (%)
Place of birth for the foreign-born population - Other Middle Africa (%)
Place of birth for the foreign-born population - Egypt (%)
Place of birth for the foreign-born population - Morocco (%)
Place of birth for the foreign-born population - Sudan (%)
Place of birth for the foreign-born population - Other Northern Africa (%)
Place of birth for the foreign-born population - South Africa (%)
Place of birth for the foreign-born population - Other Southern Africa (%)
Place of birth for the foreign-born population - Cabo Verde (%)
Place of birth for the foreign-born population - Ghana (%)
Place of birth for the foreign-born population - Liberia (%)
Place of birth for the foreign-born population - Nigeria (%)
Place of birth for the foreign-born population - Senegal (%)
Place of birth for the foreign-born population - Sierra Leone (%)
Place of birth for the foreign-born population - Other Western Africa (%)
Place of birth for the foreign-born population - Australia (%)
Place of birth for the foreign-born population - New Zealand (%)
Place of birth for the foreign-born population - Fiji (%)
Place of birth for the foreign-born population - Micronesia (%)
Place of birth for the foreign-born population - Bahamas (%)
Place of birth for the foreign-born population - Barbados (%)
Place of birth for the foreign-born population - Cuba (%)
Place of birth for the foreign-born population - Dominica (%)
Place of birth for the foreign-born population - Dominican Republic (%)
Place of birth for the foreign-born population - Grenada (%)
Place of birth for the foreign-born population - Haiti (%)
Place of birth for the foreign-born population - Jamaica (%)
Place of birth for the foreign-born population - St. Vincent and the Grenadines (%)
Place of birth for the foreign-born population - Trinidad and Tobago (%)
Place of birth for the foreign-born population - West Indies (%)
Place of birth for the foreign-born population - Other Caribbean (%)
Place of birth for the foreign-born population - Belize (%)
Place of birth for the foreign-born population - Costa Rica (%)
Place of birth for the foreign-born population - El Salvador (%)
Place of birth for the foreign-born population - Guatemala (%)
Place of birth for the foreign-born population - Honduras (%)
Place of birth for the foreign-born population - Mexico (%)
Place of birth for the foreign-born population - Nicaragua (%)
Place of birth for the foreign-born population - Panama (%)
Place of birth for the foreign-born population - Other Central America (%)
Place of birth for the foreign-born population - Argentina (%)
Place of birth for the foreign-born population - Bolivia (%)
Place of birth for the foreign-born population - Brazil (%)
Place of birth for the foreign-born population - Chile (%)
Place of birth for the foreign-born population - Colombia (%)
Place of birth for the foreign-born population - Ecuador (%)
Place of birth for the foreign-born population - Guyana (%)
Place of birth for the foreign-born population - Peru (%)
Place of birth for the foreign-born population - Uruguay (%)
Place of birth for the foreign-born population - Venezuela (%)
Place of birth for the foreign-born population - Other South America (%)
Place of birth for the foreign-born population - Canada (%)
Place of birth for the foreign-born population - Other Northern America (%)
Place of birth for the foreign-born population - Other (%)
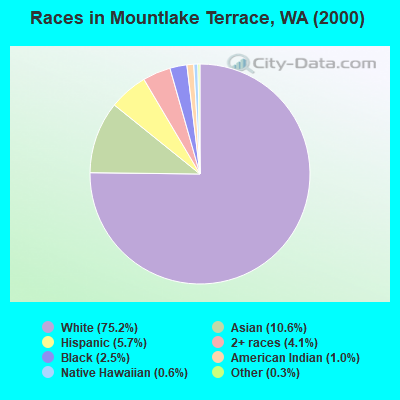
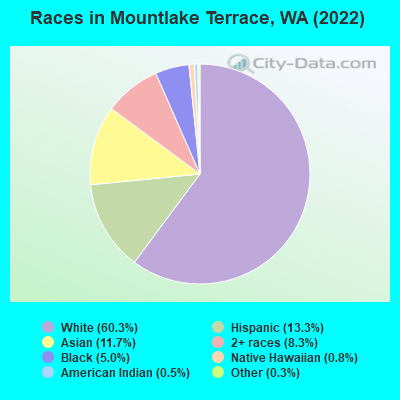
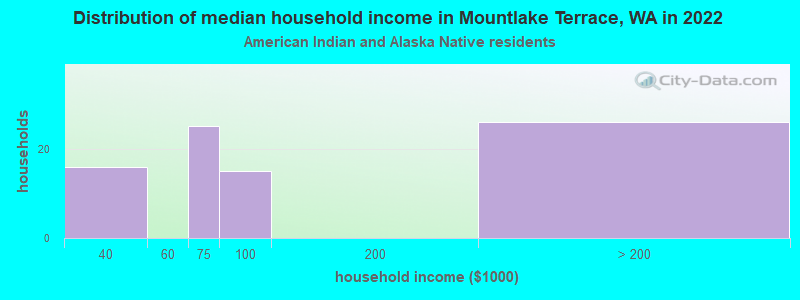
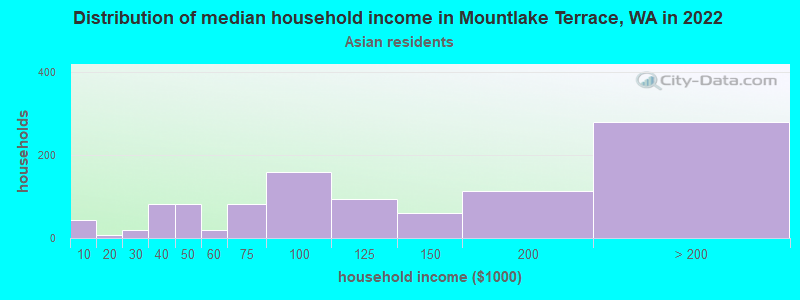
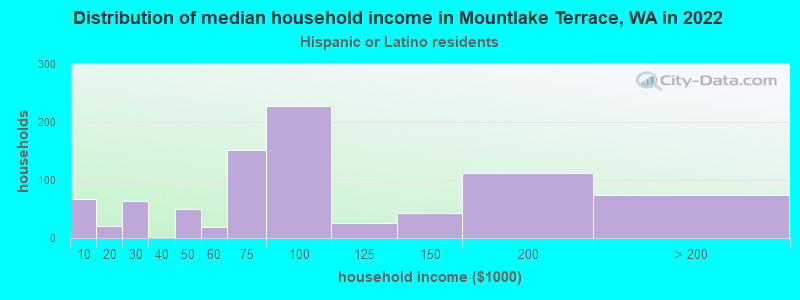
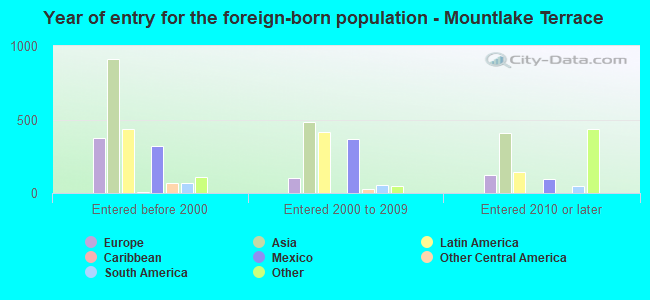
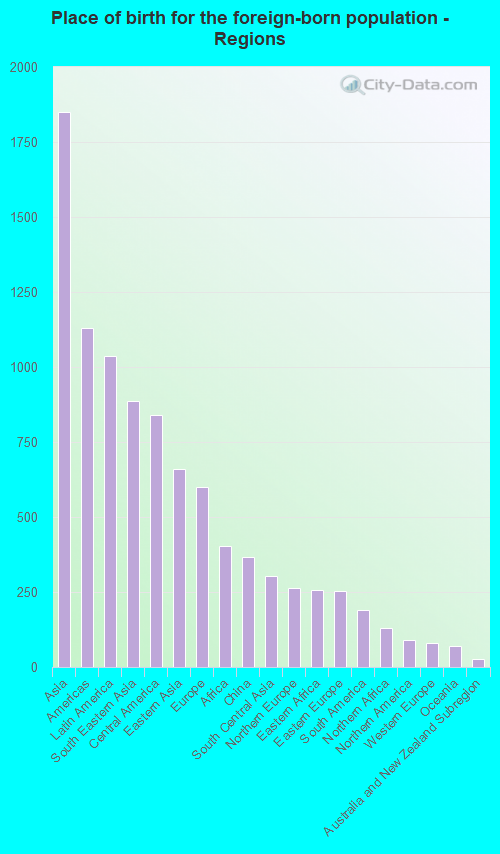
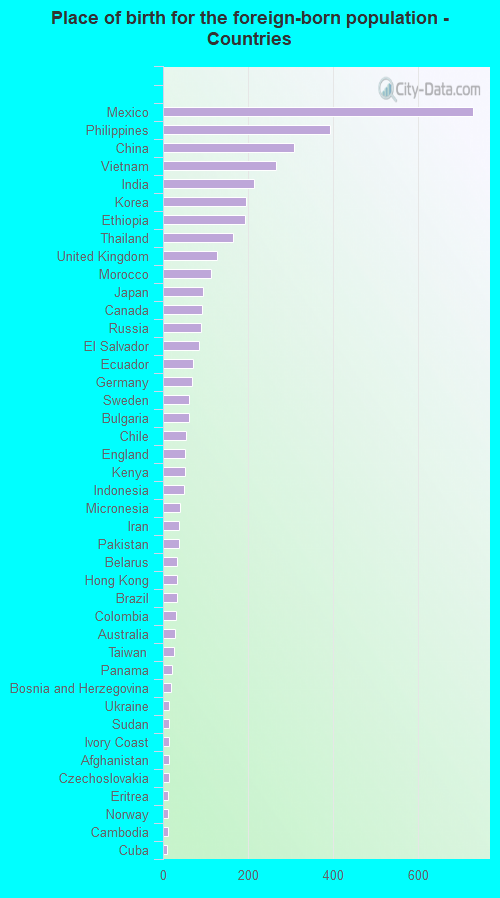
According to 2022 data, the most numerous races in Mountlake Terrace, WA are White alone (13,065 residents), Hispanic (2,879 residents), and Asian alone (2,531 residents). 76.9% of Mountlake Terrace residents speak English at home. 18.7% of Mountlake Terrace, WA residents are foreign-born (8.3% born in Asia, 4.7% born in Latin America, 2.7% born in Europe), which is 19.8% greater than the foreign-born rate of 15.0% across the entire state of Washington.
Race distribution in Mountlake Terrace
2000 2022
4,652,490 78.9% White alone 441,509 7.5% Hispanic 319,401 5.4% Asian alone 184,631 3.1% Black alone 175,926 3.0% Two or more races 85,396 1.4% American Indian alone 22,779 0.4% Native Hawaiian and Other 11,989 0.2% Other race alone
4,941,456 63.5% White alone 1,093,313 14.0% Hispanic 755,832 9.7% Asian alone 523,448 6.7% Two or more races 299,537 3.8% Black alone 69,024 0.9% American Indian alone 52,231 0.7% Native Hawaiian and Other 50,945 0.7% Other race alone
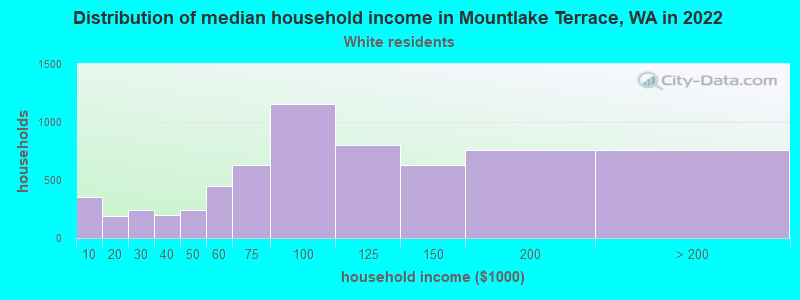
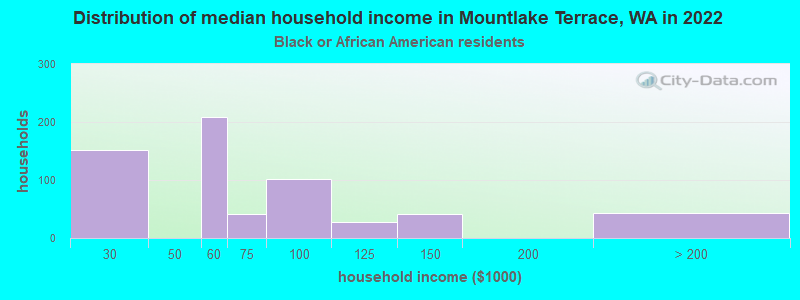
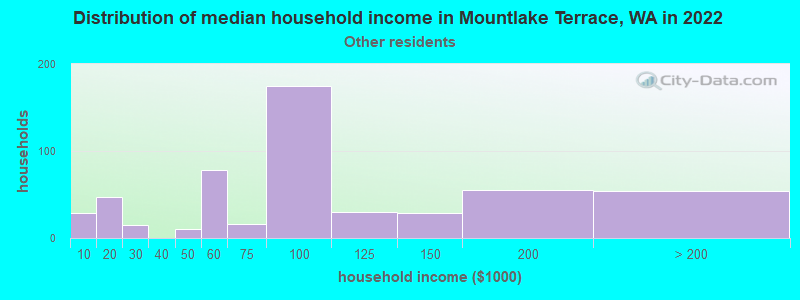
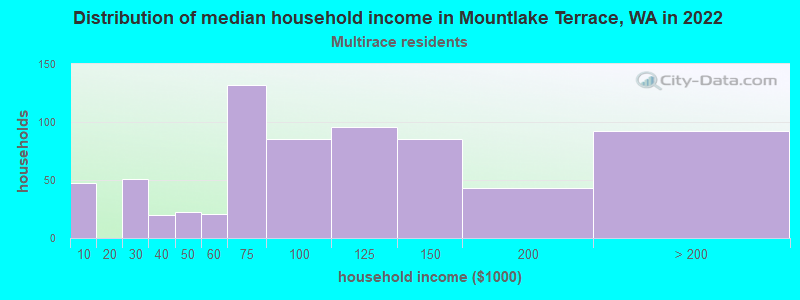
Income and house value in Mountlake Terrace Median household income in 2022 $93,693 White non-Hispanic householders$66,264 Black householders$89,949 American Indian and Alaska Native householders$111,013 Asian householders$88,267 Some other race householders$84,649 Two or more races householders$81,819 Hispanic or Latino race householdersMedian 2022 house value $689,269 White Non-Hispanic householders$670,190 Black or African American householders$766,395 American Indian or Alaska Native householders $718,496 Asian householders$676,685 Some other race householders$674,249 Two or more races householders$646,240 Hispanic or Latino householders
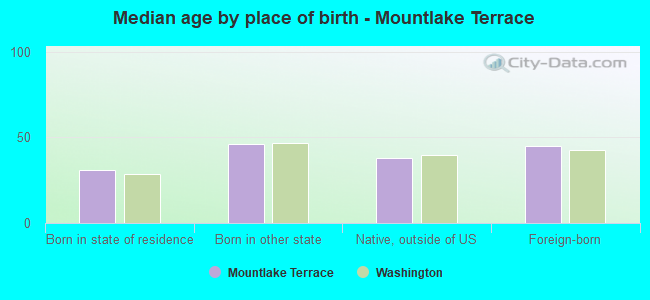
Median age by race in Mountlake Terrace
42.3 Median age for White residents40.3 43.9 32.9 Median age for Black or African American residents32.8 32.8 41.6 Median age for American Indian / Alaska Native residents48.1 25.2 52.8 Median age for Asian residents51.7 53.2 22.1 Median age for Native Hawaiian / Pacific Islander residents21.4 40.8 27.3 Median age for Other race residents26.8 28.6 32.6 Median age for Two or more races residents34.3 32.8 43.2 Median age for White alone residents40.7 44.9 30.0 Median age for Hispanic or Latino residents34.1 26.4
Owner/renter occupied households by race in Mountlake Terrace
House owners and renters - White residents 3,910 61.3% Owner occupied2,468 38.7% Renter occupiedHouse owners and renters - Black or African American residents 50 8.4% Owner occupied541 91.6% Renter occupiedHouse owners and renters - American Indian / Alaska Native residents 25 33.5% Owner occupied50 66.5% Renter occupiedHouse owners and renters - Asian residents 768 78.7% Owner occupied208 21.3% Renter occupiedHouse owners and renters - Other race residents 214 43.5% Owner occupied278 56.5% Renter occupiedHouse owners and renters - Two or more races residents 324 44.9% Owner occupied399 55.1% Renter occupiedHouse owners and renters - White alone residents 3,872 62.1% Owner occupied2,364 37.9% Renter occupiedHouse owners and renters - Hispanic or Latino residents 314 39.9% Owner occupied473 60.1% Renter occupied
Language usage in Mountlake Terrace
English speakers - Total 76.9% of residents of Mountlake Terrace speak English at home.
8.3% of residents speak Spanish at home 1,085 63.0% Speak English very well636 37.0% Speak English less than very well14.7% of residents speak other language at home 1,985 64.9% Speak English very well1,073 35.1% Speak English less than very well
English speakers - Born in the United States 91.0% of residents of Mountlake Terrace speak English at home.
4.6% of residents speak Spanish at home 313 95.1% Speak English very well16 4.9% Speak English less than very well4.3% of residents speak other language at home 249 81.9% Speak English very well55 18.1% Speak English less than very well
English speakers - Native, born elsewhere 75.0% of residents of Mountlake Terrace speak English at home.
7.6% of residents speak Spanish at home 34 79.1% Speak English very well9 20.9% Speak English less than very well18.7% of residents speak other language at home 95 89.6% Speak English very well11 10.4% Speak English less than very well
English speakers - Foreign-born 21.3% of residents of Mountlake Terrace speak English at home.
19.0% of residents speak Spanish at home 237 30.5% Speak English very well539 69.5% Speak English less than very well59.9% of residents speak other language at home 1,486 60.9% Speak English very well956 39.1% Speak English less than very well
White (Caucasian) - Speak only English Native:
96.7% (11,940)Foreign-born:
38.5% (284)
White (Caucasian) - Speak another language Native:
3.3% (410)Foreign-born:
62.0% (458)
Black or African American - Speak only English Native:
100.0% (687)Foreign-born:
4.1% (12)
Black or African American - Speak another language Native:
2.1% (15)Foreign-born:
80.6% (238)
American Indian / Alaska Native - Speak only English Native:
79.3% (129)Foreign-born:
19.8% (26)
American Indian / Alaska Native - Speak another language Native:
21.7% (35)Foreign-born:
74.6% (98)
Asian - Speak only English Native:
46.3% (224)Foreign-born:
18.7% (366)
Asian - Speak another language Native:
53.9% (261)Foreign-born:
82.1% (1,606)
Other race - Speak only English Native:
20.4% (225)Foreign-born:
14.2% (122)
Other race - Speak another language Native:
82.0% (906)Foreign-born:
87.3% (752)
Two or more races - Speak only English Native:
93.0% (1,902)Foreign-born:
19.0% (28)
Two or more races - Speak another language Native:
7.4% (151)Foreign-born:
81.0% (118)
White alone - Speak only English Native:
97.2% (11,660)Foreign-born:
37.8% (287)
White alone - Speak another language Native:
2.8% (331)Foreign-born:
61.3% (465)
Hispanic or Latino - Speak only English Native:
45.3% (799)Foreign-born:
12.4% (120)
Hispanic or Latino - Speak another language Native:
51.8% (912)Foreign-born:
87.9% (850)
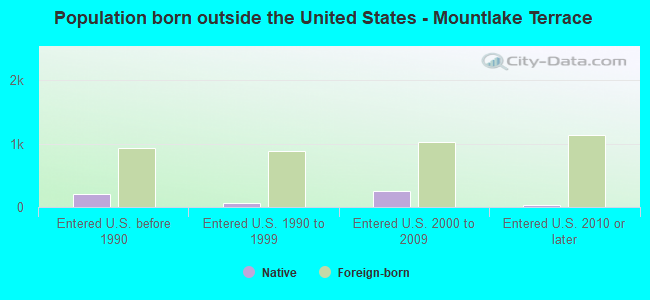
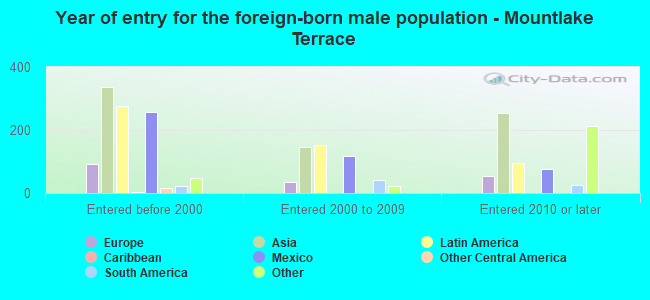
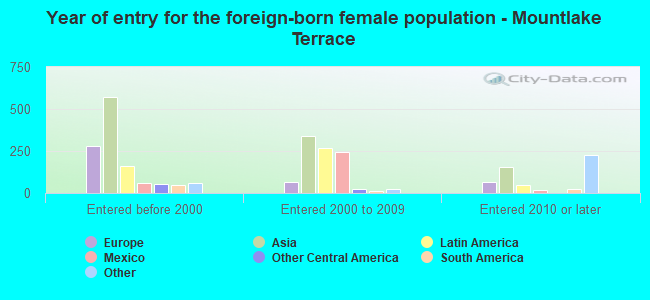
Foreign-born residents in Mountlake Terrace 4,052 residents are foreign born (8.3% Asia , 4.7% Latin America , 2.7% Europe ).
This city:
18.7%Washington:
14.9%
Marital status for residents in Mountlake Terrace Marital status - White (Caucasian) population 15 years and over
Males 33.1% Never married47.6% Now married2.1% Separated3.5% Widowed13.7% DivorcedFemales 21.9% Never married44.7% Now married4.3% Separated9.0% Widowed20.0% DivorcedWomen who gave birth in the past 12 months Now married:
79.6% (70)Unmarried:
20.4% (18)
Women who did not give birth in the past 12 months Now married:
50.2% (1,526)Unmarried:
49.8% (1,511)
Marital status - Black or African American population 15 years and over
Males 30.2% Never married58.5% Now married7.8% Separated1.4% Widowed2.1% DivorcedFemales 67.0% Never married33.0% Now married0.0% Separated0.0% Widowed0.0% DivorcedWomen who did not give birth in the past 12 months Now married:
45.1% (184)Unmarried:
54.9% (225)
Marital status - American Indian / Alaska Native population 15 years and over
Males 30.9% Never married59.4% Now married0.0% Separated0.0% Widowed9.7% DivorcedFemales 0.0% Never married85.7% Now married0.0% Separated0.0% Widowed14.3% DivorcedWomen who gave birth in the past 12 months Now married:
100.0% (39)Unmarried:
0.0% (0)
Women who did not give birth in the past 12 months Now married:
100.0% (30)Unmarried:
0.0% (0)
Marital status - Asian population 15 years and over
Males 24.6% Never married71.0% Now married0.0% Separated0.0% Widowed4.4% DivorcedFemales 21.0% Never married56.2% Now married0.0% Separated13.6% Widowed9.2% DivorcedWomen who gave birth in the past 12 months Now married:
100.0% (10)Unmarried:
0.0% (0)
Women who did not give birth in the past 12 months Now married:
45.0% (276)Unmarried:
55.0% (337)
Marital status - Native Hawaiian / Pacific Islander population 15 years and over
Males 81.3% Never married18.7% Now married0.0% Separated0.0% Widowed0.0% DivorcedFemales 0.0% Never married71.4% Now married0.0% Separated0.0% Widowed28.6% DivorcedWomen who did not give birth in the past 12 months Now married:
100.0% (11)Unmarried:
0.0% (0)
Marital status - Other race population 15 years and over
Males 44.7% Never married42.3% Now married10.8% Separated0.0% Widowed2.2% DivorcedFemales 43.0% Never married39.0% Now married12.4% Separated2.3% Widowed3.4% DivorcedWomen who did not give birth in the past 12 months Now married:
51.4% (329)Unmarried:
48.6% (310)
Marital status - Two or more races population 15 years and over
Males 39.2% Never married37.9% Now married0.0% Separated0.0% Widowed22.8% DivorcedFemales 48.1% Never married31.7% Now married7.5% Separated0.0% Widowed12.8% DivorcedWomen who gave birth in the past 12 months Now married:
0.0% (0)Unmarried:
100.0% (2)
Women who did not give birth in the past 12 months Now married:
39.9% (319)Unmarried:
60.1% (481)
Marital status - White alone, not Hispanic / Latino population 15 years and over
Males 32.3% Never married47.9% Now married1.9% Separated3.6% Widowed14.2% DivorcedFemales 21.4% Never married45.3% Now married3.9% Separated9.3% Widowed20.2% DivorcedWomen who gave birth in the past 12 months Now married:
79.6% (71)Unmarried:
20.4% (18)
Women who did not give birth in the past 12 months Now married:
50.2% (1,460)Unmarried:
49.8% (1,448)
Marital status - Hispanic or Latino population 15 years and over
Males 42.4% Never married41.6% Now married7.6% Separated0.0% Widowed8.4% DivorcedFemales 33.1% Never married43.8% Now married11.3% Separated1.8% Widowed10.0% DivorcedWomen who gave birth in the past 12 months Now married:
100.0% (29)Unmarried:
0.0% (0)
Women who did not give birth in the past 12 months Now married:
56.9% (447)Unmarried:
43.1% (339)
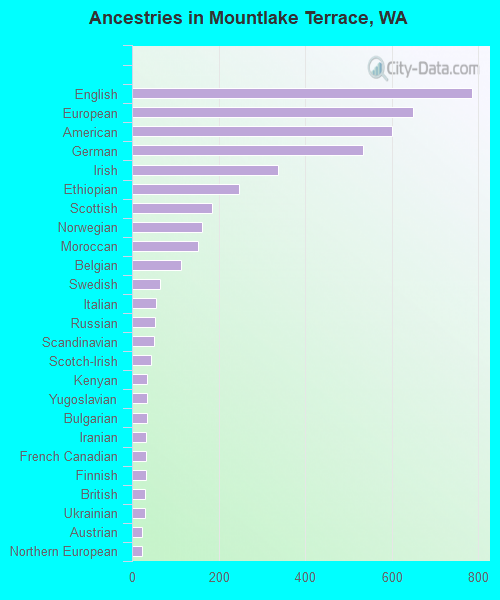
Ancestries in Mountlake Terrace
785 8.3% English649 6.9% European601 6.4% American534 5.7% German337 3.6% Irish247 2.6% Ethiopian185 2.0% Scottish162 1.7% Norwegian152 1.6% Moroccan112 1.2% Belgian65 0.7% Swedish55 0.6% Italian53 0.6% Russian51 0.5% Scandinavian45 0.5% Scotch-Irish35 0.4% Kenyan34 0.4% Yugoslavian34 0.4% Bulgarian33 0.4% Iranian33 0.4% French Canadian32 0.3% Finnish30 0.3% British29 0.3% Ukrainian23 0.2% Austrian23 0.2% Northern European22 0.2% Greek20 0.2% Canadian17 0.2% African15 0.2% Hungarian14 0.1% Afghan13 0.1% French12 0.1% Czechoslovakian12 0.1% Jamaican10 0.1% Latvian8 0.08% Sudanese8 0.08% Icelander7 0.07% Polish6 0.06% Eastern European5 0.05% Dutch5 0.05% Lebanese4 0.04% Lithuanian
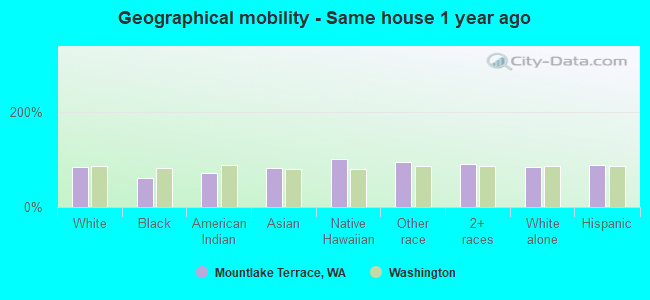
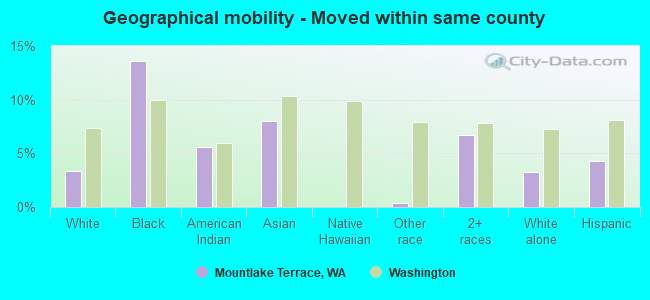
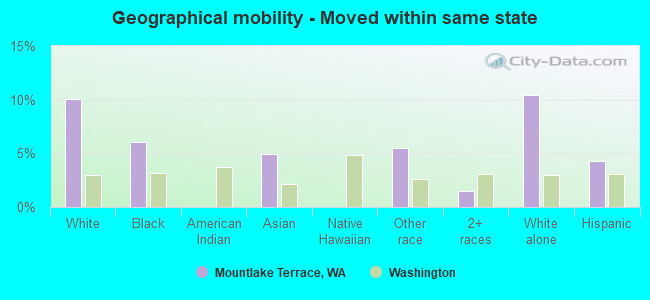
Geographical mobility in Mountlake Terrace Same house 1 year ago 11,132 83.1% White (Caucasian)649 60.0% Black or African American194 71.8% American Indian / Alaska Native2,040 81.7% Asian138 100.0% Native Hawaiian / Pacific Islander1,884 93.9% Other race2,119 90.4% Two or more races10,823 83.1% White alone, not Hispanic / Latino2,514 87.7% Hispanic or LatinoMoved within same county 455 3.4% White / Caucasian147 13.6% Black or African American15 5.6% American Indian / Alaska Native199 8.0% Asian7 0.4% Other race157 6.7% Two or more races424 3.3% White alone, not Hispanic / Latino123 4.3% Hispanic or LatinoMoved within same state 1,343 10.0% White / Caucasian66 6.1% Black or African American124 5.0% Asian111 5.5% Other race36 1.5% Two or more races1,353 10.4% White alone, not Hispanic / Latino124 4.3% Hispanic or LatinoMoved from different state 548 4.1% White / Caucasian163 15.1% Black or African American64 23.7% American Indian / Alaska Native65 2.6% Asian41 2.1% Other race13 0.6% Two or more races524 4.0% White alone, not Hispanic / Latino73 2.5% Hispanic or LatinoMoved from abroad 119 0.9% White44 1.8% Asian10 0.5% Other race104 0.8% White alone, not Hispanic / Latino42 1.5% Hispanic or Latino
Children Nativity (place of birth) in Mountlake Terrace
Children under 6 years - Living with two parents Both parents native 693 100.0% NativeBoth parents foreign-born 207 94.5% Native12 5.5% Foreign-bornOne native, one foreign-born parent 181 100.0% NativeChildren under 6 years - Living with one parent Native parent 52 100.0% NativeChildren 6 to 17 years - Living with two parents Both parents native 854 99.0% Native8 1.0% Foreign-bornBoth parents foreign-born 436 93.2% Native32 6.8% Foreign-bornOne native, one foreign-born parent 194 100.0% NativeChildren 6 to 17 years - Living with one parent Native parent 1,004 100.0% NativeForeign-born parent 226 55.5% Native181 44.5% Foreign-born
Grandparents responsible for own grandchildren in Mountlake Terrace
Grandparents (30 to 59 years) White / Caucasian 24 39.5% Responsible for grandchildren37 60.5% Not responsible for grandchildrenWhite alone, not Hispanic / Latino 26 39.7% Responsible for grandchildren39 60.3% Not responsible for grandchildrenGrandparents (60 years and over) White / Caucasian 9 14.8% Responsible for grandchildren50 85.2% Not responsible for grandchildrenWhite alone, not Hispanic / Latino 9 14.3% Responsible for grandchildren52 85.7% Not responsible for grandchildren