Races in Mount Holly, North Carolina (NC) Detailed Stats
Data:
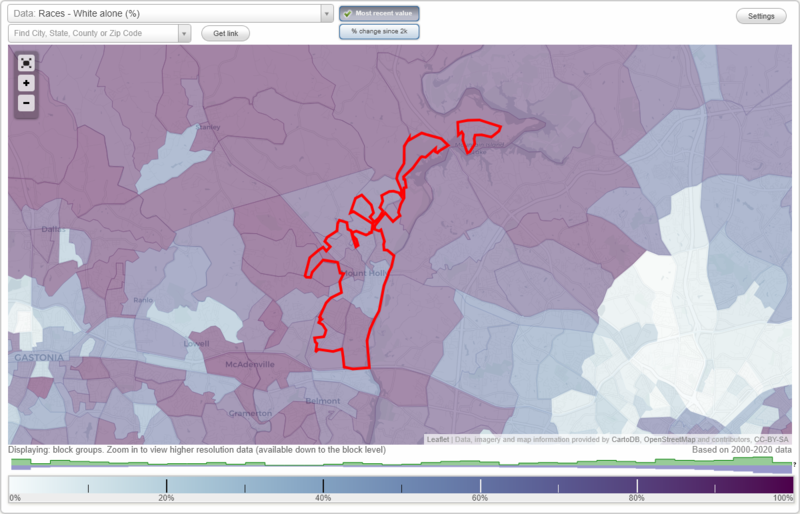
Races - White alone (%)
Races - White alone (% change since 2000)
Races - Black alone (%)
Races - Black alone (% change since 2000)
Races - American Indian alone (%)
Races - American Indian alone (% change since 2000)
Races - Asian alone (%)
Races - Asian alone (% change since 2000)
Races - Hispanic (%)
Races - Hispanic (% change since 2000)
Races - Native Hawaiian and Other Pacific Islander alone (%)
Races - Native Hawaiian and Other Pacific Islander alone (% change since 2000)
Races - Two or more races(%)
Races - Two or more races(% change since 2000)
Races - Other race alone (%)
Races - Other race alone (% change since 2000)
Racial diversity
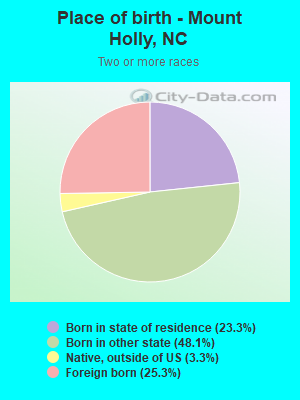
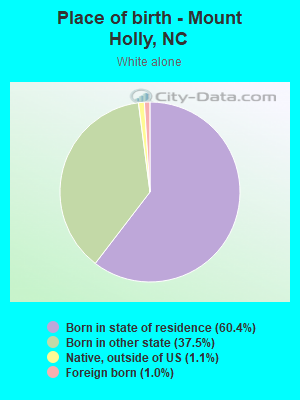
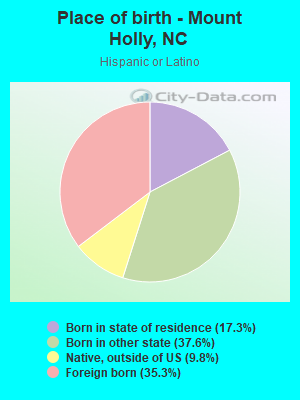
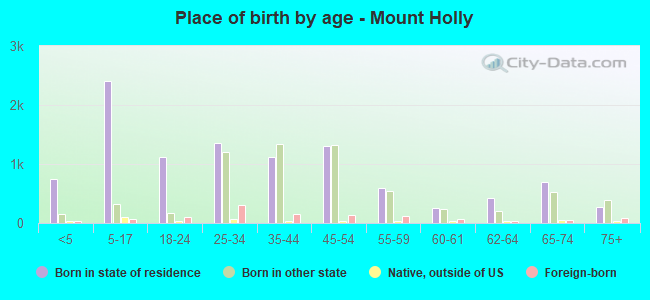
Place of birth - Born in state of residence (%)
Place of birth - Born in state of residence (%) - White
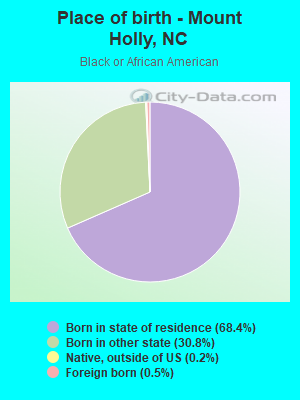
Place of birth - Born in state of residence (%) - Black or African American
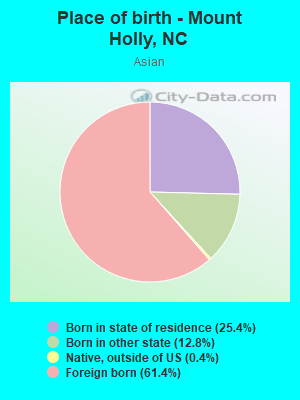
Place of birth - Born in state of residence (%) - Asian
Place of birth - Born in state of residence (%) - Hispanic or Latino
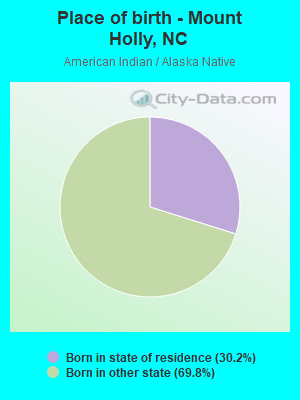
Place of birth - Born in state of residence (%) - American Indian and Alaska Native
Place of birth - Born in state of residence (%) - Multirace
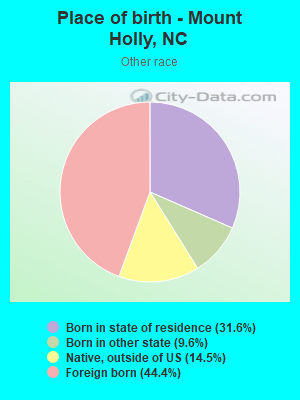
Place of birth - Born in state of residence (%) - Other Race
Place of birth - Born in other state (%)
Place of birth - Born in other state (%) - White
Place of birth - Born in other state (%) - Black or African American
Place of birth - Born in other state (%) - Asian
Place of birth - Born in other state (%) - Hispanic or Latino
Place of birth - Born in other state (%) - American Indian and Alaska Native
Place of birth - Born in other state (%) - Multirace
Place of birth - Born in other state (%) - Other Race
Place of birth - Native, outside of US (%)
Place of birth - Native, outside of US (%) - White
Place of birth - Native, outside of US (%) - Black or African American
Place of birth - Native, outside of US (%) - Asian
Place of birth - Native, outside of US (%) - Hispanic or Latino
Place of birth - Native, outside of US (%) - American Indian and Alaska Native
Place of birth - Native, outside of US (%) - Multirace
Place of birth - Native, outside of US (%) - Other Race
Place of birth - Foreign born (%)
Place of birth - Foreign born (%) - White
Place of birth - Foreign born (%) - Black or African American
Place of birth - Foreign born (%) - Asian
Place of birth - Foreign born (%) - Hispanic or Latino
Place of birth - Foreign born (%) - American Indian and Alaska Native
Place of birth - Foreign born (%) - Multirace
Place of birth - Foreign born (%) - Other Race
Residents speaking English at home (%)
Residents speaking English at home - Born in the United States (%)
Residents speaking English at home - Native, born elsewhere (%)
Residents speaking English at home - Foreign born (%)
Residents speaking Spanish at home (%)
Residents speaking Spanish at home - Born in the United States (%)
Residents speaking Spanish at home - Native, born elsewhere (%)
Residents speaking Spanish at home - Foreign born (%)
Residents speaking other language at home (%)
Residents speaking other language at home - Born in the United States (%)
Residents speaking other language at home - Native, born elsewhere (%)
Residents speaking other language at home - Foreign born (%)
Marital status - Never married (%)
Marital status - Now married (%)
Marital status - Separated (%)
Marital status - Widowed (%)
Marital status - Divorced (%)
Ancestries Reported - Arab (%)
Ancestries Reported - Czech (%)
Ancestries Reported - Danish (%)
Ancestries Reported - Dutch (%)
Ancestries Reported - English (%)
Ancestries Reported - French (%)
Ancestries Reported - French Canadian (%)
Ancestries Reported - German (%)
Ancestries Reported - Greek (%)
Ancestries Reported - Hungarian (%)
Ancestries Reported - Irish (%)
Ancestries Reported - Italian (%)
Ancestries Reported - Lithuanian (%)
Ancestries Reported - Norwegian (%)
Ancestries Reported - Polish (%)
Ancestries Reported - Portuguese (%)
Ancestries Reported - Russian (%)
Ancestries Reported - Scotch-Irish (%)
Ancestries Reported - Scottish (%)
Ancestries Reported - Slovak (%)
Ancestries Reported - Subsaharan African (%)
Ancestries Reported - Swedish (%)
Ancestries Reported - Swiss (%)
Ancestries Reported - Ukrainian (%)
Ancestries Reported - United States (%)
Ancestries Reported - Welsh (%)
Ancestries Reported - West Indian (%)
Ancestries Reported - Other (%)
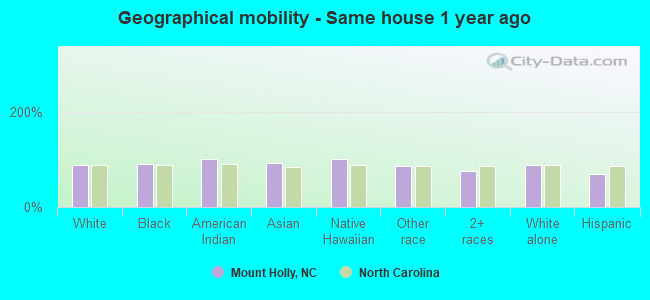
Geographical mobility - Same house 1 year ago (%)
Geographical mobility - Same house 1 year ago (%) - White
Geographical mobility - Same house 1 year ago (%) - Black or African American
Geographical mobility - Same house 1 year ago (%) - Asian
Geographical mobility - Same house 1 year ago (%) - Hispanic or Latino
Geographical mobility - Same house 1 year ago (%) - American Indian and Alaska Native
Geographical mobility - Same house 1 year ago (%) - Multirace
Geographical mobility - Same house 1 year ago (%) - Other Race
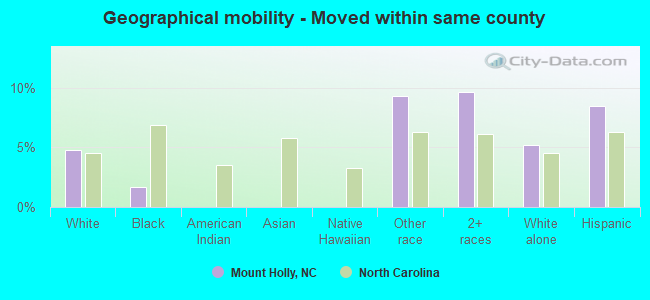
Geographical mobility - Moved within same county (%)
Geographical mobility - Moved within same county (%) - White
Geographical mobility - Moved within same county (%) - Black or African American
Geographical mobility - Moved within same county (%) - Asian
Geographical mobility - Moved within same county (%) - Hispanic or Latino
Geographical mobility - Moved within same county (%) - American Indian and Alaska Native
Geographical mobility - Moved within same county (%) - Multirace
Geographical mobility - Moved within same county (%) - Other Race
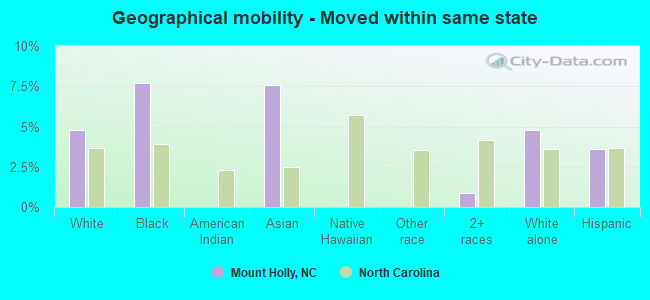
Geographical mobility - Moved from different county within same state (%)
Geographical mobility - Moved from different county within same state (%) - White
Geographical mobility - Moved from different county within same state (%) - Black or African American
Geographical mobility - Moved from different county within same state (%) - Asian
Geographical mobility - Moved from different county within same state (%) - Hispanic or Latino
Geographical mobility - Moved from different county within same state (%) - American Indian and Alaska Native
Geographical mobility - Moved from different county within same state (%) - Multirace
Geographical mobility - Moved from different county within same state (%) - Other Race
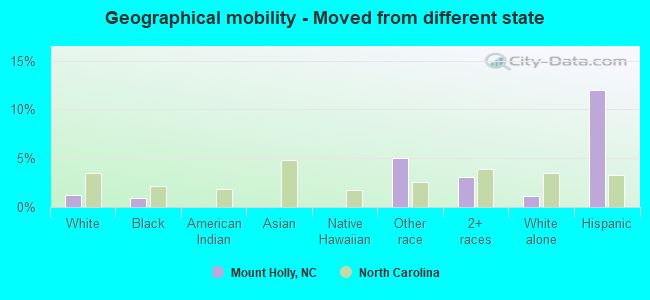
Geographical mobility - Moved from different state (%)
Geographical mobility - Moved from different state (%) - White
Geographical mobility - Moved from different state (%) - Black or African American
Geographical mobility - Moved from different state (%) - Asian
Geographical mobility - Moved from different state (%) - Hispanic or Latino
Geographical mobility - Moved from different state (%) - American Indian and Alaska Native
Geographical mobility - Moved from different state (%) - Multirace
Geographical mobility - Moved from different state (%) - Other Race
Geographical mobility - Moved from abroad (%)
Geographical mobility - Moved from abroad (%) - White
Geographical mobility - Moved from abroad (%) - Black or African American
Geographical mobility - Moved from abroad (%) - Asian
Geographical mobility - Moved from abroad (%) - Hispanic or Latino
Geographical mobility - Moved from abroad (%) - American Indian and Alaska Native
Geographical mobility - Moved from abroad (%) - Multirace
Geographical mobility - Moved from abroad (%) - Other Race
Place of birth for the foreign-born population - Ireland (%)
Place of birth for the foreign-born population - Denmark (%)
Place of birth for the foreign-born population - Norway (%)
Place of birth for the foreign-born population - Sweden (%)
Place of birth for the foreign-born population - United Kingdom (%)
Place of birth for the foreign-born population - England (%)
Place of birth for the foreign-born population - Scotland (%)
Place of birth for the foreign-born population - Other Northern Europe (%)
Place of birth for the foreign-born population - Austria (%)
Place of birth for the foreign-born population - Belgium (%)
Place of birth for the foreign-born population - France (%)
Place of birth for the foreign-born population - Germany (%)
Place of birth for the foreign-born population - Netherlands (%)
Place of birth for the foreign-born population - Switzerland (%)
Place of birth for the foreign-born population - Other Western Europe (%)
Place of birth for the foreign-born population - Greece (%)
Place of birth for the foreign-born population - Italy (%)
Place of birth for the foreign-born population - Portugal (%)
Place of birth for the foreign-born population - Spain (%)
Place of birth for the foreign-born population - Other Southern Europe (%)
Place of birth for the foreign-born population - Albania (%)
Place of birth for the foreign-born population - Belarus (%)
Place of birth for the foreign-born population - Bosnia and Herzegovina (%)
Place of birth for the foreign-born population - Bulgaria (%)
Place of birth for the foreign-born population - Croatia (%)
Place of birth for the foreign-born population - Czechoslovakia (%)
Place of birth for the foreign-born population - Hungary (%)
Place of birth for the foreign-born population - Latvia (%)
Place of birth for the foreign-born population - Lithuania (%)
Place of birth for the foreign-born population - North Macedonia (Macedonia) (%)
Place of birth for the foreign-born population - Moldova (%)
Place of birth for the foreign-born population - Poland (%)
Place of birth for the foreign-born population - Romania (%)
Place of birth for the foreign-born population - Russia (%)
Place of birth for the foreign-born population - Serbia (%)
Place of birth for the foreign-born population - Ukraine (%)
Place of birth for the foreign-born population - Other Eastern Europe (%)
Place of birth for the foreign-born population - China (%)
Place of birth for the foreign-born population - Hong Kong (%)
Place of birth for the foreign-born population - Taiwan (%)
Place of birth for the foreign-born population - Japan (%)
Place of birth for the foreign-born population - Korea (%)
Place of birth for the foreign-born population - Other Eastern Asia (%)
Place of birth for the foreign-born population - Afghanistan (%)
Place of birth for the foreign-born population - Bangladesh (%)
Place of birth for the foreign-born population - India (%)
Place of birth for the foreign-born population - Iran (%)
Place of birth for the foreign-born population - Kazakhstan (%)
Place of birth for the foreign-born population - Nepal (%)
Place of birth for the foreign-born population - Pakistan (%)
Place of birth for the foreign-born population - Sri Lanka (%)
Place of birth for the foreign-born population - Uzbekistan (%)
Place of birth for the foreign-born population - Other South Central Asia (%)
Place of birth for the foreign-born population - Burma (%)
Place of birth for the foreign-born population - Cambodia (%)
Place of birth for the foreign-born population - Indonesia (%)
Place of birth for the foreign-born population - Laos (%)
Place of birth for the foreign-born population - Malaysia (%)
Place of birth for the foreign-born population - Philippines (%)
Place of birth for the foreign-born population - Singapore (%)
Place of birth for the foreign-born population - Thailand (%)
Place of birth for the foreign-born population - Vietnam (%)
Place of birth for the foreign-born population - Other South Eastern Asia (%)
Place of birth for the foreign-born population - Armenia (%)
Place of birth for the foreign-born population - Iraq (%)
Place of birth for the foreign-born population - Israel (%)
Place of birth for the foreign-born population - Jordan (%)
Place of birth for the foreign-born population - Kuwait (%)
Place of birth for the foreign-born population - Lebanon (%)
Place of birth for the foreign-born population - Saudi Arabia (%)
Place of birth for the foreign-born population - Syria (%)
Place of birth for the foreign-born population - Turkey (%)
Place of birth for the foreign-born population - Yemen (%)
Place of birth for the foreign-born population - Other Western Asia (%)
Place of birth for the foreign-born population - Eritrea (%)
Place of birth for the foreign-born population - Ethiopia (%)
Place of birth for the foreign-born population - Kenya (%)
Place of birth for the foreign-born population - Somalia (%)
Place of birth for the foreign-born population - Uganda (%)
Place of birth for the foreign-born population - Zimbabwe (%)
Place of birth for the foreign-born population - Other Eastern Africa (%)
Place of birth for the foreign-born population - Cameroon (%)
Place of birth for the foreign-born population - Congo (%)
Place of birth for the foreign-born population - Democratic Republic of Congo (Zaire) (%)
Place of birth for the foreign-born population - Other Middle Africa (%)
Place of birth for the foreign-born population - Egypt (%)
Place of birth for the foreign-born population - Morocco (%)
Place of birth for the foreign-born population - Sudan (%)
Place of birth for the foreign-born population - Other Northern Africa (%)
Place of birth for the foreign-born population - South Africa (%)
Place of birth for the foreign-born population - Other Southern Africa (%)
Place of birth for the foreign-born population - Cabo Verde (%)
Place of birth for the foreign-born population - Ghana (%)
Place of birth for the foreign-born population - Liberia (%)
Place of birth for the foreign-born population - Nigeria (%)
Place of birth for the foreign-born population - Senegal (%)
Place of birth for the foreign-born population - Sierra Leone (%)
Place of birth for the foreign-born population - Other Western Africa (%)
Place of birth for the foreign-born population - Australia (%)
Place of birth for the foreign-born population - New Zealand (%)
Place of birth for the foreign-born population - Fiji (%)
Place of birth for the foreign-born population - Micronesia (%)
Place of birth for the foreign-born population - Bahamas (%)
Place of birth for the foreign-born population - Barbados (%)
Place of birth for the foreign-born population - Cuba (%)
Place of birth for the foreign-born population - Dominica (%)
Place of birth for the foreign-born population - Dominican Republic (%)
Place of birth for the foreign-born population - Grenada (%)
Place of birth for the foreign-born population - Haiti (%)
Place of birth for the foreign-born population - Jamaica (%)
Place of birth for the foreign-born population - St. Vincent and the Grenadines (%)
Place of birth for the foreign-born population - Trinidad and Tobago (%)
Place of birth for the foreign-born population - West Indies (%)
Place of birth for the foreign-born population - Other Caribbean (%)
Place of birth for the foreign-born population - Belize (%)
Place of birth for the foreign-born population - Costa Rica (%)
Place of birth for the foreign-born population - El Salvador (%)
Place of birth for the foreign-born population - Guatemala (%)
Place of birth for the foreign-born population - Honduras (%)
Place of birth for the foreign-born population - Mexico (%)
Place of birth for the foreign-born population - Nicaragua (%)
Place of birth for the foreign-born population - Panama (%)
Place of birth for the foreign-born population - Other Central America (%)
Place of birth for the foreign-born population - Argentina (%)
Place of birth for the foreign-born population - Bolivia (%)
Place of birth for the foreign-born population - Brazil (%)
Place of birth for the foreign-born population - Chile (%)
Place of birth for the foreign-born population - Colombia (%)
Place of birth for the foreign-born population - Ecuador (%)
Place of birth for the foreign-born population - Guyana (%)
Place of birth for the foreign-born population - Peru (%)
Place of birth for the foreign-born population - Uruguay (%)
Place of birth for the foreign-born population - Venezuela (%)
Place of birth for the foreign-born population - Other South America (%)
Place of birth for the foreign-born population - Canada (%)
Place of birth for the foreign-born population - Other Northern America (%)
Place of birth for the foreign-born population - Other (%)
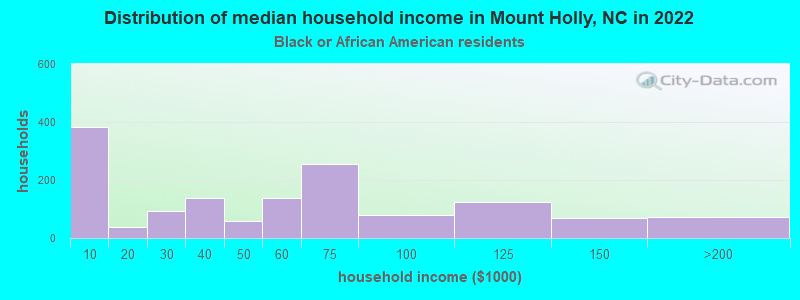
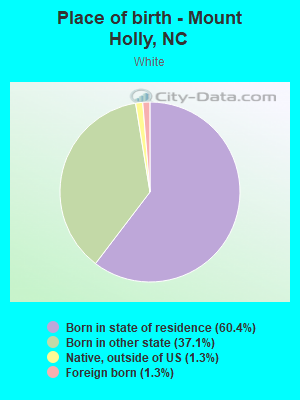
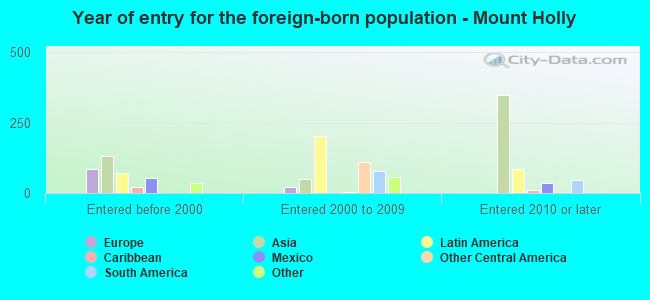
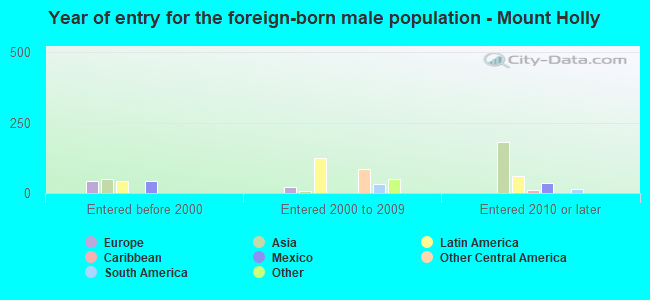
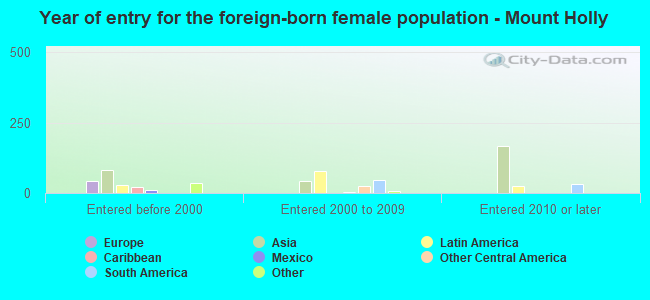
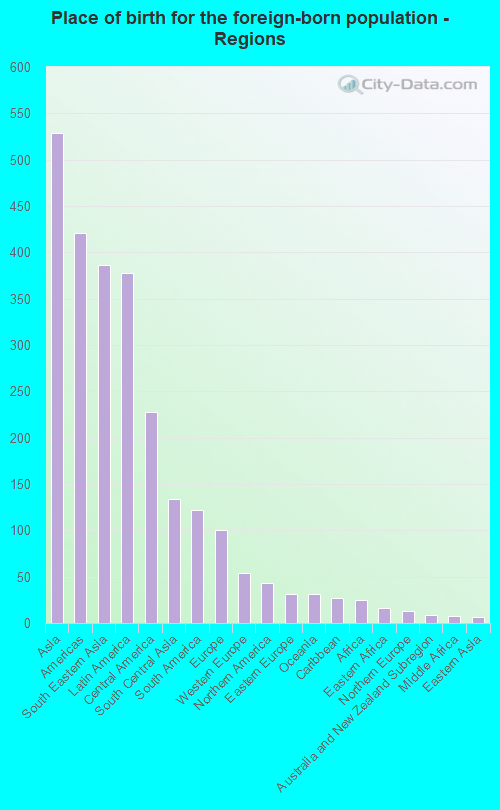
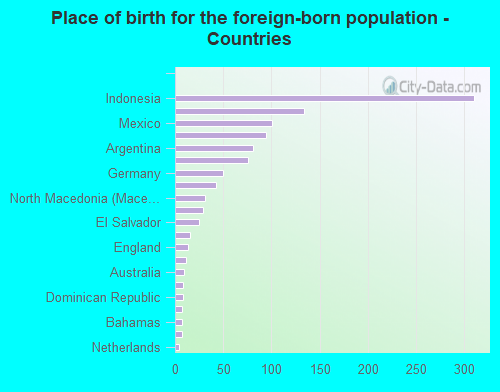
According to 2022 data, the most numerous races in Mount Holly, NC are White alone (12,663 residents), Black alone (2,585 residents), and Hispanic (1,192 residents). 91.8% of Mount Holly residents speak English at home. 6.1% of Mount Holly, NC residents are foreign-born (2.8% born in Asia, 2.0% born in Latin America), which is 30.3% less than the foreign-born rate of 8.0% across the entire state of North Carolina.
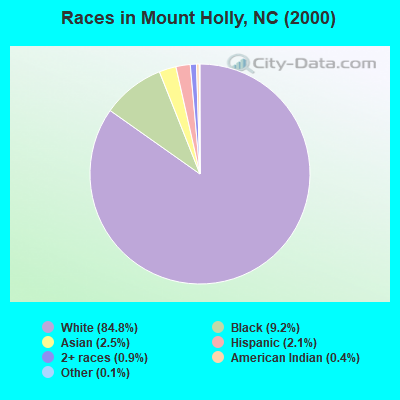
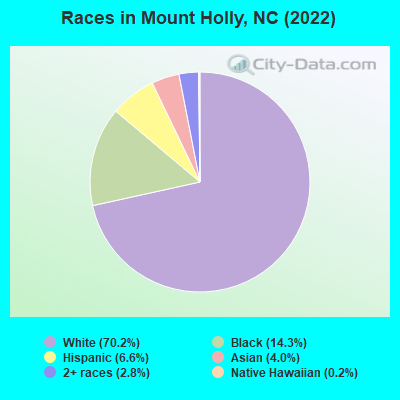
Race distribution in Mount Holly
2000 2022
5,647,155 70.2% White alone 1,723,301 21.4% Black alone 378,963 4.7% Hispanic 112,416 1.4% Asian alone 95,333 1.2% American Indian alone 79,965 1.0% Two or more races 9,015 0.1% Other race alone 3,165 0.04% Native Hawaiian and Other
6,497,519 60.7% White alone 2,155,650 20.1% Black alone 1,114,799 10.4% Hispanic 438,061 4.1% Two or more races 341,052 3.2% Asian alone 91,758 0.9% American Indian alone 50,180 0.5% Other race alone 9,954 0.09% Native Hawaiian and Other
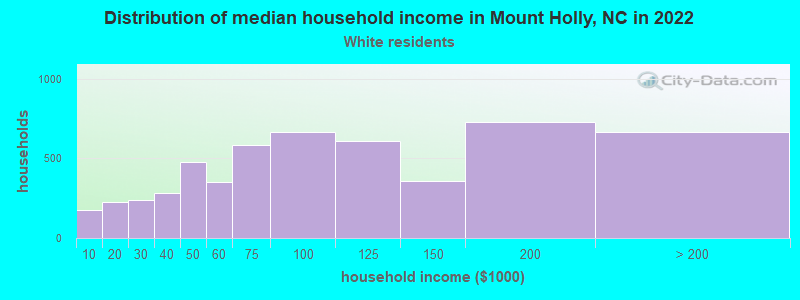
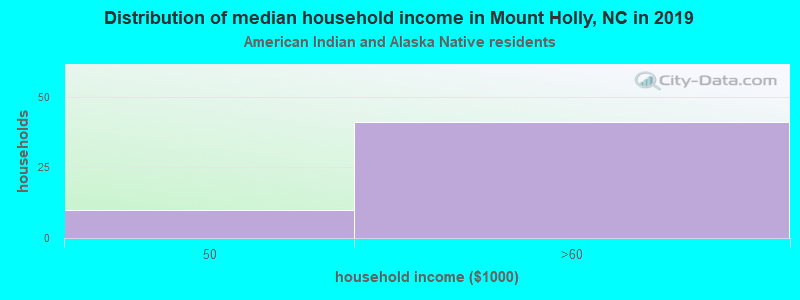
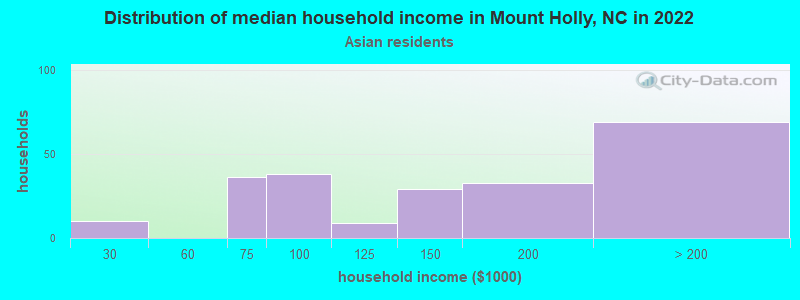
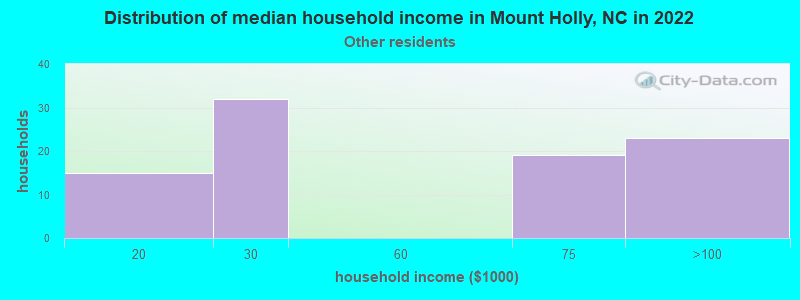
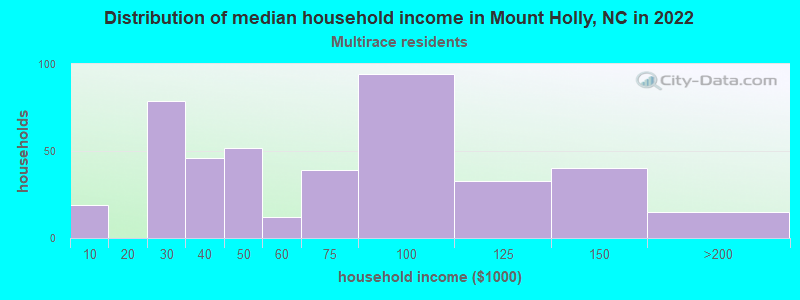
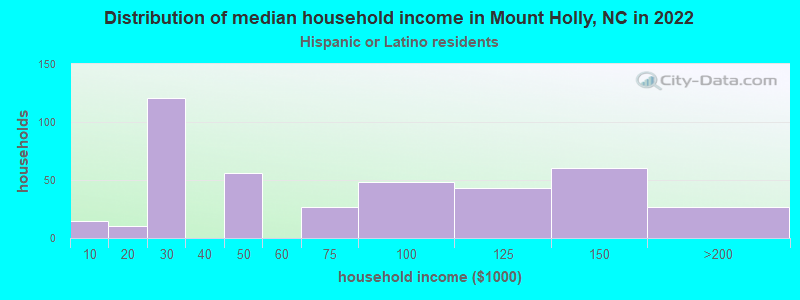
Income and house value in Mount Holly Median household income in 2022 $92,069 White non-Hispanic householders$56,271 Black householders$156,638 Asian householders$56,074 Two or more races householdersMedian 2022 house value $326,349 White Non-Hispanic householders$293,895 Black or African American householders$286,322 American Indian or Alaska Native householders$405,683 Some other race householders$306,516 Hispanic or Latino householders
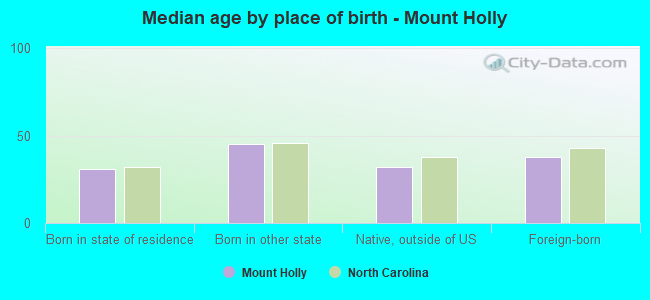
Median age by race in Mount Holly
40.3 Median age for White residents38.0 41.9 41.7 Median age for Black or African American residents39.4 42.4 -666,666,666.0 Median age for American Indian / Alaska Native residents-668,604,650.5 -682,971,013.8 41.8 Median age for Asian residents34.9 44.8 -900,763,357.9 Median age for Native Hawaiian / Pacific Islander residents-611,708,482.1 -1,335,849,055.3 20.7 Median age for Other race residents14.9 29.3 28.3 Median age for Two or more races residents29.7 18.3 40.9 Median age for White alone residents37.8 43.0 23.7 Median age for Hispanic or Latino residents26.4 17.2
Owner/renter occupied households by race in Mount Holly
House owners and renters - White residents 4,006 76.0% Owner occupied1,265 24.0% Renter occupiedHouse owners and renters - Black or African American residents 609 46.9% Owner occupied690 53.1% Renter occupiedHouse owners and renters - American Indian / Alaska Native residents 7 100.0% Owner occupiedHouse owners and renters - Asian residents 286 97.5% Owner occupied7 2.5% Renter occupiedHouse owners and renters - Other race residents 56 53.6% Owner occupied49 46.4% Renter occupiedHouse owners and renters - Two or more races residents 351 70.5% Owner occupied146 29.5% Renter occupiedHouse owners and renters - White alone residents 3,948 75.8% Owner occupied1,257 24.2% Renter occupiedHouse owners and renters - Hispanic or Latino residents 229 58.6% Owner occupied162 41.4% Renter occupied
Language usage in Mount Holly
English speakers - Total 91.8% of residents of Mount Holly speak English at home.
4.2% of residents speak Spanish at home 359 50.3% Speak English very well355 49.7% Speak English less than very well3.2% of residents speak other language at home 462 84.3% Speak English very well86 15.7% Speak English less than very well
English speakers - Born in the United States 93.3% of residents of Mount Holly speak English at home.
3.2% of residents speak Spanish at home 159 79.9% Speak English very well40 20.1% Speak English less than very well3.0% of residents speak other language at home 184 100.0% Speak English very well
English speakers - Native, born elsewhere 73.2% of residents of Mount Holly speak English at home.
21.7% of residents speak Spanish at home 24 43.6% Speak English very well31 56.4% Speak English less than very well
English speakers - Foreign-born 28.4% of residents of Mount Holly speak English at home.
34.5% of residents speak Spanish at home 116 28.4% Speak English very well292 71.6% Speak English less than very well28.3% of residents speak other language at home 278 83.2% Speak English very well56 16.8% Speak English less than very well
White (Caucasian) - Speak only English Native:
98.7% (12,080)Foreign-born:
75.7% (112)
White (Caucasian) - Speak another language Native:
1.4% (168)Foreign-born:
31.0% (46)
Black or African American - Speak only English Native:
99.1% (2,402)Foreign-born:
75.1% (26)
Black or African American - Speak another language Native:
1.0% (24)Foreign-born:
25.6% (9)
Asian - Speak only English Native:
56.7% (114)Foreign-born:
21.7% (98)
Asian - Speak another language Native:
43.3% (87)Foreign-born:
74.5% (335)
Other race - Speak another language Native:
49.1% (78)Foreign-born:
100.0% (141)
Two or more races - Speak only English Native:
75.3% (556)Foreign-born:
6.7% (22)
Two or more races - Speak another language Native:
24.6% (181)Foreign-born:
92.4% (301)
White alone - Speak only English Native:
98.6% (11,858)Foreign-born:
100.0% (121)
White alone - Speak another language Native:
1.4% (168)Foreign-born:
11.0% (13)
Hispanic or Latino - Speak only English Native:
54.2% (316)Foreign-born:
2.2% (9)
Hispanic or Latino - Speak another language Native:
40.4% (235)Foreign-born:
98.4% (416)
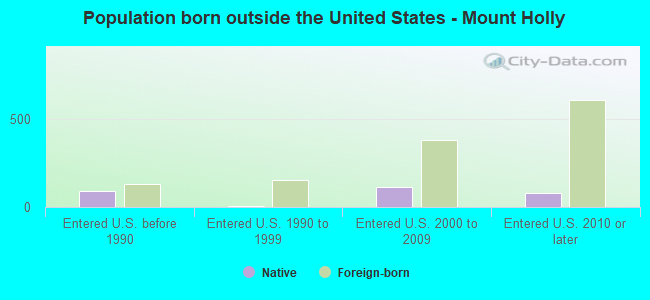
Foreign-born residents in Mount Holly 1,108 residents are foreign born (2.8% Asia , 2.0% Latin America ).
This city:
6.1%North Carolina:
8.3%
Marital status for residents in Mount Holly Marital status - White (Caucasian) population 15 years and over
Males 31.9% Never married55.2% Now married1.1% Separated1.9% Widowed9.8% DivorcedFemales 27.3% Never married49.9% Now married2.0% Separated6.4% Widowed14.3% DivorcedWomen who gave birth in the past 12 months Now married:
44.4% (89)Unmarried:
55.6% (111)
Women who did not give birth in the past 12 months Now married:
53.4% (1,660)Unmarried:
46.6% (1,447)
Marital status - Black or African American population 15 years and over
Males 24.5% Never married51.8% Now married5.7% Separated2.2% Widowed15.8% DivorcedFemales 40.9% Never married36.7% Now married4.3% Separated4.2% Widowed14.0% DivorcedWomen who gave birth in the past 12 months Now married:
0.0% (0)Unmarried:
100.0% (26)
Women who did not give birth in the past 12 months Now married:
36.7% (303)Unmarried:
63.3% (523)
Marital status - Asian population 15 years and over
Males 38.0% Never married54.8% Now married7.2% Separated0.0% Widowed0.0% DivorcedFemales 0.0% Never married100.0% Now married0.0% Separated0.0% Widowed0.0% DivorcedWomen who did not give birth in the past 12 months Now married:
100.0% (220)Unmarried:
0.0% (0)
Marital status - Other race population 15 years and over
Males 45.9% Never married50.0% Now married0.0% Separated0.0% Widowed4.1% DivorcedFemales 24.0% Never married50.0% Now married10.0% Separated0.0% Widowed16.0% DivorcedWomen who gave birth in the past 12 months Now married:
100.0% (13)Unmarried:
0.0% (0)
Women who did not give birth in the past 12 months Now married:
59.3% (46)Unmarried:
40.7% (32)
Marital status - Two or more races population 15 years and over
Males 44.5% Never married51.8% Now married0.0% Separated0.0% Widowed3.7% DivorcedFemales 8.4% Never married65.3% Now married0.0% Separated21.6% Widowed4.8% DivorcedWomen who did not give birth in the past 12 months Now married:
74.1% (56)Unmarried:
25.9% (19)
Marital status - White alone, not Hispanic / Latino population 15 years and over
Males 32.3% Never married54.7% Now married1.1% Separated2.0% Widowed9.9% DivorcedFemales 26.7% Never married50.4% Now married1.7% Separated6.6% Widowed14.6% DivorcedWomen who gave birth in the past 12 months Now married:
41.9% (81)Unmarried:
58.1% (112)
Women who did not give birth in the past 12 months Now married:
53.8% (1,616)Unmarried:
46.2% (1,387)
Marital status - Hispanic or Latino population 15 years and over
Males 37.0% Never married60.8% Now married0.0% Separated0.0% Widowed2.3% DivorcedFemales 30.5% Never married44.4% Now married10.6% Separated9.3% Widowed5.1% DivorcedWomen who gave birth in the past 12 months Now married:
100.0% (22)Unmarried:
0.0% (0)
Women who did not give birth in the past 12 months Now married:
46.2% (112)Unmarried:
53.8% (130)
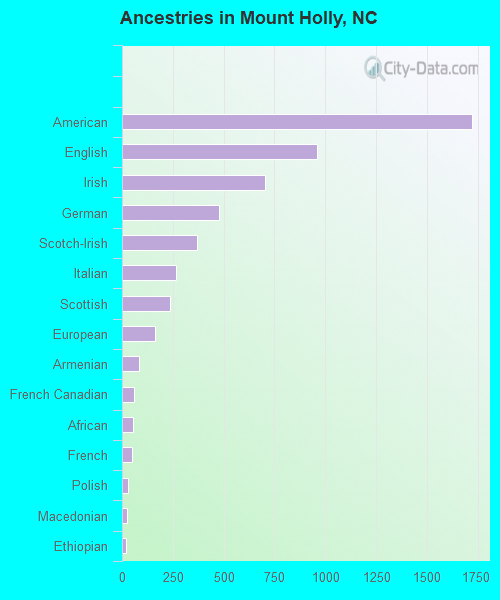
Ancestries in Mount Holly
1,720 19.7% American959 11.0% English703 8.1% Irish479 5.5% German370 4.2% Scotch-Irish268 3.1% Italian238 2.7% Scottish160 1.8% European82 0.9% Armenian61 0.7% French Canadian56 0.6% African47 0.5% French31 0.4% Polish25 0.3% Macedonian18 0.2% Ethiopian15 0.2% Greek14 0.2% Dutch14 0.2% Bahamian12 0.1% West Indian11 0.1% Eastern European7 0.08% Swedish6 0.07% Croatian6 0.07% Danish5 0.06% Welsh2 0.02% Northern European1 0.01% British
Children Nativity (place of birth) in Mount Holly
Children under 6 years - Living with two parents Both parents native 702 100.0% NativeBoth parents foreign-born 19 100.0% NativeOne native, one foreign-born parent 27 100.0% NativeChildren under 6 years - Living with one parent Native parent 273 100.0% NativeForeign-born parent 101 100.0% NativeChildren 6 to 17 years - Living with two parents Both parents native 1,654 99.3% Native12 0.7% Foreign-bornBoth parents foreign-born 37 71.5% Native15 28.5% Foreign-bornOne native, one foreign-born parent 113 100.0% NativeChildren 6 to 17 years - Living with one parent Native parent 655 99.4% Native4 0.6% Foreign-bornForeign-born parent 41 72.6% Native15 27.4% Foreign-born
Grandparents responsible for own grandchildren in Mount Holly
Grandparents (30 to 59 years) White / Caucasian 17 14.2% Responsible for grandchildren101 85.8% Not responsible for grandchildrenWhite alone, not Hispanic / Latino 17 19.6% Responsible for grandchildren68 80.4% Not responsible for grandchildrenGrandparents (60 years and over) White / Caucasian 55 35.9% Responsible for grandchildren98 64.1% Not responsible for grandchildrenWhite alone, not Hispanic / Latino 55 35.1% Responsible for grandchildren101 64.9% Not responsible for grandchildren